What is High Tight Flag Chart Pattern :
X
  • وقت
  • دکھائیں
Clear All
new posts
  • #1 Collapse

    What is High Tight Flag Chart Pattern :
    INTRODUCTION TO THE HIGH TIGHT FLAG CHART PATTERN :


    High Tight Flag Chart Pattern forex market mein paya jane wala aik powerful continuation pattern hai. Iska khasosiyat hai ke ismein pehle taiz aur tezi se price rally hoti hai, phir ek consolidation phase hoti hai, jis se flag ki tarah structure banti hai. Yeh pattern apni darusti aur saaf taqreban hone ki wajah se mashoor hai, jis se price movement ki direction ko consolidation period ke baad sahi tariqe se predict kiya ja sakta hai.

    High Tight Flag Chart Pattern ke initial stage mein, aik significant price rally hoti hai, jisay amooman mazbut market sentiment aur ziada buying pressure ke wajah se taraqqi milti hai. Yeh rally pattern ka pole banati hai, jis mein prices tezi se ooncha chadte hain. Yeh pole buying aur selling pressure ke beech ki beech bhavna ka natija hai, jis se strong bullish sentiment market mein zahir hoti hai.

    Rally ke baad, market consolidation phase mein jata hai, jahan prices pull back karte hain aur aik tight price channel ke andar range karte hain. Yeh consolidation pattern ka flag hissa banati hai, jise kam trading volumes aur kam volatility ki pehchan hoti hai. Flag aik price equilibrium period hai, jahan market lambi saans lete hue apni upward trend jari rakhti hai.


    IDENTIFYING THE HIGH TIGHT FLAG CHART PATTERN :


    High Tight Flag Chart Pattern ki pehchan ke liye, traders price chart mein kuch khasosiyat dekhte hain. Pehle toh, aik significant upward rally honi chahiye, jisay consolidation period follow karta hai. Yeh rally pattern ka pole banati hai. Consolidation phase tight aur well-defined price channel ki tarah hona chahiye, jisay pattern ka flag banata hai.

    Pattern ko confirm karne ke liye, traders kuch technical indicators ka istemal kar sakte hain. Misal ke tor par, Relative Strength Index (RSI) price rally mein overbought conditions aur consolidation phase mein oversold conditions ko identify karne ke liye istemal kiya ja sakta hai. Iske alawa, volume analysis bhi helpful ho sakti hai, jabki consolidation phase mein trading volumes kam hojate hain.


    TRADING THE HIGH TIGHT FLAG CHART PATTERN :


    Traders High Tight Flag Chart Pattern ka istemal apni faiday ke liye kar sakte hain, pattern ke khasosiyat par based trading strategies banakar. Aik common approach yeh hoti hai ke breakout ki wait ki jaati hai consolidation phase se, aur phir continuation ki direction mein trade enter ki jati hai. Traders iss mein high of the flag ke upar buy order lagate hain ya low of the flag ke neechay sell order lagate hain, stop loss swing low ke neechay ya swing high ke upar lagaya jata hai.

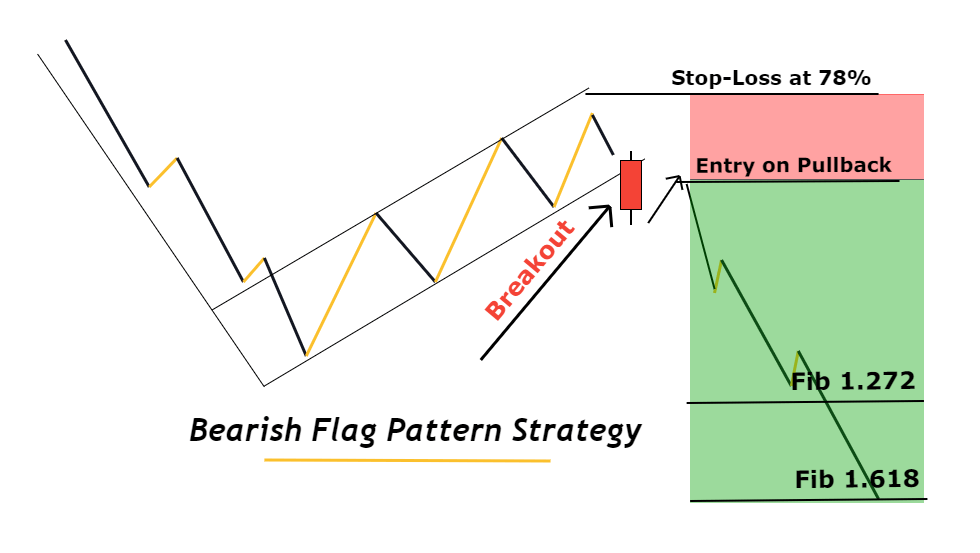
    Dusra trading strategy yeh hoti hai ke flag ke andar pullback ki wait ki jati hai aur phir trend ki direction mein trade enter kiya jata hai. Traders Fibonacci retracement levels ya moving averages ka istemal kar sakte hain, support ya resistance levels identify karne ke liye trade enter karne ke liye.


    POTENTIAL PITFALLS AND CHALLENGES :


    High Tight Flag Chart Pattern bahut effective ho sakti hai, lekin traders ko iss pattern ke saath judi mumkinati pareshaniyon aur challenges ke bare mein bhi pata hona chahiye. False breakouts aur whipsaws amooman hoti hain, khas kar bazaar ki volatility ke samay mein. Traders ko strict risk management techniques ko implement karna chahiye, jaise ki sahi stop losses aur position sizing ka istemal, taaki nuksan ki sambhavna ko kam kiya ja sake.

    Iske saath hi bazaar ki hali aur dusre factors ko bhi ghor se dekhna zaroori hai, jinhone pattern ki kefiyat ko asar andaz karna hai. Khabar mulakaat, maali deta jaari hone aur siyasi masail bhi bazaar ki rawayat par asar andaaz kar saktay hain aur pattern ko batil kar saktay hain.


    EXAMPLES OF THE HIGH TIGHT FLAG CHART PATTERN :


    High Tight Flag Chart Pattern ko aur behtar samajhne ke liye, ek kalpanik udaaharan par chalte hain. Soch lijiye ek currency pair mein taiz tareen bhaari upswings hoti hai, jis mein keval chand dinon mein 200 pips upar jata hai. Iske baad bazaar consolidation phase mein dakhil hota hai aur ek 50 pips ki range mein flag banata hai. Kuch dino ki consolidation ke baad keemat flag se bahar nikal jati hai aur upar ki taraf jaari rehti hai, jis se 150 pips ka upswing hasil hota hai.

    Ikhtetam mein, High Tight Flag Chart Pattern forex market mein taqatwar continuation pattern hai. Traders iss pattern ka istemal kar ke market mein maujood prevailing trend ki taraf trades ke liye mumkin maqaamat pehchan saktay hain. Pattern ke khasosiyat aur potenial masail ko samajh kar, traders apni trading strategies ko behtar banakar aur kamiyabi ke chances ko barha saktay hain.
  • <a href="https://www.instaforex.org/ru/?x=ruforum">InstaForex</a>
  • #2 Collapse

    High Tight Flag chart pattern ek rare aur powerful bullish continuation pattern hai jo technical analysis mein use hota hai. Yeh pattern ek strong uptrend ke baad form hota hai aur price ke further bullish move ko indicate karta hai. High Tight Flag pattern ko samajhna traders ke liye important hai kyunki yeh pattern high probability trading opportunities provide kar sakta hai.


    High Tight Flag Chart Pattern Ka Structure


    High Tight Flag pattern ka structure do major components par based hota hai:
    1. Flagpole: Yeh pattern ka pehla part hota hai jo ek strong and sharp price move ko represent karta hai. Flagpole ek steep uptrend hota hai jahan price rapidly upar move karti hai. Yeh price move typically 50% se zyada hota hai aur short period of time mein achieve hota hai.
    2. Flag: Flag pattern ka second part hota hai jo flagpole ke baad form hota hai. Flag ek consolidation phase hota hai jahan price ek tight range mein trade karti hai. Yeh phase market ke temporary pause aur minor profit-taking ko indicate karta hai. Flag typically horizontally ya slightly downward sloping hoti hai.
    Formation of High Tight Flag Pattern


    High Tight Flag pattern ka formation do major phases mein hota hai:
    1. Flagpole Formation: Pattern ka formation ek strong bullish move ke sath start hota hai jahan price steeply upar move karti hai. Yeh move typically high volume ke sath hota hai jo market ke strong bullish sentiment aur buying pressure ko indicate karta hai. Flagpole ke formation ke dauran price sharp aur rapid increase dikhaati hai.
    2. Flag Formation: Flagpole ke baad price consolidation phase mein enter karti hai jahan price ek tight range mein trade karti hai. Yeh consolidation phase typically 1-3 weeks ka hota hai aur price minor pullbacks aur sideways movement dikhati hai. Flag ke formation ke dauran volume typically decrease hota hai jo market ke temporary pause aur profit-taking ko indicate karta hai.
    Trading Strategies


    High Tight Flag pattern ko interpret karne aur trading strategies banane ke liye kuch important points aur approaches hain:

    1. Confirmation of Pattern


    Pattern ka confirmation flagpole ke baad flag ke formation ke through hota hai. Jab price flag ke range se breakout karti hai aur uske upar close hoti hai, to yeh bullish continuation ka strong signal hota hai. Traders ko confirmation ka wait karna chahiye taake false signals se bacha ja sake.

    2. Entry Point


    Entry point flag ke breakout ke baad hota hai. Jab price flag ke range se breakout karti hai aur uske upar close hoti hai, to yeh buy signal hota hai. Entry point ko confirmation ke sath align karna zaroori hota hai taake successful trade execute ho sake.

    3. Stop-Loss Placement


    Stop-loss placement risk management ke liye bohot zaroori hota hai. Stop-loss ko flag ke lower boundary ke thoda neeche place karna chahiye taake unexpected price movements se bach sakein. Yeh risk ko minimize karta hai aur capital protection ensure karta hai.

    4. Take-Profit Levels


    Take-profit levels ko flagpole ke height ke equal distance par set karna chahiye. Yeh profit targets set karne mein madadgar hota hai aur optimal returns achieve karne mein help karta hai. Flagpole ke height ko flag ke breakout point se measure kiya jata hai aur same distance ko target price ke tor par use kiya jata hai.

    5. Combining with Other Indicators


    High Tight Flag pattern ko dusre technical indicators ke sath combine karke zyada accurate trading decisions liye ja sakte hain.
    • Moving Averages: Moving averages ko use karke trend direction aur strength ko confirm kiya ja sakta hai. Jab pattern aur moving averages dono bullish signals dete hain, to yeh strong confirmation hota hai.
    • Volume Analysis: Volume analysis pattern ke formation aur breakout ko confirm karne mein madadgar hoti hai. High volume ke sath pattern ka breakout zyada reliable hota hai aur strong bullish continuation ka indication deta hai.
    • Relative Strength Index: RSI ko use karke overbought aur oversold conditions identify ki ja sakti hain jo pattern ke signals ko confirm kar sakti hain.

    Advantages of High Tight Flag Pattern


    High Tight Flag pattern ke kai advantages hain jo trading decisions ko enhance karte hain:
    1. Clear Continuation Signal: Yeh pattern clear bullish continuation signal provide karta hai jo trading decisions ko simplify karta hai.
    2. Effective in Different Markets: Yeh pattern different financial markets jaise ke stocks, forex, commodities aur indices mein effective hota hai.
    3. Reliable Signals: High volume ke sath pattern ke formation aur breakout signals zyada reliable hote hain jo profitable trading opportunities create karte hain.
    4. Easy to Identify: Is pattern ko identify karna relatively easy hota hai aur beginners bhi isse efficiently use kar sakte hain.


    Limitations


    High Tight Flag pattern ke kuch limitations bhi hain jo traders ko samajhne chahiye:
    1. Requires Confirmation: Yeh pattern hamesha reliable signals nahi deta aur additional confirmation ki zaroorat hoti hai taake false signals se bacha ja sake.
    2. Market Context Dependent: Pattern ka effectiveness market context aur trend ke hisaab se vary karta hai.
    3. False Breakouts: Kabi-kabhi pattern mein false breakouts ho sakte hain jo misleading signals dete hain.


    High Tight Flag pattern ek valuable technical analysis tool hai jo market mein bullish continuation ka signal deta hai. Iska use trading strategies mein trend continuation ko identify karne aur profitable trading opportunities create karne ke liye hota hai. Pattern ka structure, formation aur trading strategies ko samajhkar traders better trading decisions le sakte hain. Trading aur investing ek continuous learning process hain aur traders ko market conditions aur trends ke sath adjust karte rehna chahiye taake long-term success achieve kiya ja sake.
    • #3 Collapse


      What is High Tight Flag Chart Pattern :


      The High Tight Flag chart pattern is a rare but powerful technical analysis pattern found in stock price movements. It is often considered a strong bullish continuation pattern. Here are the key characteristics of the High Tight Flag pattern:
      1. Preceding Uptrend: The pattern starts with a steep and rapid price increase, typically by 100% to 120% over a short period, such as four to eight weeks.
      2. Flagpole: The initial sharp price rise creates the "flagpole." This rise is usually accompanied by high trading volume, indicating strong buying interest.
      3. Consolidation Period: Following the steep rise, the price enters a consolidation phase, forming a small rectangular shape known as the "flag." During this period, the price moves sideways or slightly downward, usually for one to three weeks. The trading volume during the consolidation phase often decreases, reflecting a temporary pause in the buying pressure.
      4. Breakout: The pattern is confirmed when the price breaks out above the upper boundary of the flag with increased volume. This breakout signals the resumption of the previous uptrend and suggests a potential continuation of the price rally.
      5. Continuation: After the breakout, the stock price is expected to continue rising, often with substantial gains.

      Traders and investors look for this pattern as it indicates strong bullish momentum and potential for significant price appreciation. However, due to its rarity and the specific conditions required for its formation, it's essential to confirm the pattern with additional technical indicators and analysis before making trading decisions.

      Sure, let's delve into the High Tight Flag chart pattern in more detail.
      Overview


      The High Tight Flag (HTF) is a bullish continuation pattern that signals the potential for a significant upward price movement. It is one of the most powerful chart patterns but also one of the rarest.
      Components of the High Tight Flag Pattern
      1. Preceding Uptrend
        • Price Increase: The pattern begins with a dramatic price increase, typically between 100% to 120% or more, within a relatively short period (often four to eight weeks).
        • Volume Increase: This sharp price rise is accompanied by a significant increase in trading volume, indicating strong buying interest and momentum.
      2. Flagpole
        • Steep Ascent: The initial sharp rise in price forms what is referred to as the "flagpole." This part of the pattern represents a vertical or nearly vertical price movement.
        • Strong Momentum: The length and steepness of the flagpole highlight strong bullish momentum and aggressive buying.
      3. Consolidation Phase (Flag)
        • Sideways or Slight Downward Movement: After the rapid rise, the price enters a consolidation phase where it moves sideways or slightly downward, forming a rectangular pattern that resembles a flag.
        • Duration: This consolidation typically lasts from one to three weeks.
        • Decreasing Volume: During the flag formation, trading volume usually decreases, indicating a temporary pause in the buying pressure as traders take profits or the market digests the previous gains.
      4. Breakout
        • Resumption of Uptrend: The pattern is confirmed when the price breaks out above the upper boundary of the flag with increased volume.
        • Volume Surge: The breakout should be accompanied by a surge in trading volume, signifying renewed buying interest and the resumption of the upward trend.
        • Price Target: A common price target for the breakout is derived by adding the height of the flagpole to the breakout point. For example, if the flagpole is $50 in height and the breakout occurs at $100, the target price would be $150.
      Example of the High Tight Flag Pattern


      Let's consider a hypothetical example:
      • Preceding Uptrend: A stock rises from $50 to $110 in six weeks (120% increase).
      • Flagpole: The steep rise from $50 to $110 forms the flagpole.
      • Consolidation Phase: The stock price then consolidates between $105 and $115 for two weeks, forming the flag.
      • Breakout: The price breaks out above $115 with a significant increase in volume.
      • Price Target: The height of the flagpole is $60 ($110 - $50). Adding this to the breakout point ($115) gives a target price of $175.
      Trading the High Tight Flag Pattern
      1. Identification: Spot the pattern during the formation of the flag. Ensure the preceding uptrend is sharp and significant, typically 100% to 120% or more.
      2. Confirmation: Wait for the breakout above the upper boundary of the flag with increased volume.
      3. Entry Point: Enter a long position when the breakout occurs.
      4. Stop-Loss: Place a stop-loss order slightly below the lower boundary of the flag to manage risk.
      5. Price Target: Set a price target by adding the height of the flagpole to the breakout point.
      Tips for Trading the High Tight Flag Pattern
      • Volume Confirmation: Ensure the breakout is accompanied by a significant increase in volume, confirming the strength of the breakout.
      • Market Conditions: Consider the broader market conditions and the stock’s fundamentals to validate the pattern.
      • Risk Management: Use stop-loss orders and position sizing to manage risk effectively.
      • Patience: Be patient and wait for the pattern to fully develop and confirm before entering a trade.
      Conclusion


      The High Tight Flag pattern is a powerful continuation pattern that can signal substantial gains. However, due to its rarity and specific formation criteria, traders should use additional technical analysis and risk management strategies to confirm and trade the pattern effectively.


      • <a href="https://www.instaforex.org/ru/?x=ruforum">InstaForex</a>
      • #4 Collapse

        What is High Tight Flag Chart Pattern :


        Click image for larger version

Name:	download (11).png
Views:	6
Size:	5.6 کلوبائٹ
ID:	13025738


        High Tight Flag chart pattern ek bullish continuation pattern hai jo trading aur technical analysis mein kaafi significant mana jata hai. Yeh pattern typically tab banta hai jab ek stock ya financial instrument ek strong aur rapid price increase show karta hai, aur phir temporarily consolidate hota hai. Is pattern ka naam "High Tight Flag" is liye rakha gaya hai kyunki yeh ek lambe pole (high) aur ek choti consolidation (tight flag) ki tarah dikhai deta hai. Aayiye is pattern ko detail mein samajhte hain:
        1. Introduction aur Importance


        High Tight Flag pattern traders aur investors ke liye kaafi important hota hai kyunki yeh ek strong bullish signal provide karta hai. Yeh pattern indicate karta hai ke price further upar jaane ki potential rakhta hai. Is pattern ka formation market sentiment aur momentum ko reflect karta hai, aur jab yeh breakout hota hai toh yeh indicate karta hai ke buyers kaafi aggressive hain aur price ko aur bhi upar le ja sakte hain.
        2. Structure aur Formation


        High Tight Flag pattern do major components mein divide hota hai:
        A. Pole:


        Pole woh portion hai jisme price ek steep aur rapid ascent show karta hai. Yeh price increase usually 50% ya usse zyada hota hai aur kaafi short period of time mein achieve hota hai, jaise kuch din ya weeks mein. Is sharp rise ke piche strong buying pressure hota hai jo ki news, earnings report ya kisi aur fundamental factor ke wajah se ho sakta hai.
        B. Flag:


        Flag woh portion hai jisme price consolidation show karta hai. Yeh consolidation horizontal ya slightly downward sloping hota hai. Flag formation ke duran price tight range mein trade karta hai, indicating ke market participants temporary pause le rahe hain. Yeh pause zaruri hota hai taake price apne next upward move ke liye prepare ho sake.
        3. Breakout:


        Breakout tab hota hai jab price flag ke upper boundary ko breach karta hai aur upar ki taraf move karta hai. Yeh breakout strong volume ke sath hona chahiye taake yeh validate ho sake. Breakout indicate karta hai ke consolidation period khatam ho gaya hai aur bullish trend continue hoga. Is point pe traders usually buying positions lete hain taake next upward move ko capitalize kar sake.
        4. Technical Analysis aur Trading Strategy


        High Tight Flag pattern identify karne ke liye kuch specific technical analysis tools aur indicators ka use kiya ja sakta hai:
        • Volume Analysis: Breakout ke duran volume ka significant increase hona chahiye, jo breakout ko validate karega.
        • Trendlines: Flag ke boundaries draw karne ke liye trendlines ka use kiya ja sakta hai. Upper trendline breakout point ko identify karne mein madad karti hai.
        • Moving Averages: Moving averages ko support aur resistance levels identify karne ke liye use kiya ja sakta hai.

        Traders usually following steps follow karte hain:
        1. Pattern Identification: Pehle pole aur flag ko identify karna.
        2. Volume Confirmation: Breakout ke duran volume increase ko monitor karna.
        3. Entry Point: Breakout point pe buying position lena.
        4. Stop Loss: Flag ke lower boundary ke niche stop loss set karna.
        5. Target Price: Pole ki length ke barabar ek initial target price set karna.
        5. Real-World Examples


        Stock market mein kai real-world examples hain jaha High Tight Flag pattern ka formation dekhne ko milta hai. Kuch well-known companies jaise Apple, Tesla, aur Amazon ne past mein is pattern ka exhibit kiya hai. For example, Tesla ne 2020 mein ek significant High Tight Flag pattern show kiya tha jo uske subsequent rapid price increase ka precursor tha.
        Conclusion


        High Tight Flag chart pattern ek powerful tool hai traders aur investors ke liye jo bullish continuation trends ko identify aur capitalize karna chahte hain. Is pattern ka proper understanding aur identification se significant profits generate kiye ja sakte hain. Lekin, jaise har technical analysis tool ke sath hota hai, is pattern ka bhi independently validate karna zaruri hai aur risk management strategies ka use karna chahiye taake losses ko minimize kiya ja sake.


        4o

        اب آن لائن

        Working...
        X