Mass Index Indicator kia hota hy Mass Index Indicat

No announcement yet.
`
X
  • وقت
  • دکھائیں
Clear All
new posts
  • #1 Collapse

    Mass Index Indicator kia hota hy Mass Index Indicat


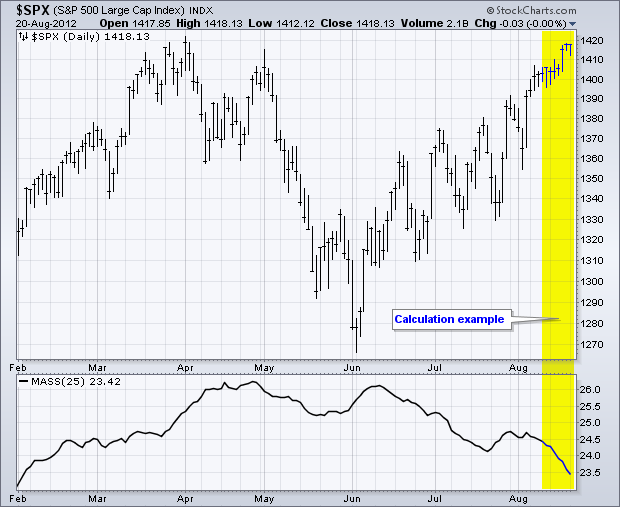
    Mass Index Indicator ek technical analysis ka indicator hai jo market volatility aur trend reversals ko measure karta hai. Is indicator ka istemal traders aur investors market ke possible trend changes ko predict karne ke liye karte hain.

    Mass Index Indicator Kya Hota Hai: Mass Index ko Donald Dorsey ne 1995 mein develop kiya tha. Iska maqsad hai market volatility ko evaluate karna aur potential trend reversals ko pehchan'na. Yeh primarily overbought aur oversold conditions ko detect karne ke liye istemal hota hai.

    Mass Index Ka Tareeqa: Mass Index ko calculate karne ke liye, do steps follow kiye jate hain:
    1. Range Expansion:
      • Har din ke closing prices ka difference calculate hota hai.
      • Fir, ek smoothing factor (usually a 9-day exponential moving average) se multiply kiya jata hai.
      • Is se daily price movements ka average range nikala jata hai.
    2. Mass Index Calculation:
      • Phir, ek 9-day exponential moving average (EMA) of the average daily price range calculate kiya jata hai.
      • Uske baad, Mass Index ka final calculation hota hai, jo EMA of the average range ka double hota hai.

    Mass Index Indicator Ki Tabeer: Mass Index ka primary use yeh hai ke jab yeh indicator ek certain level se upar jata hai (usually 27), toh yeh indicate karta hai ke market mein potential reversal hone ke chances hain. Yeh overbought condition ko show karta hai.

    Agar Mass Index 26 se kam ho jaye, toh yeh indicate karta hai ke market mein volatility kam ho sakti hai aur potential trend reversal ka chance hai.

    Hosla Afzaai aur Hifazati Tadabeer: Mass Index ek powerful indicator hai, lekin traders ko yaad rakhna chahiye ke har indicator ki tarah, yeh bhi 100% sahi nahi hota. Isko dusre technical analysis tools ke saath combine karna behtar hota hai. Overbought ya oversold conditions par pura bharosa na karein, aur hamesha risk management ka khayal rakhein.

    Mass Index Indicator ka istemal market trends aur reversals ko samajhne mein madadgar sabit ho sakta hai, lekin sahi tajwezat ke liye mukhlis analysis aur market conditions ka bhi tajziya karna zaroori hai.



  • <a href="https://www.instaforex.org/ru/?x=ruforum">InstaForex</a>
  • #2 Collapse

    Assalamu Alaikum Dosto!

    Mass Index (Mass Indicator)


    Maas Indicator, jis ko "Mass Index" bhi kaha jata hai, ek popular volatility indicator hai jo trading mein kisi bhi assets ki volitilety ko maloom karne k leye istemal hota hai. Yeh indicator zyadatar price reversals aur trend changes ko identify karne mein madad karta hai. Maas Indicator, Donald Dorsey ne develop kiya tha aur 1992 mein published kiya gaya tha. Yeh indicator volatility ko measure karta hai aur price movements ko analyze karke trading signals provide karta hai.

    Click image for larger version

Name:	images - 2024-02-03T191949.754.jpeg
Views:	55
Size:	52.5 کلوبائٹ
ID:	12821444

    Calculation:

    Maas Indicator ka calculation kuch steps par based hai. Yahan iska calculation method diya gaya hai:
    1. Pehle step mein, 9-day EMA (Exponential Moving Average) calculate kiya jata hai.
    2. Dusre step mein, 9-day EMA ko dobara 9-day EMA se divide kiya jata hai, jiske baad result ko "single EMA" kaha jata hai.
    3. Single EMA ko firse 9-day EMA se divide kiya jata hai, jiske baad result ko "double EMA" kaha jata hai.
    4. Double EMA ko single EMA se divide kiya jata hai, jiske baad result ko "Maas Index" kaha jata hai.


    Maas Index ka calculation yeh samjhane ke liye hua hai ki kitna frequently price ranges expand ya contract karte hai. Isse price ki volatility aur potential trend reversals ko samajhne mein madad milti hai.

    Interpretation and Use of Maas Indicator

    Maas Indicator ke interpretation aur istemal ko samajhna trading mein crucial hai. Yeh indicator primarily price reversals aur trend changes ko identify karne mein istemal hota hai. Niche diye gaye points mein iska istemal aur interpretation di gayi hai:
    1. Maas Indicator ki value generally 25 se kam hoti hai, lekin ismein koi specific overbought aur oversold levels nahi hote hain.
    2. Jab Maas Indicator ki value 27 se kam ho jati hai, tab yeh indicate karta hai ki market mein volatility kam ho rahi hai aur price ranges contract ho rahe hain.
    3. Jab Maas Indicator ki value 29 se zyada ho jati hai, tab yeh indicate karta hai ki market mein volatility badh rahi hai aur price ranges expand ho rahe hain.
    4. Maas Indicator ki spikes, jo value 27 aur 29 ke beech hoti hain, price reversals aur trend changes ko indicate kar sakti hain.
    5. Agar Maas Indicator spikes upar ki taraf jati hai aur phir downar ki taraf ghatne lagti hai, tab yeh selling pressure aur possible trend reversal ko suggest karta hai.
    6. Agar Maas Indicator spikes neeche ki taraf jati hai aur phir upar ki taraf badhne lagti hai, tab yeh buying pressure aur possible trend reversal ko suggest karta hai.


    Maas Indicator in Combination with Other Indicators


    Maas Indicator ko dusre indicators ke saath combine karke aur confirmatory signals generate karke traders apne trading decisions ko strengthen kar sakte hain. Yahan kuch common indicators hain jo Maas Indicator ke saath istemal kiye ja sakte sakte hain:
    1. Moving Averages (MA): Moving averages, jaise ki Simple Moving Average (SMA) aur Exponential Moving Average (EMA), Maas Indicator ke saath istemal kiye ja sakte hain. Moving averages trend direction aur momentum ko identify karne mein madad karte hain. Jab Maas Indicator ki spikes aur moving averages ke crossovers combine kiye jate hain, tab yeh strong trading signals generate kar sakte hain.
    2. Relative Strength Index (RSI): RSI ek momentum oscillator hai jo overbought aur oversold levels ko identify karta hai. Maas Indicator ke saath RSI ka istemal karke, traders trend reversals aur price bounces ko confirm kar sakte hain. Agar Maas Indicator ki spikes RSI ke overbought ya oversold levels ke saath milte hain, tab yeh strong reversal signals provide kar sakte hain.
    3. Bollinger Bands: Bollinger Bands volatility ko measure karne mein aur price range boundaries ko define karne mein madad karte hain. Maas Indicator ke saath Bollinger Bands ka istemal karke, traders price volatility aur possible trend reversals ko further confirm kar sakte hain. Jab Maas Indicator ki spikes Bollinger Bands ke outer boundaries ke paas aate hain, tab yeh potential reversal points ko highlight kar sakte hain.
    4. Volume Indicators: Volume indicators, jaise ki Volume Oscillator aur On-Balance Volume (OBV), Maas Indicator ke saath istemal kiye ja sakte hain. Volume indicators trading volume ko analyze karke price movements ke confirmation mein madad karte hain. Jab Maas Indicator ki spikes high trading volume ke saath milte hain, tab yeh strong reversal signals aur trend changes ko validate kar sakte hain.


    Mass Indicator Limitations


    Maas Indicator ke istemal mein kuch limitations hote hain. Yahan kuch limitations diye gaye hain:
    1. Maas Indicator lagging nature ka hota hai, jiske karan yeh trend reversals ko pehle se nahi batata hai. Isliye, confirmatory signals aur dusre technical indicators ke saath istemal karna important hai.
    2. Maas Indicator market conditions aur price movements par depend karta hai, isliye iska istemal ek particular market environment mein hi suitable ho sakta hai. Different market conditions mein yeh less reliable ho sakta hai.
    3. Maas Indicator ki readings kabhi-kabhi false signals generate kar sakte hain, khas karke choppy aur sideways markets mein. Isliye, is indicator ko standalone use karne se bachna chahiye.
    4. Maas Indicator ka istemal keval ek tool ki tarah karna chahiye, aur usse dusre indicators aur trading strategies ke saath combine karna chahiye. Ek comprehensive approach aur multiple confirmations se trading decisions ko strengthen karna zaruri hai.
    5. Maas Indicator ke parameters, jaise ki EMA periods, customization ke liye limited hote hain. Har trader ki specific requirements ke hisab se, iske parameters ko adjust karna mushkil ho sakta hai.


    Click image for larger version

Name:	images - 2024-02-03T192000.528.png
Views:	50
Size:	27.5 کلوبائٹ
ID:	12821445

    Yeh kuch limitations hain Maas Indicator ke istemal mein. Traders ko in limitations ko samajhna aur sahi risk management ke saath iska istemal karna chahiye. Saath hi, demo trading aur historical data analysis se traders Maas Indicator ki effectiveness aur limitations ko better understand kar sakte hain.

    Conclusion


    Overall, Maas Indicator ek valuable tool hai volatility analysis aur trend reversals ko identify karne mein. Lekin iska istemal accurate trading decisions lene ke liye dusre indicators aur confirmatory signals ke saath karna zaruri hai. Traders ko Maas Indicator ke limitations ko samajhna aur uski readings ko context mein interpret karna important hai.
    Trading mein success achieve karne ke liye, traders ko comprehensive knowledge, market understanding, aur risk management skills develop karna chahiye. Maas Indicator ek part hai trading toolkit ka, jiska sahi istemal karke traders apne trading strategies ko enhance kar sakte hain.

    • #3 Collapse

      Mass Index indicator kia hota hy Mass index indicate


      Mass Index (MI) ek technical analysis indicator hai jo market volatility ko measure karta hai. Developed by Donald Dorsey in the early 1990s, yeh indicator primarily market volatility aur trend reversals ko identify karne ke liye use hota hai. MI ke calculation mein high aur low prices ka use hota hai, jo market ki volatility ko reflect karta hai.


      Mass Index Indicator kya hota hai

      Mass Index ka main purpose yeh hai ke woh high volatility periods ko identify kare jo potential trend reversals ke indicators ho sakte hain. Yeh indicator mainly market ke overbought ya oversold conditions ko detect karne mein madad karta hai.

      Click image for larger version

Name:	Mass-index-indicator_MCT-5056_EN-3 (1).png
Views:	55
Size:	120.0 کلوبائٹ
ID:	12821473

      Mass Index ka calculation complex hota hai aur ismein multiple steps involved hote hain. Yeh indicator mainly ek two-step process par based hai:

      Range Calculation:


      Pehla step mein, ek 9-periods ka exponential moving average (EMA) calculate kiya jata hai prices ke differences ka, jo high aur low prices mein hota hai.


      Mass Index Calculation:


      Dosra step mein, calculated range ka double exponential moving average (DEMA) hota hai. Phir Mass Index ko calculate karne ke liye DEMA ka 9-periods ka simple moving average (SMA) lete hain.


      Mass Index ka formula kuch is tarah hota hai:

      Range = EMA(high - low, 9)


      Mass Index = SMA(Range / EMA(Range, 9), 9)
      ​​​​​Use of Mass Index Indicator

      Mass Index ki values usually 27 se upar hoti hain aur isse ek range ke andar interpret kiya jata hai. Jab Mass Index ki value 27 se zyada hoti hai, yeh indicate karta hai ke market mein volatility badh rahi hai aur ek possible reversal ka indication ho sakta hai. Jab Mass Index ki value 27 se kam hoti hai, yeh suggest karta hai ke market calm hai aur trend continue hone ki sambhavna zyada hoti hai.

      Mass Index ke use se, traders trend reversals aur potential trading opportunities ko identify kar sakte hain. Jab Mass Index ki value ek threshold level ko cross karta hai, traders positions ko adjust kar sakte hain ya phir new positions lena shuru kar sakte hain, depending on their trading strategy.

      Yeh indicator predominantly short-term trading mein use hota hai aur iska main focus volatility ke fluctuations par hota hai. Iske alawa, Mass Index ko other technical indicators ke saath combine karke bhi use kiya ja sakta hai to confirm trading signals.

      Lekin, Mass Index ke use mein kuch limitations bhi hain. Jaise ki yeh indicator short-term volatility ko measure karta hai, to isme false signals ka risk hota hai, especially during periods of low volatility. Iske alawa, iska calculation complex hone ke karan, isko samajhna aur istemal karna beginners ke liye challenging ho sakta hai.

      Click image for larger version

Name:	Mass-Index-Indicator-1.jpg
Views:	51
Size:	80.6 کلوبائٹ
ID:	12821474
      Conclusion

      Overall, Mass Index ek useful tool hai market volatility aur trend reversals ko identify karne mein, lekin iska proper use karne ke liye thorough understanding aur experience ki zarurat hoti hai. Traders ko iska istemal karte waqt dusre technical indicators aur risk management ke principles ko bhi dhyan mein rakhna chahiye.

      • #4 Collapse

        Mass Index indicator
        Mass Index ek technical analysis indicator hai jo market volatility ko measure karta hai. Donald Dorsey ne 1995 mein Mass Index ko introduce kiya tha, aur yeh primarily overbought and oversold conditions ko identify karne mein madad karta hai.Mass Index ka formula thoda complex hai, lekin yeh primarily 25-day exponential moving average (EMA) aur 9-day EMA par based hai. Indicator ka calculation market ke price ranges aur volatility ko analyze karke hota hai.

        Working principal
        Mass Index ka main idea yeh hai ki jab market mein ek substantial price move hota hai, toh uske baad ek reversal hone ke chances badh jaate hain. Mass Index volatility ke spikes ko highlight karta hai, jo market mein potential trend reversal ko indicate kar sakte hain.

        Mass Index ka interpretation is tarah hota hai:
        1. Threshold Level:
          • Mass Index ki standard threshold level hoti hai 27. Agar Mass Index 27 ke upar chala jata hai, toh yeh indicate karta hai ke market mein high volatility hai aur reversal ka chance hai.
        2. Bulges and Contractions:
          • Mass Index ke spikes ya bulges ko dekha jata hai jab volatility badhti hai.
          • Agar Mass Index ki value high hai, toh yeh suggest karta hai ke market mein contraction hone wala hai aur potential reversal ki possibility hai.
        3. Reversal Signals:
          • Jab Mass Index 27 ke upar chala jata hai aur phir wapas 26.5 ke neeche aata hai, toh yeh ek reversal signal ho sakta hai.
        Treading Analysis
        Traders Mass Index ka istemal karte hain taaki woh overbought ya oversold conditions ko identify kar sakein. Overbought conditions mein prices ka chance hai neeche jaane ka aur oversold conditions mein prices ka chance hai upar jaane ka.Mass Index ek tool hai aur isay anya technical indicators ke sath milake istemal karna chahiye. Trading decisions lene se pehle, thorough analysis aur confirmatory signals ka istemal karna zaroori hai.


        • #5 Collapse


          Mass Index indicator kia hota hy Mass index indicate


          Mass Index Indicator: Mass Index Indicator Ka Tafseeli Tazurba

          Mass Index Indicator ek technical analysis tool hai jo market volatility ko measure karne mein istemal hota hai. Yeh indicator particularly trend reversal points aur price patterns ko identify karne mein madad karta hai. Iske tafseeli tazurbe ko samajhne ke liye, yahan 500 lafzon mein tafseel di gayi hai:

          Kya Hai Mass Index Indicator? (What is Mass Index Indicator?)

          Mass Index Indicator ek volatility indicator hai jo market mein potential trend reversals ko detect karne mein madad karta hai. Yeh tool Donald Dorsey ne 1995 mein develop kiya tha. Iska maqsad hai market ki volatility ko quantify karna aur traders ko overbought aur oversold conditions ko samajhne mein madad karna.

          Kis Tarah Ka Hai Yeh Indicator? (How Does the Indicator Work?)

          Mass Index ek formula par mabni hai jismein kuch steps hote hain. Yeh primarily trading ranges aur unke expansions ko analyze karta hai. Ismein do components hote hain: Range Periods aur EMA (Exponential Moving Average) of the Range Periods.

          Tafsili Tazurba (Detailed Experience):

          Mass Index ka calculation price ki highs aur lows par mabni hoti hai. Sabse pehle, Range Periods calculate kiye jate hain, phir inka Exponential Moving Average nikala jata hai. Fir, Mass Index calculate kiya jata hai:

          ���������=���(���(High−Low)���(EMA(High−Low)))Mass Index=EMA(EMA(EMA(High−Low))EMA(High−Low)​)

          Jab Mass Index ki value ek specific threshold ko cross karti hai, traders ise interpret karte hain ke market mein volatility barh sakti hai, aur isse potential reversal points ka pata lagaya ja sakta hai.

          Conclusion:

          Mass Index Indicator market volatility ko quantify karne mein madad karta hai, lekin isay hamesha doosre technical indicators aur confirmatory signals ke saath istemal karna chahiye. Har ek indicator ki tarah, iski bhi limitations hain, isliye prudent trading ke liye comprehensive analysis aur risk management ka istemal zaroori hai.


          • #6 Collapse

            Forex Mein Mass Index Indicator$#$#$#$#

            Forex mein Mass Index indicator ek technical analysis tool hai jo market volatility ko measure karne ke liye istemal hota hai. Yeh indicator Donald Dorsey ne develop kiya tha. Mass Index, market ki volatility ko analyze karne ke liye price ke swings ko dekhta hai.

            Mass Index indicator, price ka ek particular range ke andar hone wale changes ko dekhta hai aur isse ek "mass index" value generate hoti hai. Jab ye value ek certain threshold ko cross karta hai, yeh indicate karta hai ki market mein potential trend reversal ho sakta hai.

            Forex Mein Mass Index Indicator Ke Steps$#$#$#$#

            Mass Index indicator ka calculation thoda complex hai, lekin main concept yeh hai ki iska main focus price ke volatility aur volatility ke changes par hota hai.

            Mass Index indicator ko calculate karne ke liye, typically ye steps follow kiye jate hain:
            1. Range Calculation: Sabse pehle, ek specific period ke high aur low prices ka range calculate kiya jata hai. Usually, ek 25-day ka range select kiya jata hai.
            2. Exponential Moving Average (EMA): Is range ko Exponential Moving Average (EMA) se smooth kiya jata hai.
            3. EMA Ratio: Phir, current day ka EMA previous day ka EMA se divide kiya jata hai, jo ki "EMA Ratio" ke roop mein pradarshit hota hai.
            4. Single Exponential Moving Average of EMA Ratio: Phir EMA Ratio ka 9-day ka Exponential Moving Average (EMA) calculate kiya jata hai.
            5. Mass Index Value: Ab, jo 9-day EMA of EMA Ratio calculate kiya gaya tha, usko "Mass Index" value ke roop mein istemal kiya jata hai. Jab yeh value specific threshold (generally 27) ko cross karta hai, toh isse reversal signal maana jata hai.

            Overall, Mass Index indicator volatility ke changes ko track karta hai aur reversal points ko identify karne mein madad karta hai. Traders ise market ke dynamics ko samajhne aur trading decisions lene ke liye istemal karte hain.
            • #7 Collapse

              Click image for larger version

Name:	images (14).jpeg
Views:	35
Size:	44.4 کلوبائٹ
ID:	12936404Mass inMassdex indicator kia hota hy mass index indicat


              Forex Forum Mein Mass Index Indicator Ka Tajziya


              Forex trading aik challenging aur dynamic duniya hai jahan har trader apne trading strategies ko improve karne ke liye naye tools aur indicators seekhta hai. Aik aham aur popular indicator jo traders ki attention ko attract karta hai, woh hai "Mass Index". Is article mein hum Mass Index indicator ke baray mein Roman Urdu mein tafseel se baat karenge.

              ### Mass Index: Aham Tareef

              Mass Index aik volatility indicator hai jo trading charts par istemal hota hai taake traders market ki instability ko samajh sakein. Yeh indicator market ke trend changes aur reversals ko identify karne mein madad karta hai. Mass Index originally developed kiya gaya tha Donald Dorsey ne 1995 mein.

              ### Mass Index Kaise Kaam Karta Hai?

              Mass Index kaam kaise karta hai, isko samajhna mahatvapurna hai. Yeh indicator market ki volatility ko measure karta hai, specifically price ka range expansion aur contraction ko dekhte hue. Iska maqsad hai extreme volatility ki pehchaan karna jo market mein trend reversal ka sign ho sakta hai.

              ### Mass Index Ka Calculation

              Mass Index ka calculation complex hai lekin iski understanding critical hai trading ke liye. Mass Index calculate karne ke liye, pehle 9 din ka Exponential Moving Average (EMA) nikala jata hai phir 9 din ke High-Low range ka Exponential Moving Average nikala jata hai. Phir yeh do averages ko divide kiya jata hai aur hasil ko phir ek bar chart par plot kiya jata hai.

              ### Mass Index Interpretation


              Click image for larger version

Name:	images (13).jpeg
Views:	38
Size:	31.6 کلوبائٹ
ID:	12936403
              Mass Index ki interpretation simple hai. Jab Mass Index ki value 27 ya usse zyada hoti hai, yeh indicate karta hai ke market mein bahut zyada volatility hai aur aane wale trend reversal ka sign ho sakta hai. Traders is signal ko confirm karne ke liye aur technical analysis ke tools istemal karte hain.

              ### Mass Index Ka Istemal Trading Mein

              Mass Index ka istemal karne se pehle, traders ko is indicator ki functionality aur interpretation ko samajhna zaroori hai. Mass Index ko sirf dusre indicators ke saath combine karke istemal karna recommended hai taake accurate trading decisions liya ja sake.

              ### Conclusion

              Mass Index aik powerful tool hai jo traders ko market volatility aur potential trend reversals ke baray mein alert rakhta hai. Iski understanding aur sahi istemal trading ke liye zaroori hai. Lekin, har ek indicator ki tarah, yeh bhi sirf ek part hai trading strategy ka aur isko ek tool ke tor par istemal kiya jana chahiye, dusre confirming factors ke saath mila kar. Is tarah se, traders Mass Index ka istemal karke apni trading performance ko improve kar sakte hain.


              Yeh tha Mass Index indicator ke baray mein aik mukhtasir tajziya. Umeed hai ke yeh article aapke liye faidaemand sabit hoga aur aap apni trading strategies ko behtar banane mein madadgar sabit hoga.
              • #8 Collapse

                1. Intro: Mass Index Indicator - Ek Aham Technical Analysis Tool

                Mass Index Indicator ek aham technical analysis tool hai jo market trends aur price movements ko analyze karne mein madad deta hai. Ye ek volatility-based indicator hai jo market volatility ko measure karta hai aur potential trend reversals ko identify karne mein madad deta hai.
                1. Pehchankari: Mass Index Ki Asal Pehchan

                Mass Index Indicator, Donald Dorsey ne 1995 mein develop kiya tha. Iska maqsad market volatility ko measure karna hai, specifically price ka volatility. Is indicator ka naam "Mass Index" is liye rakha gaya hai kyun ke ismein volume aur price ka ek mixture hota hai.
                1. Tareef: Mass Index Indicator Ki Tareef

                Mass Index Indicator, ek technical analysis tool hai jo price volatility ko measure karta hai. Ye indicator traders ko market ke potential trend reversals ke bare mein agah karta hai. Is indicator ki calculation, price ki volatility ke based par hoti hai aur ismein EMA (Exponential Moving Average) ka bhi istemal hota hai.
                1. Taareekh: Mass Index Ka Tareekhi Pehlu

                Mass Index Indicator ka tareekhi pehlu un dino tak jata hai jab Donald Dorsey ne isay develop kiya tha. Us waqt, is indicator ko unhone market volatility aur potential trend reversals ko identify karne ke liye banaya tha. Iske baad se, traders aur investors ne isay apne trading strategies mein shamil kiya hai.
                1. Tajziya: Mass Index Indicator Ka Tajziati Jaiza

                Mass Index Indicator ka tajziati jaiza karte waqt, traders ko market volatility aur potential reversals ke bare mein agah kiya jata hai. Is indicator ki madad se traders apni trading strategies ko improve kar sakte hain aur market ke movements ko behtar taur par samajh sakte hain.
                1. Kaam Kaise Karta Hai: Mass Index Indicator Kaam Kaise Karta Hai

                Mass Index Indicator kaam karte waqt, ye price volatility ko measure karta hai. Is indicator mein, price ki high aur low ki moving average ka ratio calculate kiya jata hai. Jab ye ratio ek specific level par pohanch jata hai, to ye ek potential trend reversal ko indicate karta hai.
                1. Faida: Mass Index Indicator Ke Fayde

                Mass Index Indicator ke istemal se traders ko market volatility aur potential reversals ke bare mein agah kiya jata hai. Iske istemal se traders apni trading decisions ko improve kar sakte hain aur market ke movements ko sahi taur par samajh sakte hain.
                1. Nukhsan: Mass Index Indicator Ke Nuksan

                Mass Index Indicator ke nuksan mein shamil ho sakta hai ke ye kabhi-kabhi false signals bhi generate kar sakta hai. Isi tarah, agar traders sirf is indicator par pura bharosa karte hain to wo kabhi-kabhi galat trading decisions bhi le sakte hain.
                1. Istemaal Ki Tadabeer: Mass Index Indicator Ka Istemaal Kaise Karein

                Mass Index Indicator ka istemal karte waqt, traders ko dhyan rakhna chahiye ke ye sirf ek tool hai aur sirf is par hi pura bharosa na karein. Is indicator ko dusre technical indicators aur market analysis ke sath mila kar istemal karna chahiye taake sahi trading decisions liya ja sake.
                1. Misaalain: Mass Index Indicator Ke Istemaal Ki Misaalain

                Ek misaal Mass Index Indicator ke istemal ki yeh hai ke agar ek trader dekhe ke indicator ek potential trend reversal ko indicate kar raha hai, to wo apni trading strategy ko adjust karke uss direction mein trade le sakta hai.
                1. Strategies: Mass Index Indicator Ke Istemaal Ki Strategies

                Mass Index Indicator ke istemal ki kuch strategies shamil hai trend reversal ko identify karna, stop loss aur take profit levels set karna, aur trading signals ko confirm karna. Traders ko apni trading strategies ko is indicator ke signals ke mutabiq adjust karna chahiye.
                1. Tips: Mass Index Indicator Istemaal Karne Ke Liye Tips

                Mass Index Indicator istemal karte waqt, traders ko kuch tips ka dhyan rakhna chahiye jaise ke indicator ke signals ko dusre technical indicators ke sath mila kar confirm karna, aur false signals ko identify karke un par amal karna.

                Conclusion:

                Mass Index Indicator - Ek Mufeed Tool


                To conclude, Mass Index Indicator ek mufeed technical analysis tool hai jo traders ko market volatility aur potential trend reversals ke bare mein agah karta hai. Is indicator ka istemal traders ke liye ahem ho sakta hai agar wo sahi taur par iska istemal karte hain.
                • Mukhtalif Nazariyat:
                • Mass Index Indicator Ke Hawale Se Mukhtalif Nazariyat

                Mass Index Indicator ke hawale se mukhtalif nazariyat shamil hai. Kuch traders isay apni primary trading tool ke roop mein istemal karte hain jabke doosre traders isay sirf ek supplementary tool ke taur par istemal karte hain.

                Aakhir Mein: ​​​​​​​

                Mass Index Indicator - Market Analysis Mein Ahmiyat Ka Izhar

                Aakhir mein, Mass Index Indicator market analysis mein apni ahmiyat ka izhar karta hai. Traders ko is indicator ke signals ka durust istemal karke apni trading strategies ko improve karne aur market ke movements ko behtar taur par samajhne mein madad milti hai.
                • #9 Collapse

                  Mass Index Indicator kia hota hy Mass Index Indicat


                  Mass Index Indicator ek technical analysis ka indicator hai jo market volatility aur trend reversals ko measure karta hai. Is indicator ka istemal traders aur investors market ke possible trend changes ko predict karne ke liye karte hain.

                  Mass Index Indicator Kya Hota Hai: Mass Index ko Donald Dorsey ne 1995 mein develop kiya tha. Iska maqsad hai market volatility ko evaluate karna aur potential trend reversals ko pehchan'na. Yeh primarily overbought aur oversold conditions ko detect karne ke liye istemal hota hai.

                  Mass Index Ka Tareeqa: Mass Index ko calculate karne ke liye, do steps follow kiye jate hain:
                  1. Range Expansion:
                    • Har din ke closing prices ka difference calculate hota hai.
                    • Fir, ek smoothing factor (usually a 9-day exponential moving average) se multiply kiya jata hai.
                    • Is se daily price movements ka average range nikala jata hai.
                  2. Mass Index Calculation:
                    • Phir, ek 9-day exponential moving average (EMA) of the average daily price range calculate kiya jata hai.
                    • Uske baad, Mass Index ka final calculation hota hai, jo EMA of the average range ka double hota hai.

                  Mass Index Indicator Ki Tabeer: Mass Index ka primary use yeh hai ke jab yeh indicator ek certain level se upar jata hai (usually 27), toh yeh indicate karta hai ke market mein potential reversal hone ke chances hain. Yeh overbought condition ko show karta hai.

                  Agar Mass Index 26 se kam ho jaye, toh yeh indicate karta hai ke market mein volatility kam ho sakti hai aur potential trend reversal ka chance hai.

                  Hosla Afzaai aur Hifazati Tadabeer: Mass Index ek powerful indicator hai, lekin traders ko yaad rakhna chahiye ke har indicator ki tarah, yeh bhi 100% sahi nahi hota. Isko dusre technical analysis tools ke saath combine karna behtar hota hai. Overbought ya oversold conditions par pura bharosa na karein, aur hamesha risk management ka khayal rakhein.

                  Mass Index Indicator ka istemal market trends aur reversals ko samajhne mein madadgar sabit ho sakta hai, lekin sahi tajwezat ke liye mukhlis analysis aur market conditions ka bhi tajziya karna zaroori hai.


                  • #10 Collapse

                    ### Mass Index Indicator Kya Hota Hai?
                    Mass Index (MI) indicator ek technical analysis tool hai jo market ke reversal points aur volatility ko measure karne ke liye use hota hai. Iska development Dr. Donald Dorsey ne kiya tha aur iska primary purpose market ke trend reversals ko identify karna hai. Mass Index indicator ko samajhna aur use karna traders ke liye market movements ko behtar predict karne mein madadgar sabit ho sakta hai. Aayiye, is indicator ke key aspects aur uski trading strategies ko detail mein dekhte hain.

                    **1. Indicator Ki Calculation:** Mass Index ka calculation price range aur average true range (ATR) ke basis par hota hai. Ye 25-period aur 9-period ke EMA (Exponential Moving Average) ke difference ko measure karta hai. Formula kuch is tarah hota hai:

                    \[ \text{Mass Index} = \text{Sum of the Difference Between the 9-Period EMA and the 25-Period EMA} \]

                    **2. Pattern Analysis:** Mass Index indicator market ki volatility ko measure karta hai aur iska use trend reversals ko predict karne ke liye kiya jata hai. Jab Mass Index value 27 ke upar chali jati hai, toh iska matlab market mein high volatility aur potential trend reversal ka signal hota hai. Iske bawajood, high value ko market ke bullish ya bearish trend ke confirmation ke liye additional indicators ke sath confirm karna zaroori hai.

                    **3. Interpretation:** Mass Index indicator ka primary function market ke trend reversal points ko identify karna hai. Agar Mass Index ki reading 27 ke upar chali jati hai aur phir wapas niche aati hai, toh ye ek potential trend reversal ka signal hota hai. Is indicator ko use karke traders market ke high volatility periods ko bhi identify kar sakte hain, jo ke trading opportunities ko enhance kar sakta hai.

                    **4. Trading Strategy:** Mass Index ko trading strategy mein integrate karte waqt, is indicator ko other technical tools aur indicators ke sath combine karna chahiye. For example, moving averages, RSI (Relative Strength Index), ya MACD (Moving Average Convergence Divergence) ka use karke Mass Index ke signals ko confirm karna zaroori hai. Isse trading decisions zyada reliable aur effective hote hain.

                    **5. Limitations:** Mass Index indicator ke kuch limitations bhi hain. Ye indicator trend reversal ke signals provide karta hai lekin specific entry aur exit points ko identify nahi karta. Isliye, is indicator ko trading strategy ke ek part ke taur par use karna chahiye aur additional analysis tools ko bhi consider karna chahiye.

                    Mass Index indicator market ke trend reversals aur volatility ko track karne ke liye ek valuable tool hai. Iske signals ko sahi tarike se interpret karna aur other technical indicators ke sath use karna trading success ke chances ko badha sakta hai.
                    • #11 Collapse

                      ### Mass Index Indicator Kya Hota Hai?
                      Mass Index (MI) ek technical analysis tool hai jo market ki volatility aur potential trend reversals ko samajhne ke liye istemal hota hai. Yeh indicator particularly price movements ke fluctuations ko measure karta hai aur traders ko market ke overbought ya oversold conditions ka andaza lagane mein madad karta hai. Mass Index indicator ko J. Welles Wilder ne develop kiya tha, jo technical analysis ke mashhoor naam hain.

                      **Mass Index Ka Calculation**: Mass Index ko calculate karne ke liye, aapko do main components ki zarurat hoti hai: high aur low prices ka difference. Yeh formula kuch is tarah se hai:

                      \[ \text{MI} = \sum \left( \frac{High - Low}{High + Low} \right) \times 100 \]

                      Is calculation se aapko ek value milti hai jo price action ki volatility ko darshata hai. Aam tor par, 9-14 periods ka istemal hota hai is indicator ko calculate karne ke liye.

                      **Interpretation**: Mass Index ki reading 26 se zyada hone par market ko overbought mana jata hai, jabke reading 26 se neeche hone par market oversold hota hai. Agar MI 26 ke aas-paas hai, toh yeh potential reversal signal ho sakta hai. Yeh indicators traders ko market ki momentum aur volatility ko samajhne mein madad karte hain.

                      **Trading Strategy**: Jab Mass Index ki reading 26 se zyada ho jaye, toh traders ko caution se kaam lena chahiye kyunki yeh indicate karta hai ke price mein zyada volatility hai. Is waqt, traders ko short positions kholne par ghoor karna chahiye. Iske baraks, jab MI 26 ke neeche ho, toh yeh bullish reversal ka signal hota hai aur traders ko buy positions lene par ghoor karna chahiye.

                      **Caution**: Mass Index indicator kabhi kabhi false signals de sakta hai, isliye ise doosre technical indicators ke sath mila kar istemal karna chahiye. Jaise ki Moving Averages ya RSI, inka istemal karne se confirmation milta hai ke kya market ka trend reversal hone wala hai ya nahi.

                      **Importance**: Mass Index ki importance iski ability mein hai ke yeh traders ko market ke trends aur volatility ko samajhne mein madad karta hai. Yeh ek valuable tool hai jo aapki trading decisions ko behter banane mein madadgar sabit ho sakta hai.

                      Aakhir mein, Mass Index indicator Forex trading mein ek powerful tool hai jo traders ko market ki dynamics ko samajhne aur profitable trades karne mein madad karta hai. Is indicator ko apne trading strategy mein shamil karke aap market ke trends aur reversals ko behter tarike se samajh sakte hain.
                      • #12 Collapse

                        Mass Index Indicator Kya Hota Hai?


                        Mass Index (MI) ek technical analysis tool hai jo price movements ki volatility ko measure karta hai. Ye indicator traders ko ye samajhne mein madad karta hai ke kisi financial asset ki price kis tarah se fluctuate kar rahi hai. Mass Index ki khas baat ye hai ke ye price trends ko identify karne mein madad karta hai, lekin ye buy ya sell signals provide nahi karta.
                        Mass Index Ka Formula


                        Mass Index ka formula kuch is tarah hai:

                        MI=∑n=926(High−Low)MI = \sum_{n=9}^{26} (High - Low) MI=n=9∑26​(High−Low)

                        Yahan par "High" aur "Low" kisi asset ki highest aur lowest prices hain, jo 9 dinon ki period mein measure ki jaati hain. Ye formula traders ko ye samajhne mein madad karta hai ke jab bhi price ki volatility zyada hoti hai, to MI ki value bhi badh jaati hai.
                        Mass Index Ki Interpretation


                        Mass Index ki value 26 se upar hone par ye indicate karta hai ke market mein volatility zyada hai. Jab MI ki value 26 se neeche hoti hai, to ye market ki stability ko darshata hai. Ek khas point hai jab MI 27 ke aas-paas hota hai, is waqt traders ko market ki direction ke liye caution rakhni chahiye, kyun ke ye point trend reversal ka signal ho sakta hai.
                        Mass Index Ko Kaise Use Karein?


                        Traders MI ko dusre indicators ke saath combine karke istemal karte hain. Jaise ke agar aap Moving Average ya Relative Strength Index (RSI) ke sath MI ko dekhte hain, to ye aapko zyada behtar signals de sakta hai.
                        1. Trend Reversal Signal: Jab MI 27 se zyada hota hai, to ye potential reversal points ko darshata hai. Aap is signal ko dekh kar apne trades ka faisla kar sakte hain.
                        2. Volatility Analysis: Agar aapko pata hai ke market ki volatility kab zyada hai, to aap better trades kar sakte hain aur risk ko manage kar sakte hain.
                        Mass Index Ke Faide
                        • Simple Use: MI ka istemal asan hai aur ye quickly market ki volatility ko samajhne mein madad karta hai.
                        • Volatility Management: Traders ko market ki condition ka pata chalta hai, jo unhe zyada informed decisions lene mein madad karta hai.
                        • Trend Confirmation: Ye dusre indicators ke saath use hone par trades ki accuracy ko barhata hai.
                        Conclusion


                        Mass Index ek valuable tool hai jo traders ko market ki volatility ko samajhne mein madad karta hai. Iska sahi istemal aapko behtar trading decisions lene mein madad de sakta hai. Lekin, hamesha yaad rakhein ke kisi bhi trading strategy mein multiple indicators ko consider karna zaroori hai, taki aap apne trades ko maximize kar sakein.
                        • #13 Collapse

                          Mass Index Indicator Kya Hota Hai


                          Mass Index Indicator ek technical analysis tool hai jo price movement ki volatility aur potential reversals ko analyze karne ke liye istemal hota hai. Iska asal maqasad market ki momentum aur trend reversal ki possibilities ko samajhna hai. Is indicator ko J. Welles Wilder ne develop kiya tha, aur ye trading mein kaafi maqbool hai, khaas taur par Forex aur stock markets mein.
                          Mass Index Ka Calculation


                          Mass Index ka calculation do major components par mabni hota hai:
                          1. High aur Low Prices: Pehla step high aur low prices ka istemal karke price range ka pata lagana hai.
                          2. EMA (Exponential Moving Average): Iske baad, 9-period EMA aur 26-period EMA ka istemal hota hai.

                          Is formula ke zariye, aapko price ki volatility ka pata chalta hai. Jab Mass Index ki value 27 se zyada hoti hai, to ye signal deta hai ke market mein reversal hone ki sambhavna hai.
                          Mass Index Ki Interpretation


                          Mass Index ki interpretation kaafi aasaan hai. Jab Mass Index ki value 27 se zyada ho jaati hai, to ye bearish aur bullish trends ke liye potential reversal points ko dikhata hai. Iska matlab ye hai ke agar price downward movement kar raha hai, to wo kisi bhi waqt upward reversal ki taraf ja sakta hai, aur vice versa.
                          Mass Index Ka Faida


                          Mass Index ka sabse bara faida ye hai ke ye ek simple aur effective tool hai jo traders ko entry aur exit points identify karne mein madad karta hai. Iski madad se, traders volatility ko samajh sakte hain aur unhe better trading decisions lene mein madad milti hai.
                          Mass Index Ke Limitation


                          Lekin, Mass Index ke kuch limitations bhi hain. Ye kabhi kabhi false signals de sakta hai, khaas taur par volatile markets mein. Isliye, is indicator ko dusre technical indicators ke sath combine karke use karna behtar hota hai, jese ke Relative Strength Index (RSI) ya Moving Averages.
                          Conclusion


                          Aakhir mein, Mass Index Indicator ek valuable tool hai jo traders ko market ki volatility aur reversal points samajhne mein madad karta hai. Lekin, isse istemal karne se pehle, iske calculations aur interpretations ko achi tarah samajhna zaroori hai, taake aap behtar trading decisions le sakain.
                          • #14 Collapse

                            Mass Index Indicator Kya Hai?


                            Mass Index Indicator ek technical analysis tool hai jo price movements aur volatility ko samajhne ke liye istemal hota hai. Ye indicator, price ki swing highs aur swing lows ke beech ke changes ko measure karta hai, taake trader ko market ki mood aur possible reversals ke bare mein pata chale.
                            Mass Index Ka Tareeqa-e-Kam


                            Mass Index ka formula do exponential moving averages (EMAs) ko istemal karta hai. Ye short-term aur long-term prices ko compare karta hai taake volatility ka pata lagaya ja sake. Ye indicator zyada tar price reversal points ko identify karne ke liye use hota hai.
                            Mass Index Ka Formula


                            Mass Index ka formula kuch yun hai:

                            MI=∑n=1N(high−lowhigh+low)×100MI = \sum_{n=1}^{N} \left( \frac{\text{high} - \text{low}}{\text{high} + \text{low}} \right) \times 100MI=n=1∑N​(high+lowhigh−low​)×100

                            Jahan 'high' aur 'low' market ki high aur low prices hain. Is formula se trader ko volatility ka pata chalta hai.
                            Mass Index Ki Importance


                            Mass Index ki sab se badi importance iski ability hai price reversals ko identify karne mein. Jab Mass Index 27 ya is se upar hota hai, to ye market ki potential reversal ka signal hota hai. Iska matlab ye hai ke market mein zyada volatility hai, jo usually price reversal ka sabab banta hai.
                            Mass Index Aur Market Psychology


                            Mass Index sirf numbers ka khayal nahi rakhta, balki ye market psychology ko bhi reflect karta hai. Jab traders market mein uncertainty mehsoos karte hain, to unki buying aur selling activity badal jati hai, jo Mass Index ko affect karta hai.
                            Mass Index Ki Limitations


                            Har indicator ki tarah, Mass Index bhi kuch limitations rakhta hai. Ye kabhi kabhi false signals de sakta hai, khaaskar jab market trend strong ho. Isliye traders ko hamesha is indicator ko doosre indicators ke sath combine karna chahiye.
                            Mass Index Ka Istemal Kis Tarah Karein?


                            Mass Index ko istemal karne ka tareeqa ye hai ke jab ye 27 ke upar ho, to traders ko caution se kaam lena chahiye. Ye warning hoti hai ke market mein volatility badh rahi hai, aur reversal ka potential hai.
                            Mass Index Aur Trend Reversals


                            Mass Index ko trend reversals identify karne ke liye bhi istemal kiya jata hai. Jab ye indicator peak kar leta hai, to ye signal hota hai ke market mein reversal aa sakta hai. Ye traders ko timely decision lene ka mauka deta hai.
                            Mass Index Ke Saath Aur Indicators Ka Istemal


                            Mass Index ko RSI (Relative Strength Index) ya MACD (Moving Average Convergence Divergence) ke sath combine karna behtar hota hai. Ye additional confirmation provide karta hai aur traders ko zyada accurate signals deta hai.
                            Mass Index Ki Timeframe Selection


                            Mass Index kisi bhi timeframe par istemal kiya ja sakta hai. Lekin, short-term traders ke liye ye zyada faida mand hai. Iska istemal karte waqt traders ko market ki dynamics aur price action ko samajhna chahiye.
                            Mass Index Ka Backtesting


                            Backtesting ek important step hai jo traders ko Mass Index ka istemal karne se pehle karna chahiye. Is process se traders ye dekh sakte hain ke past mein ye indicator kaise kaam kiya aur uske results kya the.
                            Mass Index Aur Risk Management


                            Risk management ke liye Mass Index ka istemal bhi kiya ja sakta hai. Jab ye indicator high volatility ki taraf ishara karta hai, to traders ko apni positions ko monitor karna chahiye aur zaroorat par risk ko limit karna chahiye.
                            Mass Index Ka Psychological Impact


                            Mass Index ka psychological impact bhi hota hai. Jab traders dekhte hain ke Mass Index high hai, to wo psychologically influence hote hain aur is wajah se wo apni strategies mein changes la sakte hain.
                            Mass Index Ka Istemal Kahan Kiya Jata Hai?


                            Mass Index ko stocks, forex, commodities, aur cryptocurrencies mein istemal kiya jata hai. Ye har market mein price movement aur volatility ko track karne mein madadgar hai.
                            Nakhra Aur Conclusion


                            Aakhir mein, Mass Index Indicator ek powerful tool hai jo market ke volatility aur reversals ko samajhne mein madad karta hai. Iska sahi istemal karke traders profitable decisions le sakte hain. Lekin, hamesha yaad rahe ke kisi bhi indicator ka istemal karte waqt caution zaroori hai. Isliye, is indicator ko doosre tools ke sath mila kar istemal karna chahiye taake zyada accurate results mil sakein.
                            • <a href="https://www.instaforex.org/ru/?x=ruforum">InstaForex</a>
                            • #15 Collapse

                              Mass Index Indicator Kya Hota Hai?
                              Mass Index Indicator aik technical tool hai jo traders aur investors financial markets main price volatility ko measure karne ke liye use karte hain. Yeh tool khas tor par market mein significant price reversals ko predict karne mein madad deta hai. Is article main hum Mass Index Indicator ko samjhenge, iska tareeqa kaar jaanenge aur kaise yeh trading decisions ko asaan banata hai, yeh dekhenge.

                              1. Mass Index Indicator ka Bunyadi Taaruf
                              Mass Index Indicator ko Donald Dorsey ne introduce kiya tha 1992 mein. Yeh aik technical analysis tool hai jo price volatility ko track karta hai, aur ye highlight karta hai ke jab price movements exaggerated hoti hain to market trend reversal ki possibility hoti hai. Iska aik khaas formula hota hai jo price movements ka specific range calculate karta hai.

                              2. Indicator ka Maqsad Kya Hai?
                              Mass Index Indicator ka asli maqsad price range ko monitor karna aur identify karna hota hai ke jab yeh range abnormal ho jaye to price reversal aasakta hai. Market ke under kahin bhi trend ke badalne ka khatra hota hai, aur is tool ko istimaal karke trader predict karte hain ke kab yeh change aane wala hai.

                              3. Formula Samjhnay Ka Tareeqa
                              Is indicator ka formula aik moving average aur exponential moving average (EMA) per mabni hota hai. Formula kuch is tarah ka hota hai:

                              Mass Index = (25-period EMA of the range/ 9-period EMA of the range).

                              Is formula mein “range” ko high aur low prices ka difference kaha jata hai. 25-period aur 9-period moving averages ko use karke hum volatility ko accurately measure karte hain.

                              4. Mass Index Indicator Kaise Kaam Karta Hai?
                              Mass Index Indicator market mein price ki volatility ko track karta hai, lekin yeh trend ka direction predict nahi karta. Jab Mass Index aik certain level par pohanchta hai, to yeh indication hoti hai ke market mein price reversal ho sakta hai. Generally, jab Mass Index 27 ke level tak pohanchta hai aur phir neeche aata hai, to isko "reversal bulge" kehte hain.

                              5. Reversal Bulge Ka Concept
                              Reversal bulge aik concept hai jo Mass Index Indicator ke through samjha jata hai. Jab yeh bulge ban jata hai, to market mein trend change ki expectation hoti hai. Isko 27 se zyada value hone par samjha jata hai. Jaise hi yeh value neeche aati hai, traders apne strategies ko adjust karte hain, kyun ke price trend ka badalna expected hota hai.

                              6. Bullish Aur Bearish Reversals
                              Mass Index Indicator se aap market mein bullish aur bearish reversals ko identify kar sakte hain. Bullish reversal ka matlab hai ke market neeche se upar ki taraf jaane wali hai, aur bearish reversal ka matlab hai ke market upar se neeche aane wali hai. Mass Index koi clear buy ya sell signal nahi deta, lekin yeh trend ke badalne ka indication zaroor de sakta hai.

                              7. Kya Mass Index Indicator Reliable Hai?
                              Mass Index Indicator ek valuable tool hai, lekin yeh hamesha 100% reliable nahi hota. Yeh tool aap ko reversal points ki prediction de sakta hai lekin isko sirf apne akele basis par use nahi karna chahiye. Dusri technical indicators ke sath iska istemal karna ziada effective hota hai.

                              8. Isko Istemaal Karne Ka Tarz-e-Amal
                              Mass Index ko istimaal karna asan hai agar aapko technical analysis tools ka pehle se maloomat ho. Aapko apne trading platform mein Mass Index indicator ko enable karna hota hai, aur phir aapko dekhna hota hai ke kab indicator 27 ke qareeb pohanchta hai. Isko reversal bulge dekh kar market mein apne positions ko adjust karna hota hai.

                              9. Mass Index Indicator Aur Dusre Indicators
                              Mass Index ko jab RSI (Relative Strength Index) aur MACD (Moving Average Convergence Divergence) ke sath use kiya jata hai, to yeh ziada powerful ho jata hai. Yeh combination aapko market ke momentum ke bare mein detailed information de sakta hai, aur iss se aapko market ke signals ko confirm karna asan hota hai.

                              10. Chhoti Timeframes Mein Iska Faida
                              Mass Index Indicator chhoti timeframes mein bhi kaam karta hai, lekin zyada tar yeh long-term analysis ke liye istimaal hota hai. Short-term trading mein isko istimaal karte waqt aapko extra caution ki zarurat hoti hai, kyun ke small price movements ke wajah se false signals milne ka khatra hota hai.

                              11. Scalping Aur Day Trading Mein Istemaal
                              Scalpers aur day traders ke liye Mass Index Indicator ka istemal important ho sakta hai agar wo short-term reversals ko predict karna chahte hain. Lekin yeh yad rahe ke yeh tool akela short-term trades ke liye ziada beneficial nahi hota. Short-term trades mein volatility ka zyada asar hota hai aur isko dusre indicators ke sath combine karna zaroori hota hai.

                              12. Limitations of Mass Index Indicator
                              Jese har technical indicator ki kuch limitations hoti hain, waise hi Mass Index Indicator ki bhi hain. Yeh trend ka direction nahi batata, sirf volatility ka zikar karta hai. Aapko hamesha doosre indicators ke sath isko use karna chahiye taake trading ke decisions zyada precise ho sakein.

                              13. Backtesting Ka Ahamiyat
                              Mass Index Indicator ko trading strategy ka hissa banate waqt, backtesting karna lazmi hota hai. Backtesting ke zariye aap past market data ko use kar ke check karte hain ke kya indicator ne accurate signals diye hain ya nahi. Yeh aapko future trading ke liye better planning karne mein madad deta hai.

                              14. Kaise Market Mein Success Paayi Ja Sakti Hai?
                              Mass Index Indicator ke sahi istemal se aap market mein kaafi success hasil kar sakte hain, lekin aapko consistent research, analysis, aur dusre technical tools ko bhi istemal karna hoga. Trading mein successful hone ke liye risk management aur discipline zaroori hai, aur Mass Index aapko market ke critical junctures ko pehchanane mein madad de sakta hai.

                              Conclusion
                              Mass Index Indicator aik unique aur powerful tool hai jo market mein price volatility ko measure karne mein madad deta hai. Yeh trend reversal ko predict karne mein acha hota hai, lekin isko other technical indicators ke sath use karna zaroori hota hai taake signals ko confirm kiya ja sake. Reversal bulge ka concept samajh kar aur correct strategies apply kar ke aap market mein achi performance dekh sakte hain.
                               

                              اب آن لائن

                              Working...
                              X