Mass Index Indicator ek technical analysis ka indicator hai jo market volatility aur trend reversals ko measure karta hai. Is indicator ka istemal traders aur investors market ke possible trend changes ko predict karne ke liye karte hain.
Mass Index Indicator Kya Hota Hai: Mass Index ko Donald Dorsey ne 1995 mein develop kiya tha. Iska maqsad hai market volatility ko evaluate karna aur potential trend reversals ko pehchan'na. Yeh primarily overbought aur oversold conditions ko detect karne ke liye istemal hota hai.
Mass Index Ka Tareeqa: Mass Index ko calculate karne ke liye, do steps follow kiye jate hain:
- Range Expansion:
- Har din ke closing prices ka difference calculate hota hai.
- Fir, ek smoothing factor (usually a 9-day exponential moving average) se multiply kiya jata hai.
- Is se daily price movements ka average range nikala jata hai.
- Mass Index Calculation:
- Phir, ek 9-day exponential moving average (EMA) of the average daily price range calculate kiya jata hai.
- Uske baad, Mass Index ka final calculation hota hai, jo EMA of the average range ka double hota hai.
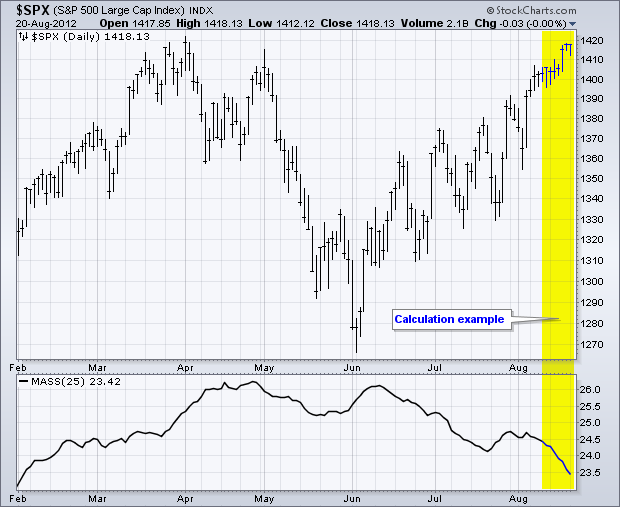
Mass Index Indicator Ki Tabeer: Mass Index ka primary use yeh hai ke jab yeh indicator ek certain level se upar jata hai (usually 27), toh yeh indicate karta hai ke market mein potential reversal hone ke chances hain. Yeh overbought condition ko show karta hai.
Agar Mass Index 26 se kam ho jaye, toh yeh indicate karta hai ke market mein volatility kam ho sakti hai aur potential trend reversal ka chance hai.
Hosla Afzaai aur Hifazati Tadabeer: Mass Index ek powerful indicator hai, lekin traders ko yaad rakhna chahiye ke har indicator ki tarah, yeh bhi 100% sahi nahi hota. Isko dusre technical analysis tools ke saath combine karna behtar hota hai. Overbought ya oversold conditions par pura bharosa na karein, aur hamesha risk management ka khayal rakhein.
Mass Index Indicator ka istemal market trends aur reversals ko samajhne mein madadgar sabit ho sakta hai, lekin sahi tajwezat ke liye mukhlis analysis aur market conditions ka bhi tajziya karna zaroori hai.
تبصرہ
Расширенный режим Обычный режим