Price action wo movement hoti hai jisme security ya currency ki keemat ek makhsoos muddat mein hoti hai, jise traders future price movements ka andaza lagane ke liye istemal karte hain. Traditional technical indicators ke khilaaf, jo ke hisabati calculations par mabni hoti hain, price action indicators historical price data jaise ke open, high, low, aur close prices par mabni hoti hain. Traders is information ko istemal karte hain patterns, trends aur potential reversal points ko pehchanne ke liye.
Principles of Price Action Indicators
Price Action Indicators Working
Price action indicators wo tools hain jo traders istemal karte hain taake price action data ko samajhna asan hojaye. Traditional indicators ke khilaaf, jese ke moving averages ya stochastic oscillators, price action indicators mein mushkil hisabati formulas nahi hote. Balkay, ye raw price data aur market psychology par mabni hote hain. Yahan kuch mashhoor price action indicators hain aur ye forex trading mein kaise kaam karte hain.
Moving Averages
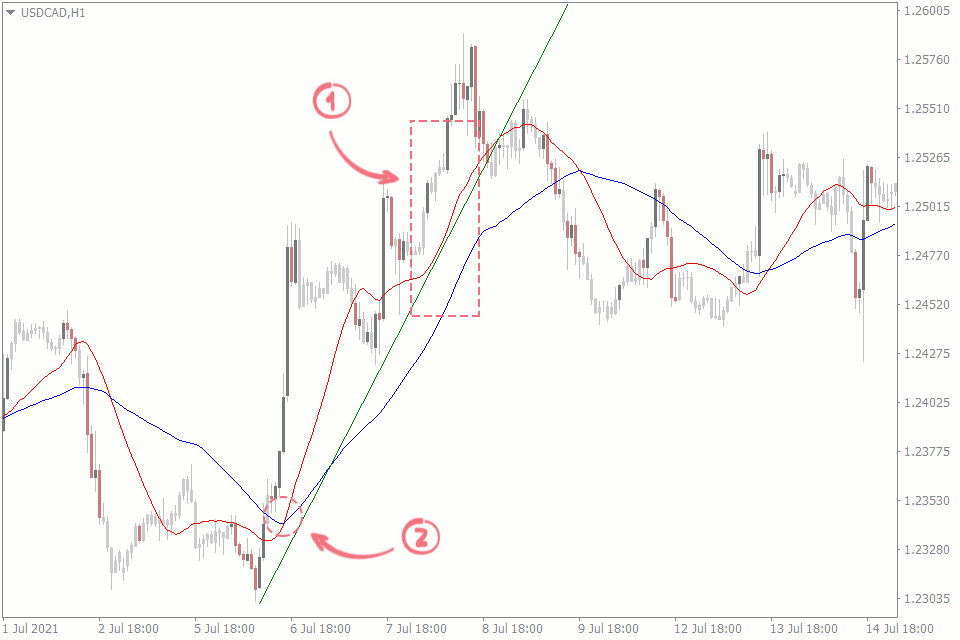
Moving averages sab se aam istemal hone wale price action indicators mein se ek hain. Ye price data ko aik makhsoos muddat mein average karke chart par aik line banate hain. Traders moving averages ko trends aur potential reversal points pehchanne ke liye istemal karte hain. Jab price moving average ke upar hoti hai, ye uptrend ko darust karta hai, jabke price moving average ke neeche hoti hai, ye downtrend ko darust karta hai. Traders aksar short-term aur long-term moving averages ke darmiyan crossovers ki taraf tawajah dete hain ke trend ke changes ko confirm karein.
Bollinger Bands
Bollinger Bands aik middle band (simple moving average) aur do outer bands se mil kar banti hai jo price movements ki standard deviation ko darust karte hain. Bands ki chonchani maqamiyat par base par inka width expand aur contract hota hai. Jab price outer bands ko touch karta hai ya inke baar mein chala jata hai, ye overbought ya oversold conditions ko darust karta hai, jo potential reversal points ko indicate karta hai. Traders Bollinger Bands ko doosri price action tools ke sath istemal karte hain taake trading signals ko confirm karein.
Relative Strength Index (RSI)
RSI ek momentum oscillator hai jo price movements ki tezi aur tabdeeli ko napta hai. Ye 0 se 100 tak range banati hai aur aam taur par overbought aur oversold conditions ko pehchanne ke liye istemal hoti hai. Jab RSI values 70 se zyada hoti hain, ye overbought conditions ko darust karte hain, jo potential reversal ko indicate karte hain. Umgeer iske, RSI values 30 se kam hone par oversold conditions ko darust karta hai, jo potential reversal ko indicate karte hain. Traders RSI ko price action analysis ke sath istemal karte hain trading entries ya exits ko confirm karne ke liye.
Stochastic Oscillator
Stochastic oscillator ek security ke closing price ko uske price range ke sath compare karta hai jo makhsoos muddat mein hoti hai. Ye 0 se 100 tak ke values generate karta hai, jo overbought aur oversold conditions ko darust karte hain. Traders potential reversal points ko pehchanne ke liye stochastic oscillator mein crossovers aur divergences ko dekhte hain. Jab oscillator 80 ke upar cross karta hai, ye overbought conditions ko darust karta hai, jabke 20 ke neeche crossover oversold conditions ko indicate karta hai.
Principles of Price Action Indicators
- Candlestick Patterns: Candlestick patterns price action analysis ke bunyadi hisse hain. Ye patterns market ke jazbat aur potential price reversals ki taraf ishara karte hain. Aam candlestick patterns mein doji, hammer, engulfing aur shooting star shamil hain, har ek apni khas tabeer ke sath. Misal ke tor par, doji candlestick market mein uncertainty ko darust karte hain, jo ke potential reversal points par hoti hain.
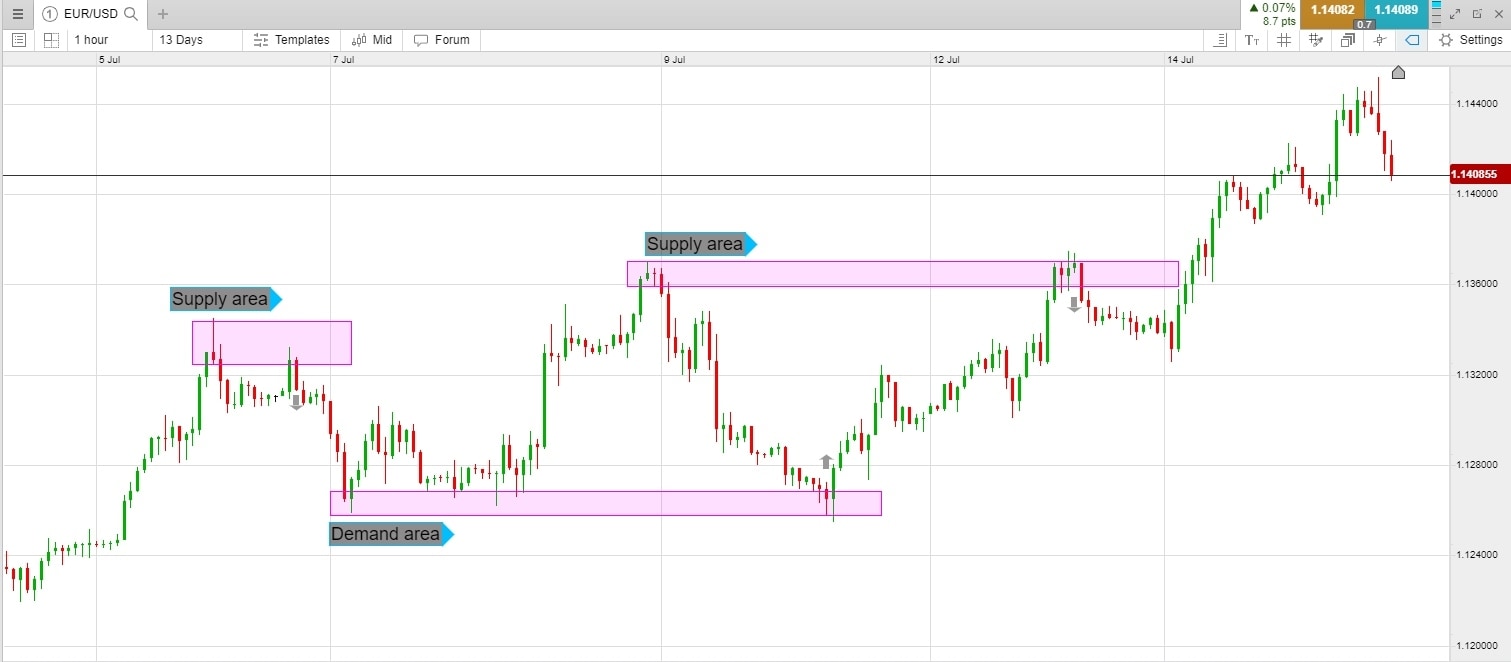
- Support and Resistance Levels: Support aur resistance levels ahem price levels hote hain jahan market ka reaction hota hai. Support levels ek qeemat darust karte hain, jo ke prices ko neeche girne se rokta hai, jabke resistance levels ek makhsoos level ko paar hone se rokta hai. Traders in levels ko potential entry aur exit points ke liye pehchante hain apni trades ke liye.
- Trendlines: Trendlines ek price chart par draw ki jaane wali lines hote hain jo consecutive lows ko uptrend mein ya consecutive highs ko downtrend mein jorna ke liye istemal hoti hain. Ye traders ko market ki direction ko visualize karne mein madad karte hain aur trend reversal points ko pehchanne mein help karte hain. Jab price trendline ke qareeb hoti hai, ye traders ke liye ek ahem faislay ka point ban jati hai.
- Price Patterns: Price patterns, jese ke head and shoulders, triangles, aur flags, charts par price movements se banne wale formations hote hain. Ye patterns potential trend reversals ya continuations ke bare mein malumat farahem karte hain. Traders in price patterns ko istemal karte hain ke market ki movements ka andaza lagayein aur usi ke mutabiq trading decisions lein.
Price Action Indicators Working
Price action indicators wo tools hain jo traders istemal karte hain taake price action data ko samajhna asan hojaye. Traditional indicators ke khilaaf, jese ke moving averages ya stochastic oscillators, price action indicators mein mushkil hisabati formulas nahi hote. Balkay, ye raw price data aur market psychology par mabni hote hain. Yahan kuch mashhoor price action indicators hain aur ye forex trading mein kaise kaam karte hain.
Moving Averages
Moving averages sab se aam istemal hone wale price action indicators mein se ek hain. Ye price data ko aik makhsoos muddat mein average karke chart par aik line banate hain. Traders moving averages ko trends aur potential reversal points pehchanne ke liye istemal karte hain. Jab price moving average ke upar hoti hai, ye uptrend ko darust karta hai, jabke price moving average ke neeche hoti hai, ye downtrend ko darust karta hai. Traders aksar short-term aur long-term moving averages ke darmiyan crossovers ki taraf tawajah dete hain ke trend ke changes ko confirm karein.
Bollinger Bands
Bollinger Bands aik middle band (simple moving average) aur do outer bands se mil kar banti hai jo price movements ki standard deviation ko darust karte hain. Bands ki chonchani maqamiyat par base par inka width expand aur contract hota hai. Jab price outer bands ko touch karta hai ya inke baar mein chala jata hai, ye overbought ya oversold conditions ko darust karta hai, jo potential reversal points ko indicate karta hai. Traders Bollinger Bands ko doosri price action tools ke sath istemal karte hain taake trading signals ko confirm karein.
Relative Strength Index (RSI)
RSI ek momentum oscillator hai jo price movements ki tezi aur tabdeeli ko napta hai. Ye 0 se 100 tak range banati hai aur aam taur par overbought aur oversold conditions ko pehchanne ke liye istemal hoti hai. Jab RSI values 70 se zyada hoti hain, ye overbought conditions ko darust karte hain, jo potential reversal ko indicate karte hain. Umgeer iske, RSI values 30 se kam hone par oversold conditions ko darust karta hai, jo potential reversal ko indicate karte hain. Traders RSI ko price action analysis ke sath istemal karte hain trading entries ya exits ko confirm karne ke liye.
Stochastic Oscillator
Stochastic oscillator ek security ke closing price ko uske price range ke sath compare karta hai jo makhsoos muddat mein hoti hai. Ye 0 se 100 tak ke values generate karta hai, jo overbought aur oversold conditions ko darust karte hain. Traders potential reversal points ko pehchanne ke liye stochastic oscillator mein crossovers aur divergences ko dekhte hain. Jab oscillator 80 ke upar cross karta hai, ye overbought conditions ko darust karta hai, jabke 20 ke neeche crossover oversold conditions ko indicate karta hai.

تبصرہ
Расширенный режим Обычный режим