How Price Action Indicators Work
X
  • وقت
  • دکھائیں
Clear All
new posts
  • #1 Collapse

    How Price Action Indicators Work
    Price action wo movement hoti hai jisme security ya currency ki keemat ek makhsoos muddat mein hoti hai, jise traders future price movements ka andaza lagane ke liye istemal karte hain. Traditional technical indicators ke khilaaf, jo ke hisabati calculations par mabni hoti hain, price action indicators historical price data jaise ke open, high, low, aur close prices par mabni hoti hain. Traders is information ko istemal karte hain patterns, trends aur potential reversal points ko pehchanne ke liye.
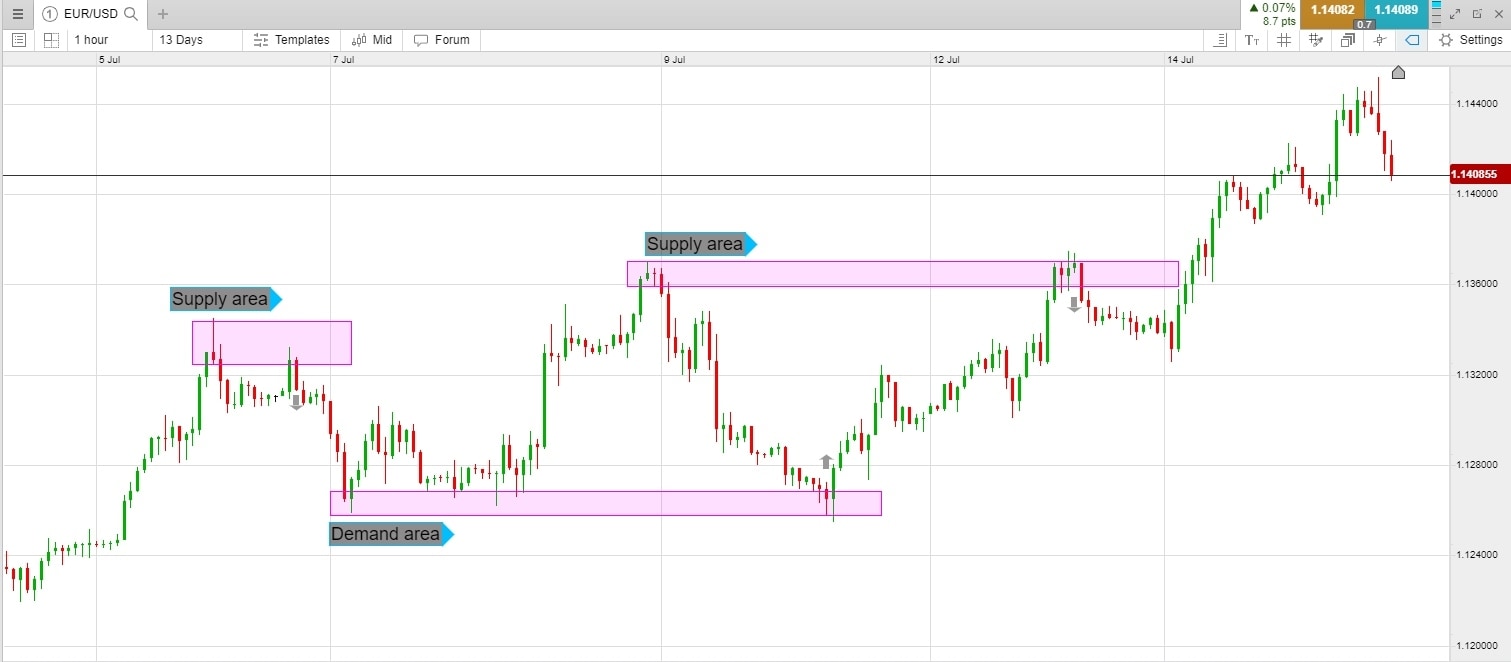


    Principles of Price Action Indicators
    • Candlestick Patterns: Candlestick patterns price action analysis ke bunyadi hisse hain. Ye patterns market ke jazbat aur potential price reversals ki taraf ishara karte hain. Aam candlestick patterns mein doji, hammer, engulfing aur shooting star shamil hain, har ek apni khas tabeer ke sath. Misal ke tor par, doji candlestick market mein uncertainty ko darust karte hain, jo ke potential reversal points par hoti hain.
    • Support and Resistance Levels: Support aur resistance levels ahem price levels hote hain jahan market ka reaction hota hai. Support levels ek qeemat darust karte hain, jo ke prices ko neeche girne se rokta hai, jabke resistance levels ek makhsoos level ko paar hone se rokta hai. Traders in levels ko potential entry aur exit points ke liye pehchante hain apni trades ke liye.
    • Trendlines: Trendlines ek price chart par draw ki jaane wali lines hote hain jo consecutive lows ko uptrend mein ya consecutive highs ko downtrend mein jorna ke liye istemal hoti hain. Ye traders ko market ki direction ko visualize karne mein madad karte hain aur trend reversal points ko pehchanne mein help karte hain. Jab price trendline ke qareeb hoti hai, ye traders ke liye ek ahem faislay ka point ban jati hai.
    • Price Patterns: Price patterns, jese ke head and shoulders, triangles, aur flags, charts par price movements se banne wale formations hote hain. Ye patterns potential trend reversals ya continuations ke bare mein malumat farahem karte hain. Traders in price patterns ko istemal karte hain ke market ki movements ka andaza lagayein aur usi ke mutabiq trading decisions lein.


    Price Action Indicators Working
    Price action indicators wo tools hain jo traders istemal karte hain taake price action data ko samajhna asan hojaye. Traditional indicators ke khilaaf, jese ke moving averages ya stochastic oscillators, price action indicators mein mushkil hisabati formulas nahi hote. Balkay, ye raw price data aur market psychology par mabni hote hain. Yahan kuch mashhoor price action indicators hain aur ye forex trading mein kaise kaam karte hain.

    Moving Averages
    Moving averages sab se aam istemal hone wale price action indicators mein se ek hain. Ye price data ko aik makhsoos muddat mein average karke chart par aik line banate hain. Traders moving averages ko trends aur potential reversal points pehchanne ke liye istemal karte hain. Jab price moving average ke upar hoti hai, ye uptrend ko darust karta hai, jabke price moving average ke neeche hoti hai, ye downtrend ko darust karta hai. Traders aksar short-term aur long-term moving averages ke darmiyan crossovers ki taraf tawajah dete hain ke trend ke changes ko confirm karein.

    Bollinger Bands
    Bollinger Bands aik middle band (simple moving average) aur do outer bands se mil kar banti hai jo price movements ki standard deviation ko darust karte hain. Bands ki chonchani maqamiyat par base par inka width expand aur contract hota hai. Jab price outer bands ko touch karta hai ya inke baar mein chala jata hai, ye overbought ya oversold conditions ko darust karta hai, jo potential reversal points ko indicate karta hai. Traders Bollinger Bands ko doosri price action tools ke sath istemal karte hain taake trading signals ko confirm karein.
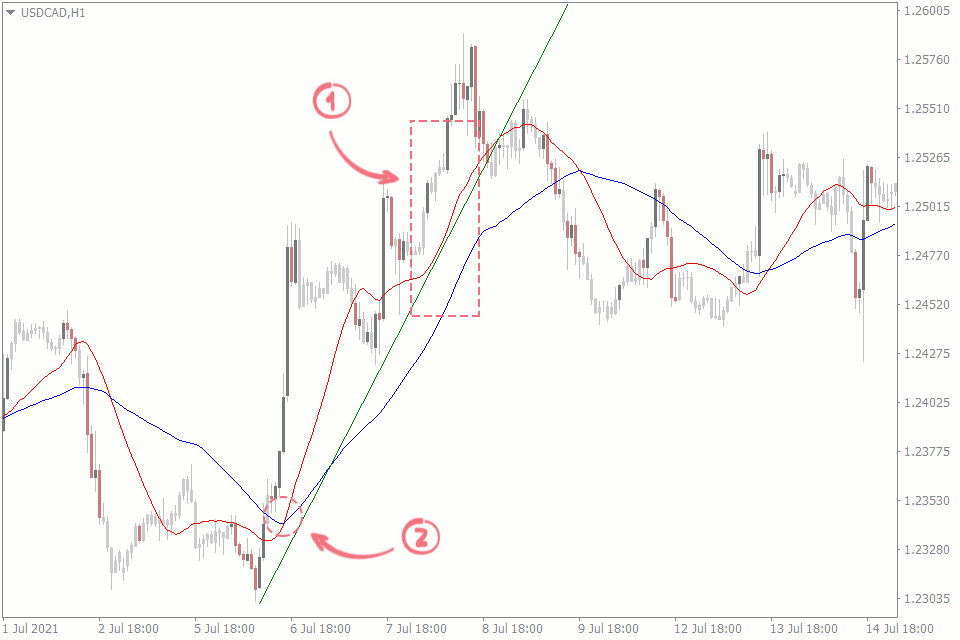


    Relative Strength Index (RSI)
    RSI ek momentum oscillator hai jo price movements ki tezi aur tabdeeli ko napta hai. Ye 0 se 100 tak range banati hai aur aam taur par overbought aur oversold conditions ko pehchanne ke liye istemal hoti hai. Jab RSI values 70 se zyada hoti hain, ye overbought conditions ko darust karte hain, jo potential reversal ko indicate karte hain. Umgeer iske, RSI values 30 se kam hone par oversold conditions ko darust karta hai, jo potential reversal ko indicate karte hain. Traders RSI ko price action analysis ke sath istemal karte hain trading entries ya exits ko confirm karne ke liye.

    Stochastic Oscillator
    Stochastic oscillator ek security ke closing price ko uske price range ke sath compare karta hai jo makhsoos muddat mein hoti hai. Ye 0 se 100 tak ke values generate karta hai, jo overbought aur oversold conditions ko darust karte hain. Traders potential reversal points ko pehchanne ke liye stochastic oscillator mein crossovers aur divergences ko dekhte hain. Jab oscillator 80 ke upar cross karta hai, ye overbought conditions ko darust karta hai, jabke 20 ke neeche crossover oversold conditions ko indicate karta hai.
    Believe in yourself and your abilities. When you fight for your dreams, you can achieve anything.
  • <a href="https://www.instaforex.org/ru/?x=ruforum">InstaForex</a>
  • #2 Collapse

    Assalamu Alaikum Dosto!

    Price Action Trading Strategy


    Price action ek tareeka hai jisse alag-alag instruments ki market movements ko analyze aur padha ja sakta hai. Yeh method sabhi markets mein lagoo hota hai aur yeh ek sabse zyada istemal hone wala tareeka hai. Ek forex trader ke nazariye se, price action ka matlab hota hai ke trading sirf ek price chart ke mutabiq ki ja rahi hai, bina kisi technical indicators ke. Ant mein, technical indicators price se derive hote hain, isliye pure price movements par adharit market ko padhna sikhna beshak zaroori hai.
    Price action istemal karte waqt, traders itihasi keematon ko padhte hain aur chart se zaroori signals ko pehchane ki koshish karte hain. Zaroori hai samajhna ki price action market par order flow ko dikhata hai. Is tarah, price action par adharit, trader dekhta hai ki doosre traders ne kya kiya, aur woh pehchan leta hai ki order flow kahan ja raha hai. Agar trader koi significant impulsive movement pehchan leta hai, toh woh uss direction mein trade karne ki koshish karega.
    Price action traders uss principle ka istemal karte hain jo past mein price ne kisi level par turn kiya tha, aur phir woh level second time test kiya gaya. Jab aisa level pehchan jata hai, toh trader wahan price ko wapas aane ka intezaar karta hai, price wahan level ka retest karta hai, aur trader tabhi trade karta hai jab wazeh ho jata hai ke price ne uss level ka kaise jawab diya.

    Click image for larger version

Name:	images (249).jpeg
Views:	29
Size:	55.5 کلوبائٹ
ID:	12779570

    Why Price Action?

    Price action ka ek faida yeh hai ki yeh higher time frames par kaam karta hai, jise large banks istemal karte hain jo market ko jahan chahe le jaane ke liye kafi capital rakhte hain. Retail traders ke paas aisi possibilities nahi hoti, lekin woh price action ko higher timeframes par istemal karke dekh sakte hain ke in market players ne past mein kya kiya tha aur woh phir se kya kar sakte hain. Ek aur fayda yeh hai ki price action istemal karke mumkin hai alag-alag patterns ko pehchanne ka, jo markets mein ek khaas probability ke saath dohraye ja sakte hain.
    Jab aap sikh jaate hain ki yeh market patterns kaise padhe jaate hain, toh aapko saaf pata chalega ki aap market mein kis cheez ki talash kar rahe hain aur isliye aapke liye trade ke parameters tay karna aasan ho jayega. Is tarah ka ek pattern ka example hai trend, jahan uptrend ke case mein higher highs aur higher lows regularly alternate hote hain ya downtrend ke case mein lower highs aur lower lows.
    Price action ka ek nuksan yeh hai ki market mein kai alag-alag patterns hote hain, aur har trader chart mein kuch aur dekhta hai. Jahan ek trader ek continue hone wale downtrend ko dekhta hai, wahan doosra shayad us trend ko palatne ka potential dekhe. Charts ko objective taur par padhna ek aisi skill hai jo asaan nahi hai. Ise sikhne ke liye, is par sadhe sau ghante tak kaam karna hoga.

    Click image for larger version

Name:	images (1) (212).png
Views:	25
Size:	7.6 کلوبائٹ
ID:	12779571

    Price Action Ke Asar


    Market ke sath price action trading ke context ya structure mein sab se ahem cheez hai. Jab price action ke saath trade karte hain, toh hamein market ko uss context mein dekhna chahiye jo hamein mukammal malumat farahem karta hai. Market structure sirf ek ya do candlesticks se tay nahi hota, balki iske liye market ka ek kafi bara nazariya zaroori hai.
    Iske alawa, humein candlesticks ki lambai mein bhi dilchaspi leni chahiye, kya candlesticks apne highs ya lows ke kareeb hain, kya ek color ki candlesticks dominate kar rahi hai, woh kis tarah se kisi level tak pahunchti hain, aadi. Is par amal karke hum phir impulsive movements aur corrections ko pehchan sakte hain.

    Impulsive movement ko aise movements mein describe kiya ja sakta hai jahan lambi candlesticks hain, candlesticks apne highs ya lows ke kareeb band hoti hain, aur iss impulsive movement ke andar ek color ki candlesticks dominate karti hai. Impulsive movements aksar bahut tezi se hoti hain. Impulsive movements ke khilaf trade karna bohot risky hota hai.
    Dusri taraf, Corrective movement woh movement hai jahan candlesticks aam taur par chhoti hoti hain aur woh aksar badalti rehti hain. Is movement mein zyada waqt lagta hai. Corrective movement impulsive movement ko follow karti hai aur aam taur par uske khilaf hoti hai. Corrective movement ka istemal pehle ke impulsive movement ke direction mein trade karne ke liye kiya jata hai.

    Click image for larger version

Name:	images (1) (213).png
Views:	24
Size:	19.4 کلوبائٹ
ID:	12779572

    Trends

    Trend upar ya neeche ja raha hota hai. Hum trends ke ek chapter se jante hain ki upward trend ko higher highs aur higher lows ki series se character kiya jata hai, jabki downward trend lower lows ke baad lower highs ke saath hota hai. Trends volatile ya non-volatile hote hain. Agar hum trend pehchane, toh uss trend ke direction mein hamesha trade karna chahiye, jo trend ke khilaf trade karne se zyada kamyaab hone ke zyada chances deta hai.

    Supports aur Resistances

    Supports aur resistances (ya resistances) price action method ke doosre important elements hain. Yeh woh areas hain jahan ek instrument ki keemat rukti hai aur mud jati hai. Agar keemat support area ke qareeb aati hai, toh yeh woh level hai jahan buyers khel mein shamil hote hain aur woh is level se neeche jane nahi dete hain. Agar, doosri taraf, keemat resistance level ke qareeb aati hai, toh sellers action mein aate hain aur keemat ko is level se upar jane nahi dete hain.[*] Support aur Resistance Levels ki Reaction

    Price action ka ek aur important element hai support aur resistance levels par hone wale reaction ko pehchan na. Sirf uske baad, yeh zyada clear ho jata hai ki keemat kis taraf ja rahi hai aur trader trading idea ko market context ke mutabiq le sakta hai. Is tarah, agar market downtrend mein hai, toh trader ko sirf short trades leni chahiye, agar market uptrend mein hai, toh sirf long trades leni chahiye.
    Ye reactions candlestick formations se pehchani ja sakti hain. Hum agle chapters mein inke bare mein baat karenge. Agar support aur resistance level par reaction market context ke khilaf hota hai, toh context negate ho jata hai aur trader ko aisi situation mein trade nahi karna chahiye.

    Click image for larger version

Name:	images (1) (214).png
Views:	24
Size:	20.6 کلوبائٹ
ID:	12779573
    • #3 Collapse


      How Price Action Indicators Work

      Price Action Indicators ka Kaam Kaise Karte Hain

      Price Action Indicators (Keemat Amal Ke Naqsha) kafi mukhtalif hote hain aur market ke maamlat ke baray mein mukhtalif maloomat faraham karte hain. Ye indicators traders ko market ke movements ke baray mein maloomati pehlu faraham karte hain taake wo trading decisions lene mein madad le sakein. Yeh article, Price Action Indicators ke tareeqe kaar aur unke istemal ke baray mein Roman Urdu mein tafseel se wazeh karta hai.


      Click image for larger version

Name:	K22.png
Views:	28
Size:	10.2 کلوبائٹ
ID:	12841845


      1. Price Action Indicators Ki Ahmiyat

      Price Action Indicators market trends aur price movements ko samajhne mein madad karte hain. In indicators ka istemal traders ko market ke dynamics ko samajhne aur potential trading opportunities ko pehchanne mein madad deta hai.

      2. Candlestick Patterns

      Candlestick patterns price action indicators mein aham kirdaar ada karte hain. Ye patterns price ke movements aur market sentiment ka ek acha jayeza dete hain. Jaise ke "Hammer", "Doji", aur "Engulfing" wagaira.

      3. Support aur Resistance Levels

      Support aur resistance levels bhi price action indicators ki tarah kaam karte hain. Support level woh area hota hai jahan price ka girna rukta hai aur resistance level woh area hota hai jahan price ka barhna rukta hai.

      4. Price Channels

      Price channels bhi price action indicators ki category mein aate hain. Ye channels price ke movements ko ek specific range mein display karte hain aur traders ko trend ka pata lagane mein madad dete hain.

      5. Moving Averages

      Moving averages bhi price action indicators mein shamil hote hain. Ye indicators past price data ka average calculate karte hain aur is se current trend ka pata lagaya jata hai.

      6. Volume Analysis

      Volume analysis bhi ek ahem price action indicator hai. Volume ke baray mein maloomat traders ko market ke activity aur price movements ka acha andaza deti hai.

      Price Action Indicators Ka Istemal Kaise Karein

      Price action indicators ka istemal trading strategies ko develop karne aur trading decisions lene ke liye kiya jata hai. Yeh kuch steps hain jo traders price action indicators ka istemal karte hue follow karte hain:

      1. Market Analysis: Price action indicators ki madad se market analysis karein aur current trends aur price movements ko samjhein.

      2. Trading Strategies: Price action indicators ko istemal karke apni trading strategies ko develop karein. Different indicators ko combine karke ya sirf ek indicator par focus karke aap apni trading strategy ko customize kar sakte hain.

      3. Risk Management: Trading ke doran risk management ko hamesha yaad rakhein. Price action indicators ke istemal se trading decisions lene se pehle risk aur reward ka tayyun karein.

      4. Practice: Price action indicators ko samajhne aur istemal karne ke liye practice zaroori hai. Demo accounts ya backtesting ke zariye aap apni skills ko improve kar sakte hain.

      Conclusion

      Price action indicators trading mein ek ahem hissa hain aur traders ko market ke movements aur trends ko samajhne mein madad dete hain. In indicators ko istemal karke traders apni trading strategies ko improve kar sakte hain aur better trading decisions le sakte hain. Lekin, yeh zaroori hai ke traders apni research aur analysis ko mazboot karke hi trading karein aur sirf indicators par pura bharosa na karein.
      • #4 Collapse

        **Price Action Indicators Kaam Kaise Karte Hain?**
        Price action indicators trading mein ek ahem role play karte hain aur market trends aur price movements ko analyze karne mein madadgar hote hain. Yeh indicators technical analysis tools ka part hain jo price charts par directly based hote hain, bina kisi external data ya lagging indicators ke. Price action indicators market ki real-time conditions ko samajhne aur trading decisions ko optimize karne ke liye use hote hain.

        **Price Action Indicators Key Definition:**

        Price action indicators wo tools hain jo market ki price movements aur trends ko analyze karte hain. Inka focus price ke historical data aur real-time movements par hota hai. Yeh indicators candlestick patterns, support and resistance levels, aur price trends ko highlight karte hain. Price action indicators ka main objective market ke current conditions ko accurately predict karna hai.

        **Indicators Kaam Karne Ka Tareeqa:**

        1. **Candlestick Patterns:** Price action indicators candlestick patterns ko analyze karte hain jo market ke trend reversals aur continuation signals ko show karte hain. Patterns jaise Doji, Engulfing, aur Pin Bar market ke potential reversals ka indication dete hain. Traders in patterns ko market conditions ko samajhne aur trading decisions lene ke liye use karte hain.

        2. **Support Aur Resistance Levels:** Price action indicators support aur resistance levels ko identify karte hain jo market ke key price points hote hain. Support level wo price point hota hai jahan market girti hui price ko support milti hai, jabke resistance level wo point hota hai jahan price ko upar jaane mein rukawat aati hai. Traders in levels ka use entry aur exit points decide karne ke liye karte hain.

        3. **Trend Lines Aur Channels:** Trend lines aur channels price action indicators hain jo market ke trends ko visualize karte hain. Trend lines market ke higher highs aur lower lows ko connect karte hain, jabke channels market ke fluctuations ko capture karte hain. Yeh indicators market ke direction aur momentum ko identify karne mein madadgar hote hain.

        **Trading Strategy:**

        Traders price action indicators ko combine kar ke trading strategies develop karte hain. Yeh strategies price movements ko track karne, entry aur exit points decide karne, aur risk management ko optimize karne mein madad deti hain. Indicators ke sath sahi analysis aur practice traders ko market ki better understanding aur successful trading decisions achieve karne mein madad karte hain.

        **Conclusion:**

        Price action indicators trading ka ek essential component hain jo market ke real-time trends aur movements ko analyze karte hain. Inka use karke traders market ki better prediction aur effective trading strategies develop kar sakte hain. Candlestick patterns, support and resistance levels, aur trend lines ka analysis karke, aap apne trading decisions ko enhance kar sakte hain aur market ke fluctuations se faida utha sakte hain.
        • #5 Collapse

          **Price Action Indicators** ek trading strategy hai jo market price movements ko analyze karne aur trading decisions lene mein madad karti hai. Yeh indicators market ki real-time behavior ko track karte hain aur kisi bhi technical tool ke bina price movements ka signal provide karte hain. Niche diye gaye points mein Price Action Indicators ka kaam karne ka tareeqa aur unki utility ko discuss kiya gaya hai:
          1. **Price Action Indicators ka Taaruf:**
          - **Definition**: Price Action Indicators market ke price movements aur trends ko analyze karte hain bina kisi lagging indicators ke. Yeh directly price data ko observe karte hain aur trading signals generate karte hain.
          - **Purpose**: Inka primary purpose market behavior ko samajhna aur timely trading decisions lena hota hai. Yeh traders ko market ki current situation ko assess karne mein madad karte hain.

          2. **Key Types of Price Action Indicators:**
          - **Candlestick Patterns**: Yeh patterns price charts par form hote hain aur market sentiment ko reflect karte hain. Common patterns mein Doji, Hammer, Shooting Star, aur Engulfing Patterns shamil hain.
          - **Support and Resistance Levels**: Yeh levels market ke key price points hain jahan price reverse ya stall hoti hai. Traders in levels ko identify karte hain taake entry aur exit points decide kiye ja sakein.
          - **Trend Lines**: Yeh lines price chart par draw ki jati hain jo market ke trend ko identify karti hain. Uptrend aur downtrend lines market ki direction ko show karti hain.

          3. **Price Action Indicators ka Kaam Karne ka Tareeqa:**
          - **Price Movements Analyze Karna**: Price Action Indicators price charts ko analyze karte hain aur price movements ke patterns ko observe karte hain. Yeh patterns market ke potential reversals aur continuations ko identify karte hain.
          - **Signal Generation**: Candlestick patterns aur trend lines se traders ko trading signals milte hain. For example, ek bullish engulfing pattern ek potential buy signal hota hai, jabke ek bearish engulfing pattern sell signal hota hai.
          - **Market Sentiment**: Yeh indicators market sentiment ko reflect karte hain. Agar price consistently ek trend line ko break kar rahi hai, toh yeh market ke strong trend ya reversal ko indicate kar sakta hai.

          4. **Advantages aur Disadvantages:**
          - **Advantages**:
          - **Real-Time Analysis**: Price Action Indicators real-time price movements ko analyze karte hain, jo traders ko timely decisions lene mein madad karta hai.
          - **Simplicity**: Yeh indicators trading charts ko simplify karte hain aur kisi bhi complex technical tools ki zaroorat nahi hoti.
          - **Disadvantages**:
          - **Subjectivity**: Price Action Analysis subjective ho sakti hai aur different traders ke liye different interpretations ho sakti hain.
          - **False Signals**: Market volatility aur sudden price movements se false signals mil sakte hain, jo trading decisions ko affect kar sakte hain.

          5. **Strategy mein Istemaal:**
          - **Combining with Other Tools**: Price Action Indicators ko dusre technical indicators, jaise ke Moving Averages ya RSI, ke sath combine karke trading signals ko confirm kiya ja sakta hai.
          - **Backtesting**: Trading strategies ko backtest karna zaroori hai taake price action signals ki reliability ko evaluate kiya ja sake.

          **Conclusion:**
          Price Action Indicators Forex trading mein ek powerful tool hain jo market ke real-time price movements aur trends ko analyze karne mein madad karte hain. Yeh indicators candlestick patterns, support and resistance levels, aur trend lines ko use karte hain taake trading decisions ko enhance kiya ja sake. In indicators ka sahi istemaal karke traders market ke behavior ko samajh sakte hain aur effective trading strategies develop kar sakte hain, lekin subjectivity aur false signals ko dhyan mein rakhna zaroori hai.
           
          • #6 Collapse

            Price action indicators kaam karne ka tareeqa trading aur investing mein ek ahem role ada karte hain. Ye indicators trader ko market ki current state aur price movement ko samajhne mein madad dete hain, bina kisi complex indicators ya lagging tools ke. Price action trading ka basic concept yeh hai ke aap market ki price movement ko dekh kar decisions lete hain, instead of relying on traditional technical indicators.
            Jab hum price action indicators ki baat karte hain, to sabse pehle hum candlestick patterns ko samajhte hain. Candlestick patterns price ki movement ko visualise karne ka ek tareeqa hain. Har candlestick ek specific time period ka price action dikhata hai, jisme open, high, low, aur close prices shamil hain. Yeh patterns market ki potential reversals aur continuation trends ko identify karne mein madad karte hain. For example, agar aapko ek strong bullish pattern nazar aata hai, to yeh market ki upward movement ko indicate karta hai.

            Ek aur important concept hai support aur resistance levels. Support wo level hota hai jahan price ne pehle bounce kiya ho aur resistance wo level hota hai jahan price ne pehle stop kiya ho. Yeh levels market ke behavior ko samajhne mein madad karte hain aur traders ko entry aur exit points decide karne mein help karte hain. Jab price support level ke nazdeek hoti hai, to yeh indicate karta hai ke price wahan se upar ja sakti hai. Similarly, jab price resistance level ke nazdeek hoti hai, to yeh indicate karta hai ke price wahan se neeche aa sakti hai.

            Price action indicators mein trend lines bhi shamil hain. Trend lines market ke overall direction ko indicate karte hain. Jab market upar ja rahi hoti hai to trend line upward hoti hai aur jab market neeche aa rahi hoti hai to trend line downward hoti hai. Trend lines ko use karke traders market ke trends ko identify kar sakte hain aur inke basis par trading decisions le sakte hain.

            Ek aur important tool jo price action trading mein use hota hai, wo hai chart patterns. Chart patterns jaise ke head and shoulders, double tops, aur triangles traders ko market ke future movements ke baare mein signals dete hain. Ye patterns historical price data ko analyze karke future price movement ki prediction karte hain. For example, agar ek head and shoulders pattern develop hota hai, to yeh signal de sakta hai ke market ki trend reversal hone wala hai.

            Price action trading ka sabse bara faida yeh hai ke yeh trading decisions ko simple aur direct banata hai. Traders ko complex indicators ya lagging signals ki zaroorat nahi hoti. Instead, woh directly market ki price movements aur patterns ko dekh kar decisions lete hain. Yeh approach traders ko market ki real-time behavior ko samajhne aur effective trading strategies develop karne mein madad karta hai.

            In sab factors ko mila kar, price action indicators ek powerful tool hain jo market ki movements ko samajhne aur trading decisions ko improve karne mein madad karte hain. Agar aap trading mein interested hain to price action indicators ko samajhna aur unka istemal karna aapko market ke dynamics ko better way mein analyze karne mein madad karega.
            • #7 Collapse

              How Price Action Indicators Work in Forex Trading

              Forex trading mein, Price Action Indicators ka use traders ke liye bohot ahem hai, kyunki yeh indicators market ke price movements ka analysis karke trading decisions lene mein madad karte hain. Price action trading ka matlab yeh hota hai ke aap market ki real-time price movements ko samajhne aur analyze karne ki koshish karte hain, bina kisi lagging indicator ke. Yeh approach aapko market ke trends, patterns, aur signals ko direct price ke through identify karne ka moka deti hai.

              Price Action Indicators Kya Hain?

              Price action indicators aise tools hain jo market ke current aur past price movements ko analyze karte hain. In indicators ka use karke traders yeh samajhte hain ke market kis direction mein move karne wala hai, aur accordingly apne trades plan karte hain. Yeh indicators aapko real-time data provide karte hain jo market ke sentiment aur price direction ko reflect karta hai.

              Kuch common price action indicators mein candlestick patterns, trend lines, support and resistance levels, aur chart patterns shamil hain. Yeh indicators aapko market ke bare mein valuable insights dete hain, jo aapko apne trading decisions ko effectively plan karne mein madad karte hain.

              Price Action Indicators Ka Kaam Karne Ka Tarika

              Price action indicators market ke historical price data par based hote hain, aur inka kaam hota hai ke wo future price movements ko predict karne mein traders ki madad karen. Aayiye, kuch key price action indicators aur inke kaam karne ke tareeqe ko detail mein discuss karte hain:
              1. Candlestick Patterns: Candlestick patterns market ke price action ko visually represent karte hain. Har candle market ke opening, closing, high, aur low prices ko show karti hai. Common candlestick patterns, jaise ke doji, engulfing patterns, aur pin bars, traders ko market ke potential reversals ya continuation signals de sakti hain.
                • Example: Agar market mein ek bullish engulfing pattern banta hai, to yeh indicate karta hai ke buyers market mein strong ho rahe hain, aur price upar ja sakti hai.
              2. Support and Resistance Levels: Support aur resistance levels wo points hain jahan price aksar ruk jati hai ya reverse hoti hai. Support level wo price point hota hai jahan demand strong hoti hai aur price niche girna mushkil hota hai. Resistance level wo point hota hai jahan supply strong hoti hai aur price upar jana mushkil hota hai.
                • Example: Agar price ek support level tak pohanchti hai aur phir wahan se bounce back karti hai, to yeh signal ho sakta hai ke price wapas upar move karegi.
              3. Trend Lines: Trend lines ek straight line hoti hai jo market ke high ya low points ko connect karti hai. Yeh line trend ki direction ko indicate karti hai, chahe wo uptrend ho, downtrend ho, ya sideways market.
                • Example: Agar trend line upar ja rahi ho aur price us trend line ke neeche break kare, to yeh signal ho sakta hai ke trend reversal ho raha hai.
              4. Chart Patterns: Chart patterns, jaise ke head and shoulders, double top, double bottom, aur triangles, price action indicators ka important hissa hain. Yeh patterns market ke structure ko represent karte hain aur potential breakouts ya breakdowns ko indicate karte hain.
                • Example: Agar market mein ek double top pattern banta hai, to yeh signal hota hai ke price apne top ko do baar touch kar chuki hai aur ab neeche girne ka chance hai.

              Price Action Indicators Ka Faida

              Price action indicators ke kuch key faide hain jo traders ko market mein better decisions lene mein madad karte hain:
              1. Real-Time Data: Price action indicators aapko market ke real-time data provide karte hain, jo aapko accurate trading decisions lene mein madad karta hai.
              2. Simple and Clear: In indicators ka use karna relatively simple hota hai, kyunki yeh aapko directly market ke price movements ko analyze karne ka moka dete hain.
              3. Versatile: Price action indicators ko kisi bhi market, jaise ke forex, stocks, commodities, ya cryptocurrencies mein use kiya ja sakta hai.
              4. Market Sentiment: Yeh indicators aapko market ke sentiment ko samajhne mein madad karte hain, jo ke trading decisions mein bohot zaroori hota hai.
              Price Action Indicators Ki Limitations

              Jahan price action indicators ka use bohot faidemand hai, wahan inki kuch limitations bhi hain:
              1. Subjectivity: Price action indicators ke interpretation mein subjectivity hoti hai, aur har trader inhe apne tareeke se interpret kar sakta hai.
              2. No Guarantee: Yeh indicators sirf market ke past data par based hote hain, isliye yeh future price movements ki koi guarantee nahi dete.
              3. Requires Experience: In indicators ka sahi use karne ke liye traders ko experience aur market ki deep understanding zaroori hoti hai.
              Conclusion

              Price action indicators forex trading mein ek valuable tool hain jo traders ko market ke real-time price movements ko analyze karne aur better trading decisions lene mein madad karte hain. Yeh indicators aapko market ke sentiment ko samajhne aur upcoming price trends ko predict karne ka moka dete hain. Lekin inhe use karte waqt aapko apni analysis ke sath risk management aur market ke context ka bhi dhyan rakhna chahiye. Agar aap in indicators ko sahi tarike se istemal karte hain, to yeh aapki trading performance ko significantly improve kar sakte hain.
              • #8 Collapse

                **Price Action Indicators Kaam Kaise Karte Hain**
                **1. Introduction:**
                - Price action indicators trading mein market ki price movements ko analyze karne ke liye use hote hain. Yeh indicators price ki history aur past movements ko dekh kar future trends aur market behavior ko predict karte hain.
                - Price action ka maqsad trading decisions ko technical analysis ke bina, sirf price movements aur patterns ke basis par lena hota hai.

                **2. Types of Price Action Indicators:**
                - **Support and Resistance Levels:**
                - **Support:** Yeh wo price level hota hai jahan price ke niche jane par buying interest strong hota hai, aur price wahan se reverse ho sakti hai.
                - **Resistance:** Yeh wo price level hota hai jahan price ke upar jane par selling interest strong hota hai, aur price wahan se reverse ho sakti hai.
                - **Trend Lines:**
                - **Uptrend Line:** Jab price higher highs aur higher lows banati hai, to ek trend line banayi jati hai jo market ke upward trend ko show karti hai.
                - **Downtrend Line:** Jab price lower highs aur lower lows banati hai, to ek trend line banayi jati hai jo market ke downward trend ko show karti hai.
                - **Chart Patterns:**
                - **Head and Shoulders:** Yeh pattern trend reversal ko indicate karta hai aur typically uptrend ke baad bearish reversal ya downtrend ke baad bullish reversal ko show karta hai.
                - **Double Top and Bottom:** Yeh patterns market ke trend reversal ko indicate karte hain, jahan double top bearish reversal aur double bottom bullish reversal ko signal karta hai.

                **3. How Price Action Indicators Work:**
                - **Market Structure Analysis:**
                - Price action indicators market structure ko analyze karte hain jaise support and resistance levels aur trend lines. Yeh levels market ke potential reversal aur continuation points ko identify karte hain.
                - **Pattern Recognition:**
                - Indicators price patterns ko recognize karte hain jo market ke future movements ko predict karne mein madad karte hain. Patterns jaise Head and Shoulders, Double Top, aur Double Bottom market ke direction aur potential reversal points ko signal karte hain.
                - **Price Movements:**
                - Indicators price movements ke basis par signals generate karte hain. Jab price levels aur patterns ko identify kar liya jata hai, to traders market ke potential moves aur trade opportunities ko assess karte hain.

                **4. Trading Strategy:**
                - **Entry Points:**
                - Price action indicators entry points ko identify karne ke liye use kiye jate hain. Jab market support level se bounce hoti hai ya resistance level se break hoti hai, to trading opportunities identify ki jati hain.
                - **Stop-Loss Placement:**
                - Stop-loss ko support aur resistance levels ke basis par place kiya jata hai. Agar price indicator ke identified levels ko cross karti hai, to stop-loss activate hota hai aur potential losses ko minimize karta hai.
                - **Profit Targets:**
                - Profit targets ko price action indicators ke basis par set kiya jata hai. For example, agar market ek pattern ko follow karti hai, to target levels pattern ki height ke basis par set kiye jate hain.

                **5. Advantages of Price Action Indicators:**
                - **No Lagging:**
                - Price action indicators market ke real-time price movements ko track karte hain, isliye yeh lagging nahi hote aur immediate feedback provide karte hain.
                - **Simplicity:**
                - Yeh indicators simple aur easy to understand hote hain. Traders price movements aur patterns ko directly analyze kar sakte hain bina complex calculations ke.

                **6. Limitations:**
                - **Subjectivity:**
                - Price action analysis thoda subjective ho sakta hai, kyunki different traders patterns aur levels ko different tareeqon se interpret karte hain.
                - **False Signals:**
                - Kabhi kabhi, price action indicators false signals bhi generate kar sakte hain, especially choppy market conditions mein. Isliye, additional confirmation tools ka use zaroori hota hai.

                **7. Example Scenario:**
                - **Support and Resistance:** Agar price support level par bounce karti hai aur resistance level ko break karti hai, to trading signal bullish ya bearish trend ke direction ko indicate karta hai.
                - **Trend Lines:** Agar price ek trend line ko break karti hai, to trend reversal ya continuation signal milta hai aur trading decisions iske basis par liye jate hain.

                **8. Conclusion:**
                - Price action indicators trading decisions ko accurate aur timely banane mein madad karte hain. Yeh indicators market ke price movements ko analyze kar ke trading opportunities identify karte hain.
                - Indicators ko effectively use karne ke liye, inhe market conditions aur additional confirmation tools ke sath combine karna zaroori hai.

                Yeh Price Action Indicators ka basic overview tha, jo aapko inhe trading mein use karne aur samajhne mein madad karega.
                 
                • <a href="https://www.instaforex.org/ru/?x=ruforum">InstaForex</a>
                • #9 Collapse

                  **How Price Action Indicators Work**
                  Price action indicators trading ki duniya mein aik bohat hi aham role ada karte hain. Ye indicators market ke price movement ko samajhne mein madad dete hain, taake traders behtareen decisions le sakein. Aaj hum dekhenge ke price action indicators kis tarah kaam karte hain aur inka forex trading mein kaisa istamal hota hai.

                  Sab se pehle, ye samajhna zaroori hai ke price action indicators directly price movement par depend karte hain. Ye indicators kisi bhi extra tools ya complicated calculations ke baghair, seedha price ke upar focus karte hain. Is ka matlab hai ke in indicators ke zariye trader asaan tareeqe se market trends, support, aur resistance levels ko identify kar sakte hain.

                  Price action indicators ki madad se traders market ka overall trend identify kar sakte hain. Aik common example moving averages hain, jo price ke averages ko calculate karke market ka trend batate hain. Agar price moving average se upar ho, to ye bullish trend ka ishara hota hai, jabke agar price moving average se neeche ho, to ye bearish trend ko dikhata hai.

                  Doosra aham aspect jo price action indicators se related hai, wo hai candlestick patterns. Candlestick patterns, price action ka aik behtareen representation hoti hain. Ye patterns market ke emotional state ko bhi reflect karte hain. Misal ke taur par, agar ek bullish engulfing pattern form hota hai, to ye buyers ki strength ka pata deta hai, jabke bearish engulfing pattern sellers ki strength ko highlight karta hai.

                  Price action indicators ke saath, traders ke liye support aur resistance levels ko samajhna bhi asaan ho jata hai. Ye levels wo points hote hain jahan par price aksar ruk jati hai ya wapas mud jati hai. Indicators ki madad se, traders in levels par apni trading strategy ko adjust kar sakte hain.

                  In indicators ka aik aur faida ye hai ke ye traders ko price ki volatility ka bhi andaza dete hain. Price action indicators jese ke Bollinger Bands, price ki volatility ko measure karte hain aur traders ko market ki range ke mutabiq apni trades plan karne mein madad dete hain.

                  Akhir mein, ye kehna bilkul durust hoga ke price action indicators trading mein aik powerful tool hain. Inka sahi istamal kar ke, traders market ke trends ko samajh sakte hain, apni risk management ko behtar kar sakte hain, aur profitable trades execute karne ke liye tayar ho sakte hain. Trading mein successful hone ke liye, price action indicators ko samajhna aur unka sahi istamal karna bohat zaroori hai.

                  اب آن لائن

                  Working...
                  X