Bullish Hammer Candlestick Chart Pattern
X
  • وقت
  • دکھائیں
Clear All
new posts
  • #1 Collapse

    Bullish Hammer Candlestick Chart Pattern
    Introduction:

    forex market mein bullish hammer candlestick chart pattern aik kesam ka single candlestick chart pattern hota hey jo keh forex market mein price kay chart par pay jate hein yeh forex market mein dosree candlestick chart pattern say mokhtalef ho sakte hey kunkeh forexmarket mein es ko single candlestick chart pattern ka turning point ka naam bhe deya jata hey yeeh forex market mein kame kay trend ke taraf eshara deya ja sakta hey
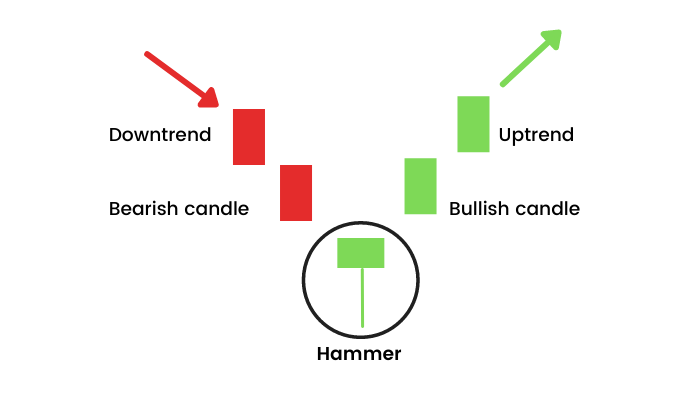
    hammer candlestick pattern ke nechay de gaytaweer es point ko identify karte hey yeh forex market mein dosray candlestick pattern say mokhtalef bhe ho saktay hein hammer pattern bananay kay ley currency pair kay new lows ko identify keya ja sakta hey or forex market mein price ko pehlay wazah tor par sell keya ja sakta hey or new lows bananay kay ley price ka pehlay wazah tor par ezafa karna chihay takeh forex market ke e kamee kay bad price mein wazah ezafa hona chihay jes ke wajah say priceaik chote ce body rakhte hein yeh forx market ke start mein price close hote hey
    Click image for larger version

Name:	trading-the-bullish-hammer-candle_body_2019_05_07_09_38_06_IG_Trading_Platform_Spread_Betting.png
Views:	42
Size:	2.4 کلوبائٹ
ID:	12776536
    es bat ko yad rakhna chihay keh forex market mein hammer candlestick ke body lambai kam say kam double long wick kay sath hona chihay es pattern ke body ke lambai say kam a kam double long wick hona chihay yeh candle stick khod ya to red hote hey ya phir green hote hey jo keh forex market kay reversal trend ko identify kar sakte hey
    zyada tar vullish hammer pattern bearish hanging man candlestick pattern kay sath olajh jata hey hanging man candlestick mein aik chote body hote hey

    Trade with bullish hammer pattern

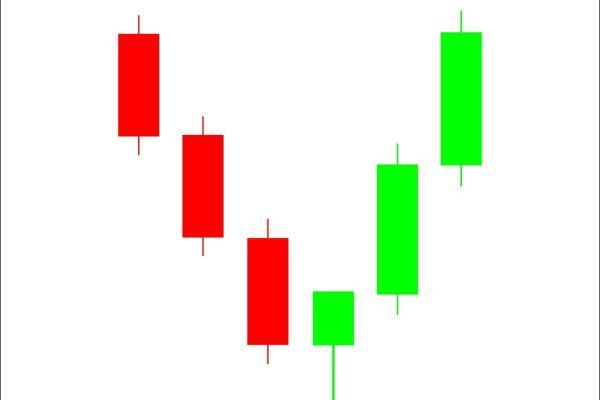
    bullish hammer candlestick pattern mokhtalef kesam kay chart or time frame say mel kar banta hey nechay de gay aik 20 may say 31 April tak ke de gay hey AUD/USD kay chart ke aik mesal de gay hey 31 may tak 892 pips tak ger geya hey forx market mein es kame kay trend ka end aik bullish hammer candlestick kay sath keya geya hey es kay bad price nay ajj kay price action kay zarey say 792 pips ka ezafa kar deya hey
    Click image for larger version

Name:	trading-the-bullish-hammer-candle_body_Bullishhammer.png
Views:	21
Size:	13.2 کلوبائٹ
ID:	12776537
    chonkeh hammer candlestick pattern aik strong candlestick pattern hota hey jo keh forex market mein es ke jagah par depend karta hey forex trader es ko dosray indicator kay sath estamal kar sakta hey Fibonacci retracement kay sath bhe estamal kar saktay hein hammer candlestick pattern support level mei ghos jay ge buy kay jazbat ke body kay oper close ho jay ge buy kay aik new chance kay sath e kay bad support kay nechay stop loss set kartay hein takeh reversal janay say account safe rah sakay
    دیتے جائیںThanksحوصلہ افزائی کے لیے
  • <a href="https://www.instaforex.org/ru/?x=ruforum">InstaForex</a>
  • #2 Collapse

    Assalamu Alaikum Dosto!
    Hammer (Bullish) Candlestick Pattern


    Hammer candlestick pattern aik bullish reversal pattern hai jo aik lambay downtrend ke baad aata hai. Hammer trading strategy mein kamiyabi market context, candlestick ki location, doosri tasdeeqat aur market momentum par depend karti hai. Agar aap aik mazboot hammer candlestick trade karte hain, to nuksan ho sakta hai. Hammer trading strategies swing aur day trading dono mein istemal hoti hain. Is pattern ki sab se bara kami yeh hai ke yeh aksar aik intraday bearish trend ki retracement dikhata hai, reversal ki bajaye. Agar aap forex, stocks ya cryptocurrency trader hain, to hamesha mazboot money management rules ko follow karen aur hammer istemal karte waqt doosre indicators ka bhi istemal karen. Market context ko samajhna aik behtareen trading strategy banane ke liye ahem hai. Yaad rahe, bohot saare candlestick patterns hain, hamesha woh choose karen jo aapke liye sab se zyada munasib hai.
    Hammer candlestick pattern traders ke liye aik popular candlestick pattern hai jo securities ke price action ko samajhne mein istemal hota hai. Aksar price action traders is candlestick ko reliable price reversal points pehchanne ke liye istemal karte hain. Iske alawa, yeh candlestick sab financial markets mein acha kaam karta hai, jaise forex, stocks, indices, aur cryptocurrencies.
    Financial market mein trading karne ke liye technical aur fundamental analysis ke bare mein buhat zyada ilm ki zarurat hoti hai. Asal approach price action analysis par base kar ke price direction ko pehchanne ka hai. Agar yeh sahi tarah se kiya jaye, to traders paise kamayenge. Lekin price direction pehchanne ke liye complex analysis aur trading tools jaise candlesticks, price patterns, aur trend recognition ka istemal hota hai.
    Hammer aik bullish reversal pattern hai jo lambay bearish trend ke baad aata hai. Iska jism chota hota hai aur lambi lower shadow hoti hai. Yeh aik price pattern hai jisme opening aur closing prices qareeb qareeb hoti hain, is se dikhata hai ke bears active ho gaye hain lekin price ko opening level ke qareeb bandhne mein kamiyab rahe hain.


    Candle ki Pehchan


    Hammer candlestick pattern market supply aur demand ke baray mein aik kahani dikhata hai, jo candlestick ki shakal dekhte hue aasani se samjhi ja sakti hai. Aik lambi lower shadow yeh dikhata hai ke sellers ne price ko nicha le jaya hai, lekin unhon ne naye low par isay rukne mein kamiyab nahi rahe. Bad mein, buyers ne price ko low se lekar daily opening level ke qareeb le gaye hain. Aam taur par, hammer price ke decline hone ke baad aata hai.
    Jab hammer candlestick pattern aata hai, to yeh signal de sakta hai ke aane wale reversal ya market sentiment badalne wala hai. Lekin, hammer pattern ke baad price ko momentum dikhana bhi zaroori hai. hammer ke signal ko strong banane ke do shara'it hain:
    1. Long downtrend ke baad, sellers ke nakam rehne aur buyers ke random jagah se aane ke signal hammer candlestick se zyada reliable hain. Yeh dikhate hain ke price pehle se kaafi tareeqe se move ho chuka hai, aur ab isay upar correction karna chahiye. Lekin downside pressure aap ke trade ke time frame par depend karta hai. Daily chart ke liye, har quarter ya monthly closing price reversal ka time hota hai. Iske alawa, fundamental releases ki wajah se price action change ho sakta hai. Intraday chart ke liye trading session ahem hoti hai, kyun ke institutional traders sirf kuch khaas trading session mein active rehte hain.
    2. Uske baad, yeh zaroori hai ke price ke closing price ko samjha jaye. Agar closing price opening price ke upar hai, to hammer price ko upar jane ki zyada possibility hoti hai. Isi tarah, agar inverted hammer ka upside lamba shadow hai, to yeh strong bullish reversal pattern ka kaam karta hai.


    Hammer pattern aik single candlestick pattern hota hai jo chota jism rakhta hai. Hammer candlestick ke jism ka rang ya to:
    1. Green(bullish) hota hai, jahan candle ki closing price opening price se zyada hoti hai,
    2. Ye red (bearish) hota hai, jahan candle ki closing price opening price se kam hoti hai.


    Candlestick ke rang ka bohot zyada asar nahi hota kyun ke hammer candlestick pattern hamesha bullish signal dikhata hai chunanche candle ka jism ka rang kuch bhi ho.
    Hammer candlestick ka core event lower shadow mein hota hai. Isi liye candlestick ki success rate is par depend karti hai ke wick kitni lambi hai, candle ke jism ke mukable mein. Aam taur par, acha hammer pattern ka wick apne jism se do guna lamba hota hai, jabke ziada length price ki exhaustion ko dikhati hai aur buy karne ki possibility badh jati hai.


    Hammer Candle ki Shap


    Hammer candlestick ek single candlestick hai jiska real body small hoti hai aur lambi shadow hoti hai. Bearish wick sellers ki rejection ko darust karta hai, lekin trader ke liye mazeed tafseel jan'ne ki zarurat hoti hai. Is liye dekhte hain ke hammer candlestick ke andar kya hai:


    Bullish Hammer Candlestick


    Bullish hammer tab banta hai jab closing price opening price se zyada hoti hai, is se dikhata hai ke candle close hone se pehle buyers market mein mazboot ho gaye hain. Bullish hammer ki success rate closing price aur wick ki lambai par depend karti hai. Ziada lambi wick, jab closing price opening price se upar hoti hai, to yeh sab se sahi trade provide karti hai.


    Hammer aur Hanging Man Mein Farq


    Hammer aur hanging man mein buhat si mushabihat hoti hain jo traders ko confuse kar sakti hain. In dono patterns mein taqreeban wohi shakal hoti hai. In dono patterns mein farq ka asal tareeqa peechlay trend ke reference mein hota hai. Hammer pattern aik lambay downtrend ke baad banta hai aur yeh dikhata hai ke selling pressure kam ho rahi hai aur buyers market mein daakhil ho rahe hain. Yeh sentiment hai jo niche lambi wick ko paida karta hai. Isi liye hammer bullish signal deta hai, khaas kar agar yeh support ke qareeb aata hai.
    Hanging man hammer ki copy hai, lekin yeh aik lambay uptrend ke baad aata hai. Hanging man pattern tab banta hai jab prices pehle kam hokar phir mazeed barhte hain. Ek uptrend ke baad yeh price action dikhata hai ke buyers ki momentum kam ho rahi hai aur sellers trade mein shamil ho rahe hain. Isi liye hanging man bearish signal hai, khaas kar agar yeh resistance level ke qareeb aata hai.


    Hammer aur Inverted Hammer Mein Farq


    Hammer pattern ke ek aur rishtedaar hai, inverted hammer. Dono formations bullish single-candle patterns hain, aur price ki ummed hai ke in ke banne ke baad price upar jaega. In dono mein farq unki shakal mein hota hai. Is ke naam se hi samjha ja sakta hai, inverted hammer hammer ki ulta shakal rakhta hai. Inverted hammer mein price pehle upar jaati hai, lekin phir woh jaldi wapis niche jaati hai. Single candle formation ke closing price opening price ke qareeb hoti hai. Candle ka jism (laal ya hara) pattern analysis mein koi ahmiyat nahi rakhta. Dono patterns ek downtrend ke baad nikalte hain, aur signal mazeed mazboot hota hai agar formation support ke qareeb banti hai.


    Hammer aur Inverted Hammer Mein Farq


    Hammer aur Shooting Star Pattern Mein Farq
    Shooting star aik aur Japanese single candlestick pattern hai jo inverted hammer ki tarah dikhne mein hoti hai. Hammer aur shooting star mein kuch mukhtalif farq hain. Shooting star ki wick candle ke jism ki upper side se nikalti hai. Is formation ko aik tara se taaron se gira hua sitara kehte hain. Aik aur baat, hammer aik downtrend ke end par banta hai, jabke shooting star aik uptrend ke end par banta hai. Isi liye hammer bullish candlestick pattern hai, jabke shooting star bearish formation hai.

    Trading


    Traders ko hammer pattern ke practical istemal ko samajhna chahiye, sath hi doosre indicators ke sath profit kamane ke liye. Aap hammer candlestick ko aik trading strategy banane ke liye primary element ke taur par istemal kar sakte hain. Lekin iski accuracy tabhi confirm ho sakti hai jab isay doosre technical indicators aur technical analysis tools ke sath istemal kiya jaye.
    1. Top-Bottom Strategy with Hammer: Global financial market cycles market trends ko paida karte hain aur badalte hain. Aksar important top-bottom strong fundamental news se hotay hain, lekin cryptocurrency bhi global economic condition, regulation conflict, crypto acceptance, aur dosri cheezen par depend karti hai. Is strategy ka pehla shart yeh hai ke aapko ek strong downtrend ko pehchanne ki zarurat hai jo tamam near-term lows ko break kar chuka hai.
      Jab price ek new low bana leti hai, to yeh dikhata hai ke aane wala bullish pressure ka pehla sign aaya hai ek indecision candle ke roop mein. Bad mein, bears price ko nicha le jane ki koshish karte hain lekin nakam rehte hain aur price ko bullish hammer ke sath close karte hain. Is trading strategy ke liye ideal entry ek buy stop order hai hammer ke high price ke upar, sath hi stop loss ko shadow ke nichay rakha jata hai buffer ke sath. Upar di gayi tasveer mein, trade aik bearish pin bar resistance level par dikhne par 1:3.57 R:R ke sath band hota hai.
    2. Support-Resistance Trading: Support aur resistance levels price ke liye aik barrier ka kaam karte hain, aur jab price in levels ko break karta hai, to price movement mein significant hoti hai. Lekin, financial market ek rubber band ki tarah move hoti hai jo support aur resistance ko bas itna hi todegi ke kisi ahem news se chain toot jaye.
      Isi liye hum price action ka istemal price direction ko define karne ke liye karenge, aur trade karte waqt bullish trend ko confirm karne ke liye hammer candlestick ko additional confirmation ke taur par istemal karenge.
    3. Intraday Trading with Moving Average: Yeh approach seedha aur highly profitable hota hai agar price aik trend ke andar hai. Sab se pehle, hume yeh identify karna hoga ke overall market trend bullish hai. Koi bhi bearish correction sellers ke profit taking ko dikhata hai, uske baad buying pressure dobara shuru ho sakti hai.
      Upar ki tasveer dikhata hai ke price dynamic 20 EMA ke roop mein minor support ki tarah kaam kar rahi hai. Is context mein, overall price direction bullish hai, aur dynamic 20 EMA se rejection hone par buying possibility hoti hai.
      Buy position hammer candlestick ke high se valid hoti hai, jahan stop loss shadow ke niche aur kuch buffer ke sath rakha jata hai. Upar di gayi tasveer mein, trade ek pin bar resistance level par dikhne par 1:2 R:R ke sath band hota hai.


    Hammer Candlestick ke Pros aur Cons


    Har candlestick ke kuch strengths aur weaknesses hote hain. Koi bhi trading tool kisi ko 100% profit guarantee nahi kar sakta. Hammer aik single candlestick pattern hai jo apni validity confirm karne ke liye additional confirmation ki zarurat hoti hai. Chaliye iske pros aur cons dekhte hain.


    Pros
    • Hammer pattern sab financial markets, including forex, cryptocurrencies, stocks, aur indices mein reliable price trend dikhane mein madadgar ho sakta hai.
    • Hammer price action tools jaise moving average, support resistance aur trend direction ke sath perfect taur par kam karta hai.
    • Traders hammer ko trend continuation aur reversal pattern dono ke taur par istemal kar sakte hain.
    • Long bearish trend ke baad, hammer ko strong market reversal dikhane ke zyada chances hote hain.
    • Hammer ka jism ya to laal ho sakta hai ya hara, jisse reversal spot karna aasan ho jata hai.


    Cons
    • Agar long bearish trend ke baad bhi candlestick appear hota hai, to price niche ja sakta hai.
    • Traders hammer ke liye strong price direction hasil karne ke liye sirf hammer par rely nahi kar sakte.


    Limitations


    Hammer candlestick profitable indicator hai, lekin iske kuch limitations hain jo trader ko iska istemal karne se pehle pata honi chahiye. Hammer candlestick dikhata hai ke buyers ne ek asset ko ek new low banane ke baad wapas le liya hai. Lekin buyers ke strength din ke end par sellers ka retracement bhi ho sakta hai. Upar di gayi tasveer mein dekhi jaa sakti hai.
    Yahan pe ek bada sell candle dikh raha hai, uske baad price upar ja rahi hai sath hi correction bhi ho rahi hai. Isi liye hammer trading strategy ka istemal karte waqt retracement ke speed ko monitor karna zaroori hai. Agar tezi se recovery hoti hai, to yeh reversal ka sign hai, jabke correction agli din par aur sell pressure lay sakti hai.
    Hammer candlestick ki placement bhi ahem hai. Agar aap price action trader hain aur chart mein har hammer pattern se buy trade karna chahte hain, to aap galat faislay le sakte hain. Hammer tabhi mazboot hota hai jab woh trend ke bottom par paya jata hai. Lekin bottom ko dhundna aasan kaam nahi hai. Aap price chart dekh kar isay spot kar sakte hain. Isi ke alawa, aap RSI ya stochastic oscillator jaise doosre indicators ka istemal kar sakte hain. Agar yeh indicators hammer ko support karte hain, to aap uske signal ko reliable samajh sakte hain.
    • #3 Collapse

      "Bullish Hammer Candlestick Chart Pattern" ek technical analysis tool hai jo stock market ya forex trading mein istemal hota hai. Yeh ek bullish reversal pattern hai jo indicate karta hai ke market ka trend neeche se upar ki taraf badalne wala hai.

      Bullish Hammer candlestick pattern ek single candlestick se banta hai jo typically neeche se shuru hokar upar ki taraf jaata hai. Is pattern ka main feature hai ek chhota sa body aur lamba tail (shadow) neeche ki taraf. Iska appearance ek hammer ki tarah hota hai, jisse iska naam "hammer" pada.

      Hammer pattern dekhne par traders ko ek bullish reversal ka signal milta hai. Jab market down trend mein hota hai aur ek hammer pattern form hota hai, toh yeh indicate karta hai ke sellers ke dominance kamzor ho raha hai aur buyers ka strength increase ho raha hai. Iska matlab hai ke market ka trend neeche se upar ki taraf badal sakta hai.

      Ek perfect bullish hammer pattern ko identify karne ke liye kuch criteria hote hain: Hammer ki body chhoti honi chahiye aur ideally buyers ke control mein honi chahiye. Iska matlab hai ke body ka close price open price se upar hona chahiye. Lamba tail (shadow) neeche ki taraf extend hona chahiye aur ideally body ka 2-3 guna lamba hona chahiye. Hammer pattern ke formation ke baad, traders ko market ki confirmation ke liye kuch aur indicators ka bhi istemal karna chahiye jaise ki volume analysis ya aur technical indicators.

      Bullish hammer pattern ke formation ke baad, traders usually ek long position enter karte hain ya existing short positions ko cover karte hain. Stop loss levels ko set karke risk management ka bhi dhyan rakhte hain. Yeh pattern sirf ek tool hai trading decision ke liye, isliye traders ko dusre factors jaise ki market context, trend direction, aur other technical indicators ka bhi dhyan rakhna important hai.

      Is tarah se, bullish hammer candlestick chart pattern ek powerful tool hai jo traders ko market mein potential bullish reversals ko identify karne mein madad karta hai. Lekin, yeh ek accurate prediction tool nahi hai aur iska istemal karne se pehle proper analysis aur risk management ki zarurat hoti hai.

      Click image for larger version

Name:	bullish.png
Views:	25
Size:	114.4 کلوبائٹ
ID:	12906309
      • <a href="https://www.instaforex.org/ru/?x=ruforum">InstaForex</a>
      • #4 Collapse


        Bullish hammer candlestick chart pattern, yaqeenan ek aham technical analysis ka hissa hai jo kay traders ko market ke uptrend ya reversal ka pata lagane mein madad karta hai. Yeh pattern ek candlestick formation hai jo kay market ke trend ka signal deti hai, khaaskar jab market downtrend mein ho aur trend change hone ka chance ho. Chaliye, ham is pattern ke mutaliq thori gehri samajh hasil karte hain.

        Mukhtasar Tareeqa:
        1. Hammer ki pehchan: Bullish hammer candlestick pattern ek single candlestick formation hoti hai jo kay market ke neeche jaane ke baad ek potential reversal point ko darust karti hai. Iski pehchan lambi lower wick aur chhoti body se hoti hai. Lower wick body se zyada lambi hoti hai aur upper wick ki wajah se yeh ek hammer ki shakal banati hai.
        2. Lower Wick ki Ahmiyat: Bullish hammer ki pehchaan ka sab se ahem hissa lower wick hai. Lower wick ka lambai hona darust hai, jo ki candle ki body se kafi zyada lambi hoti hai. Yeh dikhata hai ke market ne neeche jaane ke baad bhi buyers control mein hain aur price ko neeche se upar le jaane ka irada hai.
        3. Body ki Lambai: Bullish hammer ki body chhoti hoti hai aur isay ideally upper end par hoti hai. Body ki lambai kam hoti hai, jo ke indicate karta hai ke price opening par tha lekin phir buyers ne control le liya aur price ko upar le gaye.
        4. Volume ki Tafseel: Ek aur important aspect volume ka hota hai. Agar hammer pattern ke sath high volume hai, toh yeh uski confirmation hai ke traders ne reversal ko support kiya hai.

        Bullish Hammer ka Matlab:

        Bullish hammer candlestick pattern ka matlab hota hai ke market ka trend change hone ka chance hai. Agar yeh pattern sahi jagah par dikhayi deta hai, toh traders ko long positions lena chahiye kyunki yeh ek potential uptrend ka signal deta hai.

        Key Points:
        1. Confirmatory Signals: Bullish hammer pattern ko confirm karne ke liye, traders ko doosri technical indicators aur patterns ko bhi madde nazar rakhna chahiye. Jaise ke trend lines, moving averages aur doji patterns.
        2. Stop Loss aur Target: Trading karne se pehle, stop loss aur target levels tay karna zaroori hai. Stop loss neeche wali side par set kiya jaata hai taki nuksan se bacha ja sake aur target upar ki taraf rakha jaata hai taki profit ho sake.
        3. Market Conditions: Bullish hammer pattern ko samajhne ke liye market ki overall conditions ko bhi dekha jaana chahiye. Agar market overall downtrend mein hai toh hammer pattern ka significance zyada hota hai.
        4. Risk Management: Trading mein risk management ka hona bohot zaroori hai. Ziyada se ziyada trading capital ka 1-2% risk karne ka tajwez diya jaata hai taake nuksan se bacha ja sake.

        Final Words:

        Bullish hammer candlestick pattern ek powerful tool hai jo traders ko market ke potential reversals ka pata lagane mein madad karta hai. Lekin, isay istemal karne se pehle traders ko proper research aur analysis karna chahiye. Iske ilawa, risk management aur confirmatory signals ko bhi madde nazar rakhna zaroori hai taake successful trading kiya ja sake.


        اب آن لائن

        Working...
        X