# Gartley Pattern Kya Hai?
Gartley pattern ek technical analysis ka tool hai jo trading aur financial markets mein istemal hota hai. Ye pattern pehli dafa H.M. Gartley ke zariye 1935 mein describe kiya gaya tha. Is pattern ka asal maqsad price movements ko samajhna aur unhein predict karna hai, taake traders entry aur exit points ka sahi andaza laga saken.
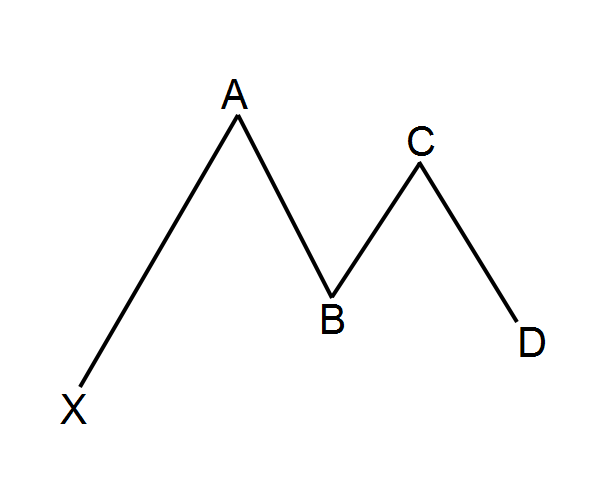
Gartley pattern ek harmonic pattern hai, jo do price swings ke darmiyan create hota hai. Is pattern ki pehchan karne ke liye, traders ko kuch specific price points dekhne hote hain, jo A, B, C, aur D points kehlate hain. Ye points is tarah se arrange hote hain:
1. **Point A**: Ye pattern ka starting point hota hai. Ye point kisi upward swing ka high hota hai.
2. **Point B**: Ye point A se downward move ke baad banta hai, jahan price kuch had tak gira hota hai.
3. **Point C**: Ye point B ke baad price ka upward movement hota hai, lekin ye A se high nahi hota.
4. **Point D**: Ye point C ke baad price ka downward movement hota hai, jo point A ke nicha nahi jaata.
Gartley pattern ko samajhne ke liye, kuch ratios ka bhi khayal rakhna hota hai. In ratios mein se kuch important hain:
- **AB to XA**: Is ratio ka hona chahiye 61.8%
- **BC to AB**: Is ratio ka hona chahiye 38.2% ya 88.6%
- **CD to XA**: Is ratio ka hona chahiye 78.6%
In ratios ko dekh kar, traders ye samajhte hain ke market kis tarah se move karegi. Agar price points in ratios ke mutabiq hoti hain, to ye Gartley pattern confirm hota hai.
Gartley pattern ko pehchanne ka ek faida ye hai ke ye market ke reversal points ko indicate karta hai. Iska matlab ye hai ke jab price pattern D point tak pahuncha, to wahan se market ek reversal ka signal de sakti hai. Is wajah se traders is pattern ka istemal kar ke profitable trades kar sakte hain.
Is pattern ki trading strategy bhi kaafi straightforward hai. Jab price D point tak pahuncha, to traders ko yahan buy ya sell order place karne ka sochna chahiye, depending on market condition. Agar price D point par reversal hota hai, to traders isko apni position banane ka mauqa samajhte hain.
Lekin, Gartley pattern ko trade karte waqt kuch cheezen dhyan mein rakhni chahiye. Pehli baat ye hai ke kisi bhi technical pattern ko 100% reliable nahi maana ja sakta. Isliye stop-loss orders ka istemal karna zaroori hai, taake kisi bhi unforeseen market movement se bach sakein.
Aakhir mein, Gartley pattern ek useful tool hai jo traders ko market ki direction samajhne mein madad karta hai. Lekin, isko sirf ek technical indicator ki tarah nahi dekhna chahiye, balke iske sath-sath fundamental analysis aur market sentiments ka bhi khayal rakhna chahiye. Is tarah se, traders apne decisions ko behtar bana sakte hain aur profitable trades karne ki chances ko badha sakte hain.


تبصرہ
Расширенный режим Обычный режим