Explanation of Envelope indicator kai hy
1. Muqadma: Introduction Envelope Indicator ek technical analysis ka tool hai jo market trends aur price movements ko samajhne mein madad karta hai. Yeh indicator price chart par upper aur lower bands create karta hai jo price ke around ek boundary banati hain. Is article mein hum Envelope Indicator ke tajaweezat, uske istemal ka tareeqa, aur iske fawaid par roman Urdu mein guftagu karenge.
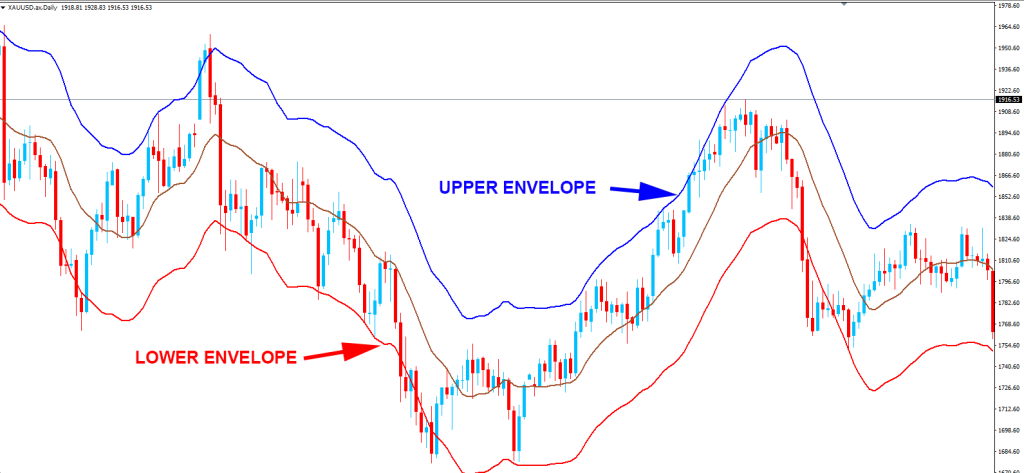
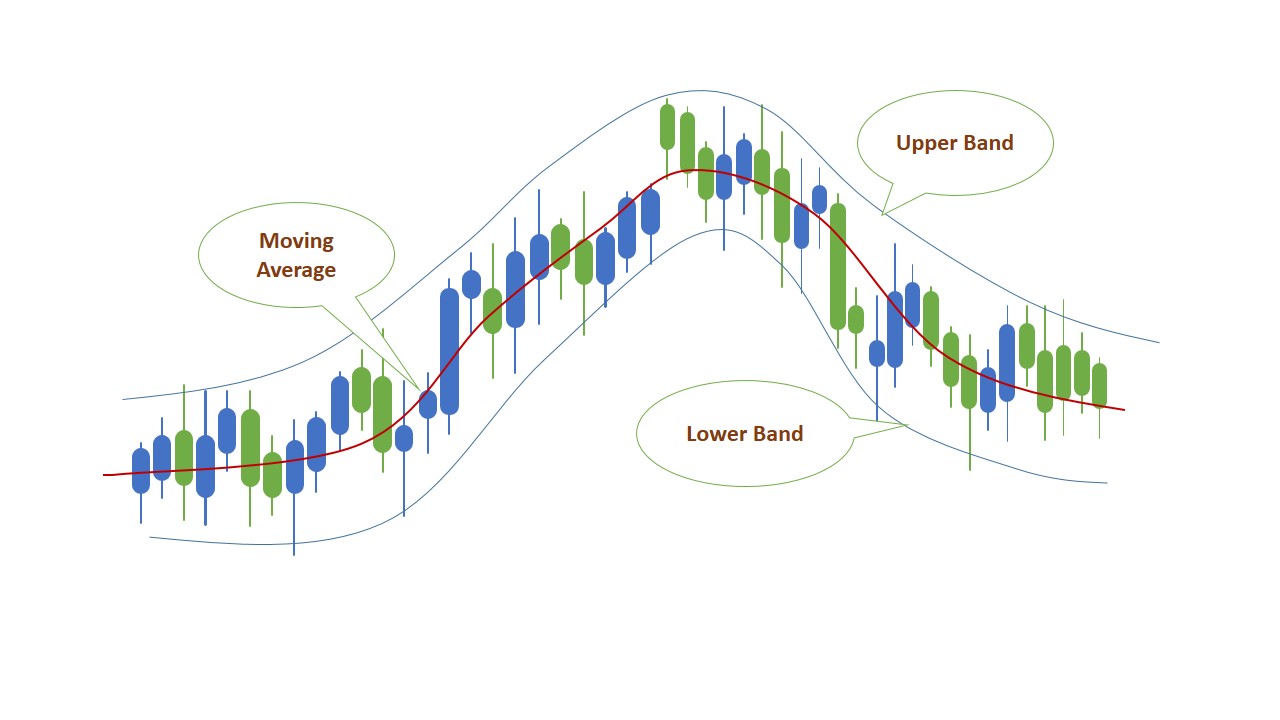
2. Envelope Indicator Ki Tafseelat: 2.1 Upper aur Lower Bands: Envelope Indicator mein aam taur par do lines hoti hain - ek upper band aur doosri lower band. Yeh bands price chart ke aas paas draw ki jati hain aur inki madad se traders price ke potential trends ko identify kar sakte hain.
2.2 Moving Averages Ka Istemal: Upper aur lower bands ko create karne ke liye Envelope Indicator moving averages ka istemal karta hai. Traders isme commonly istemal hone wale moving averages, jese ke simple moving averages (SMA) ya exponential moving averages (EMA), ka istemal karte hain.
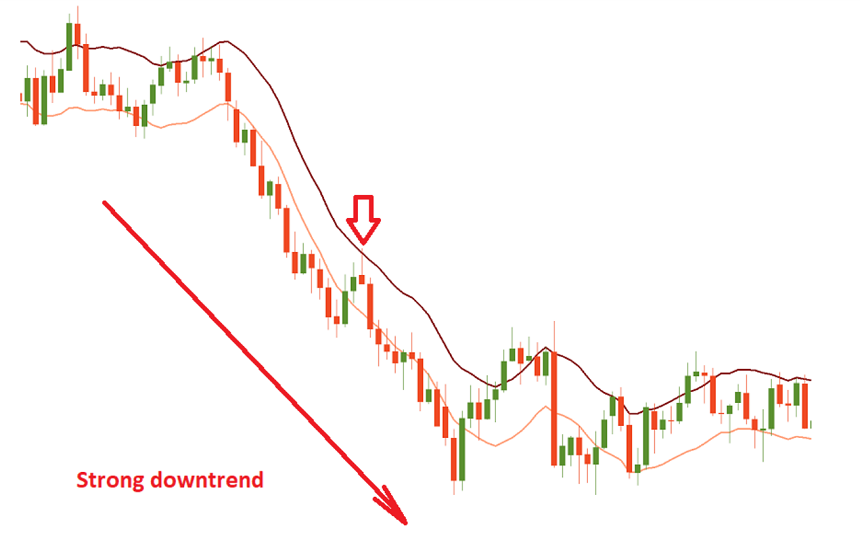
3. Envelope Indicator Ka Istemal: 3.1 Trend Identification: Envelope Indicator ka ek maqsad trend identification hai. Jab price upper band ko touch karta hai, toh yeh indicate karta hai ke market mein strong uptrend ho sakti hai. Jab price lower band ko touch karta hai, toh yeh indicate karta hai ke market mein strong downtrend ho sakti hai.
3.2 Overbought ya Oversold Conditions: Jab price upper band ke qareeb hoti hai, toh market overbought conditions mein ho sakti hai, aur jab price lower band ke qareeb hoti hai, toh market oversold conditions mein ho sakti hai. Yeh traders ko potential reversals ke liye alert karta hai.
4. Envelope Indicator Aur Volatility: 4.1 Price Volatility Ka Pata Lagana: Envelope Indicator price volatility ko measure karta hai. Jab bands wide hote hain, toh yeh indicate karta hai ke market mein zyada volatility hai. Jab bands narrow hote hain, toh yeh indicate karta hai ke market mein kam volatility hai.
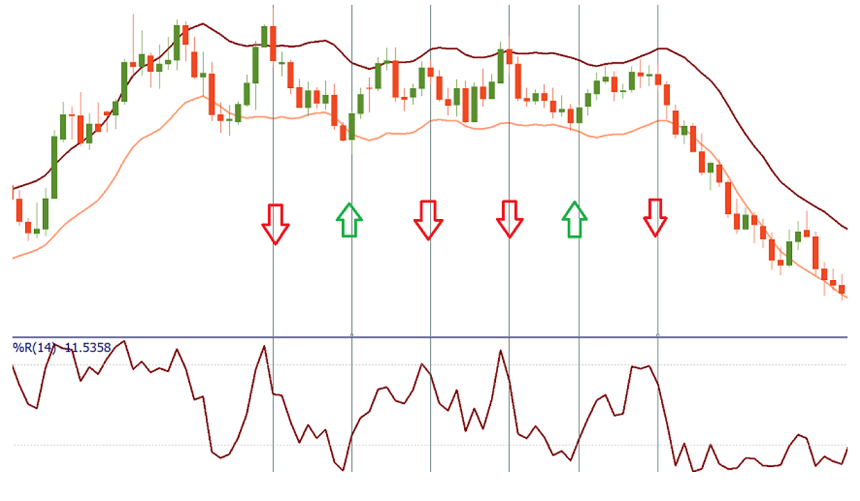
4.2 Trading Ranges Ko Samajhna: Volatility ki measurement Envelope Indicator traders ko trading ranges samajhne mein madad karta hai. Jab bands ke darmiyan chhoti range hoti hai, toh yeh indicate karta hai ke market mein sideways movement ho rahi hai.
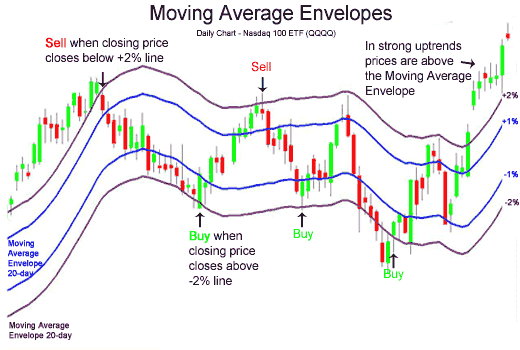
5. Envelope Indicator Ka Istemal: 5.1 Trading Signals: Traders Envelope Indicator ka istemal karke trading signals generate kar sakte hain. Jab price upper band ko touch karta hai, toh yeh sell signal ban sakta hai. Jab price lower band ko touch karta hai, toh yeh buy signal ban sakta hai.
5.2 Trend Reversals Ka Pata Lagana: Jab price upper band ya lower band ko cross karti hai, toh yeh trend reversal ka indication ho sakta hai. Traders ko alert rehna chahiye ke kahin market trend change na ho raha ho.
6. Envelope Indicator Ke Nuksan: 6.1 False Signals: Jese ke kisi bhi technical indicator mein, Envelope Indicator bhi false signals generate kar sakta hai. Isliye, traders ko doosre confirmatory indicators ka istemal karna chahiye.
6.2 Lagging Nature: Envelope Indicator ka ek nuksan yeh hai ke yeh lagging nature ka hota hai. Iski readings mein changes thoda sa waqt leti hain, jisse ke kuch traders ko entry aur exit points mei der ho sakti hai.
7. Ikhtitami Guftagu: Envelope Indicator ek powerful tool hai jo market trends, volatility, aur potential reversals ko samajhne mein madad karta hai. Lekin, iska istemal karte waqt, traders ko doosre confirmatory indicators ka bhi istemal karna chahiye aur false signals se bachne ke liye cautious rehna chahiye.

تبصرہ
Расширенный режим Обычный режим