Explanation of Envelope indicator?
X
  • وقت
  • دکھائیں
Clear All
new posts
  • #16 Collapse

    Explanation of Envelope indicator kai hy

    Click image for larger version

Name:	download (24).jpeg
Views:	35
Size:	13.8 کلوبائٹ
ID:	12851951


    1. Muqadma: Introduction Envelope Indicator ek technical analysis ka tool hai jo market trends aur price movements ko samajhne mein madad karta hai. Yeh indicator price chart par upper aur lower bands create karta hai jo price ke around ek boundary banati hain. Is article mein hum Envelope Indicator ke tajaweezat, uske istemal ka tareeqa, aur iske fawaid par roman Urdu mein guftagu karenge.

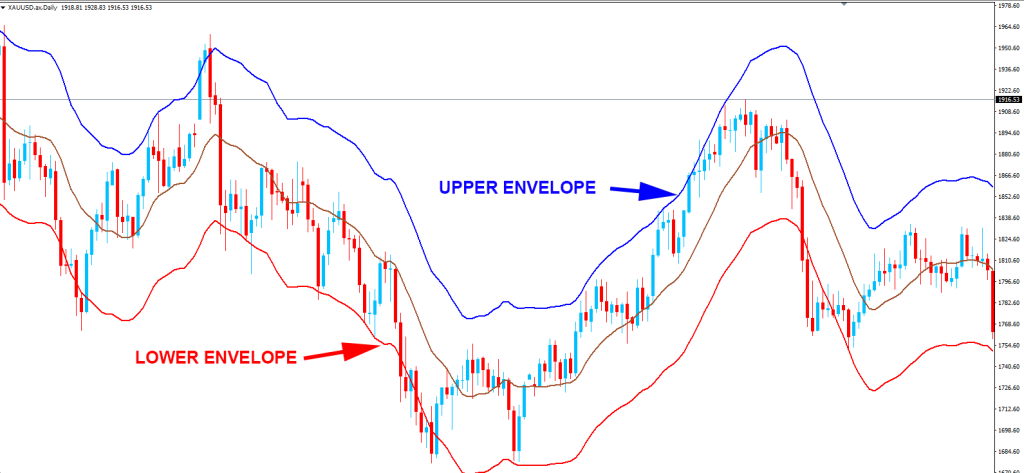
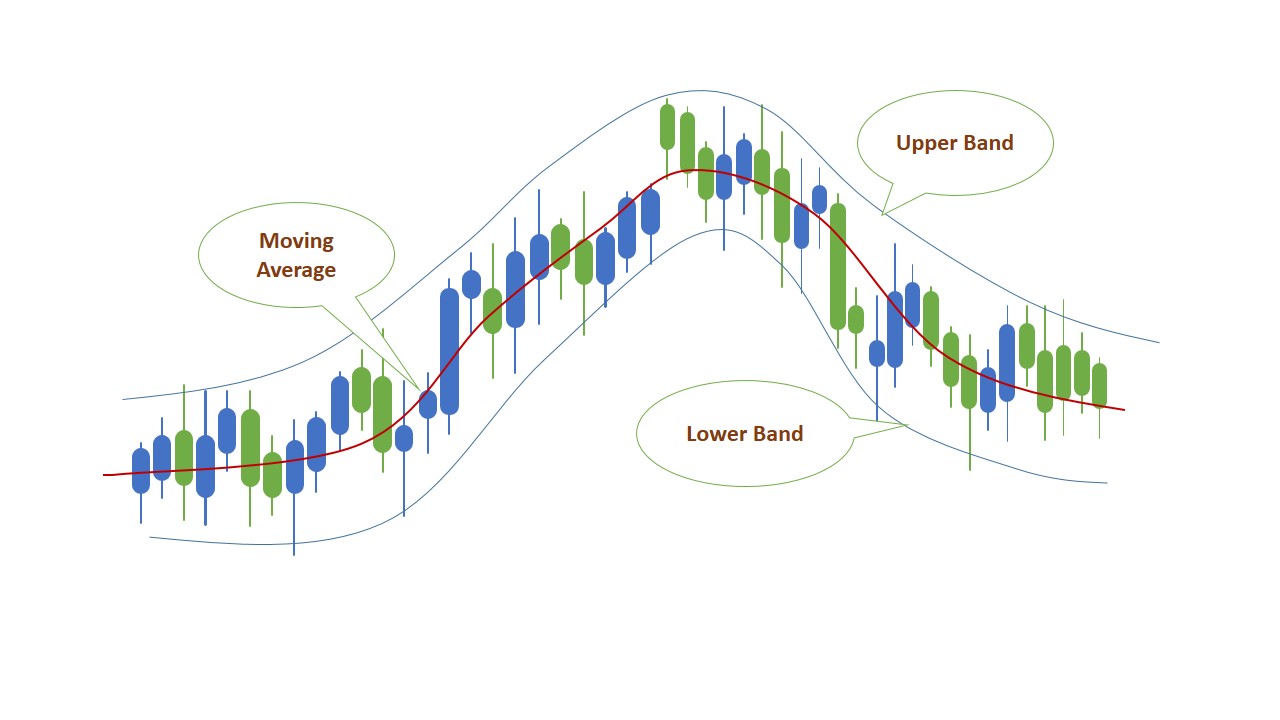
    2. Envelope Indicator Ki Tafseelat: 2.1 Upper aur Lower Bands: Envelope Indicator mein aam taur par do lines hoti hain - ek upper band aur doosri lower band. Yeh bands price chart ke aas paas draw ki jati hain aur inki madad se traders price ke potential trends ko identify kar sakte hain.

    2.2 Moving Averages Ka Istemal: Upper aur lower bands ko create karne ke liye Envelope Indicator moving averages ka istemal karta hai. Traders isme commonly istemal hone wale moving averages, jese ke simple moving averages (SMA) ya exponential moving averages (EMA), ka istemal karte hain.

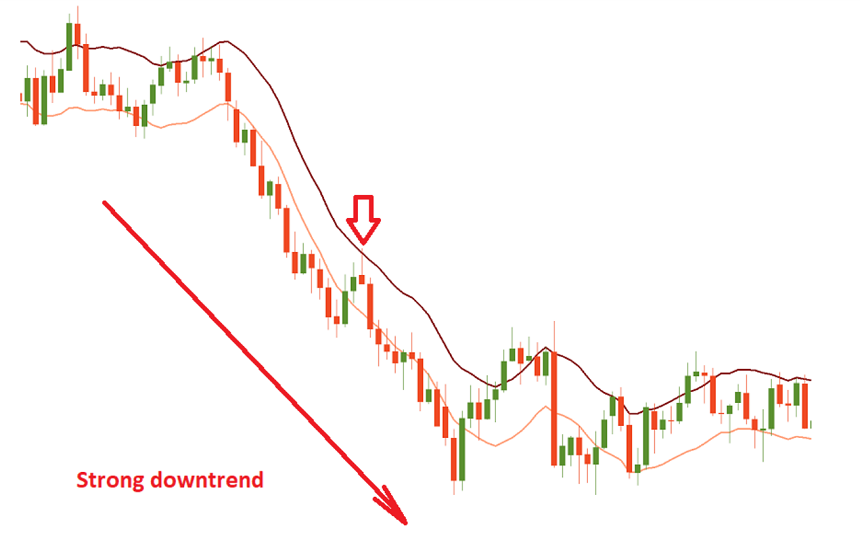
    3. Envelope Indicator Ka Istemal: 3.1 Trend Identification: Envelope Indicator ka ek maqsad trend identification hai. Jab price upper band ko touch karta hai, toh yeh indicate karta hai ke market mein strong uptrend ho sakti hai. Jab price lower band ko touch karta hai, toh yeh indicate karta hai ke market mein strong downtrend ho sakti hai.

    3.2 Overbought ya Oversold Conditions: Jab price upper band ke qareeb hoti hai, toh market overbought conditions mein ho sakti hai, aur jab price lower band ke qareeb hoti hai, toh market oversold conditions mein ho sakti hai. Yeh traders ko potential reversals ke liye alert karta hai.

    4. Envelope Indicator Aur Volatility: 4.1 Price Volatility Ka Pata Lagana: Envelope Indicator price volatility ko measure karta hai. Jab bands wide hote hain, toh yeh indicate karta hai ke market mein zyada volatility hai. Jab bands narrow hote hain, toh yeh indicate karta hai ke market mein kam volatility hai.

    4.2 Trading Ranges Ko Samajhna: Volatility ki measurement Envelope Indicator traders ko trading ranges samajhne mein madad karta hai. Jab bands ke darmiyan chhoti range hoti hai, toh yeh indicate karta hai ke market mein sideways movement ho rahi hai.

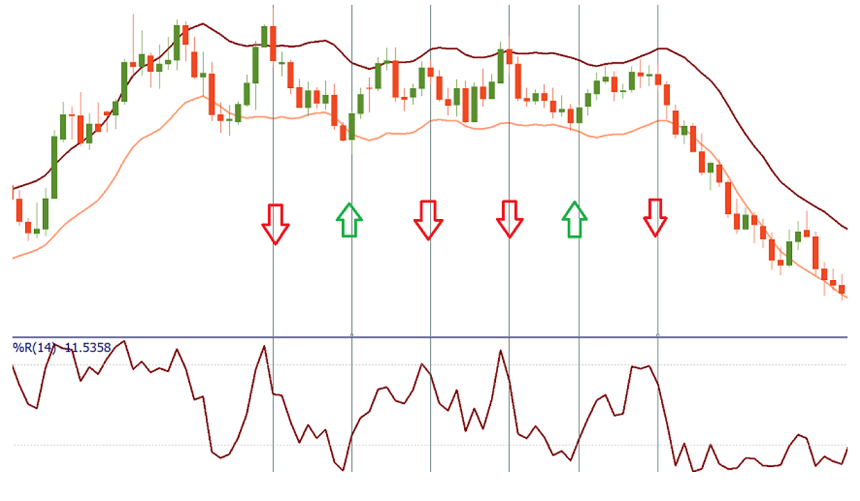
    5. Envelope Indicator Ka Istemal: 5.1 Trading Signals: Traders Envelope Indicator ka istemal karke trading signals generate kar sakte hain. Jab price upper band ko touch karta hai, toh yeh sell signal ban sakta hai. Jab price lower band ko touch karta hai, toh yeh buy signal ban sakta hai.

    5.2 Trend Reversals Ka Pata Lagana: Jab price upper band ya lower band ko cross karti hai, toh yeh trend reversal ka indication ho sakta hai. Traders ko alert rehna chahiye ke kahin market trend change na ho raha ho.

    6. Envelope Indicator Ke Nuksan: 6.1 False Signals: Jese ke kisi bhi technical indicator mein, Envelope Indicator bhi false signals generate kar sakta hai. Isliye, traders ko doosre confirmatory indicators ka istemal karna chahiye.

    6.2 Lagging Nature: Envelope Indicator ka ek nuksan yeh hai ke yeh lagging nature ka hota hai. Iski readings mein changes thoda sa waqt leti hain, jisse ke kuch traders ko entry aur exit points mei der ho sakti hai.

    7. Ikhtitami Guftagu: Envelope Indicator ek powerful tool hai jo market trends, volatility, aur potential reversals ko samajhne mein madad karta hai. Lekin, iska istemal karte waqt, traders ko doosre confirmatory indicators ka bhi istemal karna chahiye aur false signals se bachne ke liye cautious rehna chahiye.


    • <a href="https://www.instaforex.org/ru/?x=ruforum">InstaForex</a>
    • #17 Collapse


      Envelope Indicator: Share Market Mein Ek Ahem Technical Tool

      Envelope Indicator ek ahem technical analysis tool hai jo share market ke traders aur investors ke liye eham hota hai. Ye indicator trend analysis mein istemal hota hai aur price ke movement ko darust karta hai. Is article mein hum Envelope Indicator ke bare mein maloomat faraham karenge aur ye kis tarah se kaam karta hai.

      Envelope Indicator Kya Hai?

      Envelope Indicator ek technical analysis tool hai jo price ke movement ko track karta hai. Ye indicator kuch lines ya bands ko price ke chart ke around plot karta hai. In bands ko "envelopes" kaha jata hai. Envelopes price ke chaaracteristics aur volatility ko darust karte hain.

      Kis Tarah Se Envelope Indicator Kaam Karta Hai?

      Envelope Indicator kaam karne ke liye, trader ko pehle ek sma ya simple moving average calculate karna hota hai. Is moving average ko usually price ke kuch specific time periods ke liye calculate kiya jata hai. Phir, trader ko is moving average ke around kuch bands create karne hote hain. Ye bands usually fixed percentage ya standard deviation ke base par hoti hain. Upper band moving average ke ooper hoti hai jabki lower band uske neeche hoti hai.

      Envelope Indicator Ka Matlab Kya Hai?

      Envelope Indicator ka use price ke direction aur volatility ko samajhne mein hota hai. Upper band price ke potential resistance level ko represent karta hai jabki lower band support level ko indicate karta hai. Jab price upper band ko touch karta hai, ye indicate karta hai ke price overbought ho sakta hai aur ek reversal ki sambhavna hai. Jab price lower band ko touch karta hai, ye indicate karta hai ke price oversold ho sakta hai aur ek reversal ki sambhavna hai.


      Envelope Indicator ek mukhtasar lekin powerful technical analysis tool hai jo traders ko market ke trends aur price movements ke bare mein maloomat faraham karta hai. Is indicator ko samajhna aur istemal karna zaroori hai agar aap share market mein safalta hasil karna chahte hain. Lekin yaad rahe ke sirf Envelope Indicator kaafi nahi hota hai, dusre technical aur fundamental factors ko bhi madde nazar rakhte hue trading ki decision leni chahiye.

      • #18 Collapse

        What is Envelope Indicators in forex trading.

        Assa;am o Alaikum Dear Friends and Fellows Envelope Indicator forex trading me istemaal hone wala aik technical analysis tool hy jis ki madad se potential support aur resistance levels ka pata lagaya jata hy aur agli market movements ki prediction karta hy. Is me aam taur par 2 lines hoti hy jo centerline ke upar aur neechy plot ki jati hy, jo ke aksar price ki moving average hoti hy. Uper wali line ko upper envelope kehty hein, jabke neechy wali line ko lower envelope kehty hein. Envelopes ka maqsad price volatility ko visual representation banana aur potential buying aur selling opportunities ko highlight karna hota hy. Envelope Indicator volatility bands ke concept par based hy. Upper aur lower envelopes ke beech ki doori ko measure kar ke traders price volatility ka level determine kar sakty hein. Jab price upper envelope ke qareeb hoti hy, to ye indicates karta hy ke market overbought hy aur aik reversal ya correction ho sakta hy. Ulta, jab price lower envelope ke qareeb hoti hy, to ye show karta hy ke market oversold hy aur potential buying opportunity ho sakti hy.

        Important of envelope indicators in forex trading.

        Friends Envelope Indicator market me price trends ko analyze karny aur potential entry/exit points ko identify karny ke liye istemal hota hy. Is indicator ke upper and lower bands price ke variations ko represent karte hein. Jab price upper band ko touch karta hy, yeh indicate kar sakta hy ke market overbought ho sakta hy aur price ka reversal hona mumkin hy. Jab price lower band ko touch karta hy, yeh oversold conditions ya price ka potential reversal signal de sakta hy. Traders is indicator ki madad se trend direction ko samajhty hein aur market entry ya exit points tay karty hein. Is ke saath sahi risk management ke saath, ye indicator trading strategies ko improve karny me helpful ho sakta hy.


        What are the limitations of envelopes.
        • Dear fellows baki sb indicators ki trha envelopes ki bhi kch limitations hein.
        • Baz okat esa ho skta ha k price envelopes ki range ko break kr jati ha ksi bhi side main sell ya buy or ap es k signal py trade lety hein laikin price ap k mukhalif simt mn jati ha.
        • es chz se bachny k lye apko chahye k envelopes k sth sth koe or indicator bhi istmal karen or sth sth price action ko use kr k rejection ya breakout ki confirmation k bad trade len.


        • #19 Collapse

          Explanation of Envelope indicator kai hy


          Envelope Indicator (اینولوپ انڈیکیٹر) - Roman Urdu:

          Envelope Indicator ek technical analysis tool hai jo market trends aur volatility ko evaluate karne mein madad karta hai. Ye indicator price chart par upper aur lower bands banata hai, jinhe "envelopes" kehte hain, aur in bands ke andar aur bahar hone par trading signals generate hote hain.

          Tafseelat:
          • Calculation: Envelope Indicator typically Moving Averages ka istemal karta hai. Isme ek central line hoti hai jo Moving Average hoti hai, aur iske dono taraf specific percentage se deviated lines hote hain, jo upper aur lower bands ko form karte hain.
          • Upper aur Lower Bands: Upper band, central line se upar hoti hai aur lower band central line se neeche hoti hai. Ye bands volatility aur price movements ko darust taur par capture karne mein madad karte hain.
          • Percentage Deviation: Traders apne preference ke mutabiq percentage deviation tay karte hain jo upper aur lower bands ke liye istemal hoti hai. Commonly istemal hone wale percentages 1% se lekar 3% tak hote hain.

          Interpretation:
          • Agar price upper band ko cross karta hai, to ye ek potential buy signal ho sakta hai.
          • Agar price lower band ko cross karta hai, to ye ek potential sell signal ho sakta hai.
          • Bands ke andar hone par market mein consolidation ya range-bound trading indicate hota hai.

          Trading Strategy:
          • Traders Envelope Indicator ko trend confirmation ke liye istemal karte hain. Agar price upper band ke neeche jaata hai, toh ye downtrend ko confirm karta hai aur vice versa.
          • Bands ke cross hone par traders entry aur exit points tay karte hain.
          • Divergence analysis aur doosre technical indicators ke saath combine karke traders aur confirmation hasil karte hain.

          Zaroori Hidayat:
          • Hamesha current market conditions, trend strength, aur overall market analysis ko mad-e-nazar rakhein.
          • Envelope Indicator ko standalone signal ke taur par istemal karna hamesha cautious trading aur risk management ke saath hona chahiye.

          Conclusion: Envelope Indicator market trends aur volatility ka analysis karne mein madad karta hai. Lekin, jaise har ek technical indicator, iska istemal thorough market analysis aur doosre confirmatory signals ke saath karna important hai.


          • #20 Collapse

            Envelope Indicator (انولپ انڈیکیٹر)

            Envelope Indicator ek technical analysis tool hai jo market trends aur volatility ko evaluate karne mein madad karta hai. Ye indicator price chart par upper aur lower bands banata hai, jinhe "envelopes" kehte hain, aur in bands ke andar aur bahar hone par trading signals generate hote hain.

            Tafseelat:
            • Calculation: Envelope Indicator typically Moving Averages ka istemal karta hai. Isme ek central line hoti hai jo Moving Average hoti hai, aur iske dono taraf specific percentage se deviated lines hote hain, jo upper aur lower bands ko form karte hain.
            • Upper aur Lower Bands: Upper band, central line se upar hoti hai aur lower band central line se neeche hoti hai. Ye bands volatility aur price movements ko darust taur par capture karne mein madad karte hain.
            • Percentage Deviation: Traders apne preference ke mutabiq percentage deviation tay karte hain jo upper aur lower bands ke liye istemal hoti hai. Commonly istemal hone wale percentages 1% se lekar 3% tak hote hain.

            Interpretation:
            • Agar price upper band ko cross karta hai, to ye ek potential buy signal ho sakta hai.
            • Agar price lower band ko cross karta hai, to ye ek potential sell signal ho sakta hai.
            • Bands ke andar hone par market mein consolidation ya range-bound trading indicate hota hai.

            Trading Strategy:
            • Traders Envelope Indicator ko trend confirmation ke liye istemal karte hain. Agar price upper band ke neeche jaata hai, toh ye downtrend ko confirm karta hai aur vice versa.
            • Bands ke cross hone par traders entry aur exit points tay karte hain.
            • Divergence analysis aur doosre technical indicators ke saath combine karke traders aur confirmation hasil karte hain.

            Zaroori Hidayat:
            • Hamesha current market conditions, trend strength, aur overall market analysis ko mad-e-nazar rakhein.
            • Envelope Indicator ko standalone signal ke taur par istemal karna hamesha cautious trading aur risk management ke saath hona chahiye.

            Conclusion: Envelope Indicator market trends aur volatility ka analysis karne mein madad karta hai. Lekin, jaise har ek technical indicator, iska istemal thorough market analysis aur doosre confirmatory signals ke saath karna important hai.
            • #21 Collapse

              Envelope Indicator Ka Tafseeli Tazkira:

              Envelope indicator ek technical analysis tool hai jo ke maali market mein, jese ke Forex, mein istemal hota hai taake kisi cheez ke qeemat mein izafay ya kamiyon ko pehchanne mein madad kare. Yeh do parallel lines se bana hota hai jo ke qeemat ke chart ke upar aur neeche banate hain, aur isay "envelope" kehte hain. Yeh lines aksar kisi asset ki qeemat ke moving average ke ek muqarrib percentage doori par banai jati hain.

              Yahan Envelope indicator ke ahem hisson aur iske istemal ki logic ka tazkira hai:
              1. Moving Average (MA):
                • Envelope indicator aksar asset ki qeemat ke moving average par istemal hota hai. Aam taur par isme simple moving average (SMA) ya exponential moving average (EMA) shamil hoti hai.
                • Moving average envelope ke liye bunyad ka kaam karta hai jo ke kisi khaas muddat ke dauran ki gayi asset ki qeemat ka average darust karta hai.
              2. Upper Envelope Line:
                • Yeh line moving average ke ooper banai jati hai aur isme moving average se muqarrib percentage ka izafa darust karta hai.
                • Traders aam taur par ek muqarrib percentage ka istemal karte hain, jese ke 1% ya 2%.
              3. Lower Envelope Line:
                • Isi tarah, lower line moving average ke neeche banai jati hai aur isme moving average se muqarrib percentage ka kami darust karta hai.
                • Upper aur lower lines ke darmiyan ki doori symmetric hoti hai, percentage farq ko qaim rakhne wali.

              Envelope Indicator Ki Tabeer:
              • Overbought aur Oversold Shorat:
                • Jab qeemat upper envelope line ko chhoo jaati hai ya isse guzar jati hai, to yeh ishara ho sakta hai ke asset overbought hai, jo ke aik mawafiq ya correction ka ishara ho sakta hai.
                • Ulta, jab qeemat lower envelope line ko chhoo jaati hai ya isse neeche gir jaati hai, to yeh ishara ho sakta hai ke asset oversold hai, jo ke aik muqabalay ki taraf ishara kar sakta hai.
              • Trend Ka Pata Lagana:
                • Envelope indicator traders ko mojooda trend ka pata lagane mein madadgar ho sakta hai. Agar qeemat envelope ke andar hi rehti hai, to yeh darust karta hai ke aik mustaqil aur mazboot trend hai.
                • Envelope ke hudood se bahar nikalne wale situations trend mein tabdeeli ka ishara kar sakte hain.
              • Volatility Ka Napna:
                • Envelope ki chaurai (upper aur lower lines ke darmiyan ki doori) ko volatiliti ka measure samjha ja sakta hai. Agar envelope zyada wide hai to yeh zyada volatiliti ko darust karta hai, jabke narrow envelope kam volatiliti ko darust karta hai.

              Traders ko chahiye ke Envelope indicator ko doosre technical analysis tools ke saath istemal karen aur mukhtalif market shorat ko madde nazar rakhen. Ek indicator par pura bharosa na karen, balki trading faislay mein risk management strategies ko shamil karen.


              • #22 Collapse

                Slippage Kya Hai?

                Slippage ek common phenomenon hai jo ke trading mein hota hai. Jab traders ek trade execute karte hain, to wo expected price se different price par execute ho sakta hai. Yeh difference expected price aur actual execution price ke darmiyan hota hai aur isko slippage kehte hain. Slippage usually volatile market conditions mein hota hai jab order execution mein delay hota hai.

                2. Slippage Ki Wajohat:

                Slippage ki kuch ahem wajohat shamil hain:
                • Market Volatility
                • : Zayada volatile market conditions mein slippage hone ke chances zyada hote hain kyun ke price mein sudden jumps aur fluctuations hoti hain.
                • Low Liquidity:
                • Kam liquidity wale market mein bhi slippage hota hai kyun ke orders ko execute karne ke liye kam available buyers aur sellers hote hain.
                • Order Size
                • : Bade orders execute karne mein bhi slippage hota hai kyun ke large orders ko execute karna time aur price ke liye challenging ho sakta hai.
                • Order Type
                • :Market orders ko execute karne mein zyada slippage hota hai compared to limit orders, kyun ke market orders ko immediate execution ki zaroorat hoti hai.
                • Broker Execution:
                • Broker ke execution speed aur efficiency bhi slippage par asar dalta hai. Agar broker ki execution quality achi nahi hai, to slippage ka zyada chance hota hai.

                3. Slippage Ke Nuqsaan:

                Slippage ka nuqsan traders ke liye ho sakta hai kyun ke wo expected price se different price par trade execute hota hai. Is se traders ka profit kam ho sakta hai ya loss barh sakta hai. Agar market mein zyada volatility hai to slippage ke chances zyada hote hain aur traders ko expected results se alag results milte hain.

                4. Slippage Se Bachne Ke Tareeqay:

                Traders slippage se bachne ke liye kuch tareeqay apna sakte hain:
                • Use Limit Orders:
                • Limit orders istemal karke traders slippage ko minimize kar sakte hain kyun ke limit orders mein traders specify karte hain ke wo trade sirf specific price par hi execute hona chahte hain.
                • Avoid Volatile Times:
                • Zyada volatile market conditions mein trading karne se bachna chahiye takay slippage ka risk kam ho.
                • Choose Reliable Brokers:
                • Reliable brokers choose karke jo ke efficient order execution provide karte hain, traders slippage se bach sakte hain.
                • Risk Management:
                • Traders ko apne trades ke liye proper risk management strategies develop karna chahiye takay slippage ka nuqsan minimize kiya ja sake.

                5. Slippage Ka Istemal:

                Slippage ko samajhna aur uske sath tajwezati strategies develop karna traders ke liye zaroori hai. Slippage ka istemal karke traders apne trading strategies ko improve kar sakte hain aur market ke volatile conditions mein bhi successful ho sakte hain.

                In conclusion, slippage ek common phenomenon hai jo ke trading mein hota hai aur traders ke liye nuqsaan bhi pesh karta hai. Slippage se bachne ke liye traders ko proper risk management strategies develop karna zaroori hai aur reliable brokers choose karna chahiye. Slippage ko samajh kar traders apne trading performance ko improve kar sakte hain aur market ke volatile conditions mein bhi successful ho sakte hain.
                 
                • #23 Collapse

                  Envelope Indicator:

                  Envelope indicator ek technical analysis tool hai jo keemaat ke around ek band banata hai, jisse ke traders ke liye keemaat ka trend aur volatility ka andaza lagaya ja sakta hai. Envelope indicator forex trading mein ek ahem tool hai jo keemaat ke trends aur trading range ko samajhne mein madad deta hai.
                  Click image for larger version

Name:	MA-ENVELOPES-1024x474.png
Views:	23
Size:	77.6 کلوبائٹ
ID:	12853045
                  Work Procedure:

                  Ye indicator usually price ke around ek upper aur lower band banata hai, jinhe "envelopes" kehte hain. Price jab bhi envelopes ke andar ya bahar jata hai, woh trend change ka signal ho sakta hai.

                  Upper and Lower Bands:

                  Upper band usually price ka ek moving average plus uska ek percentage upar hota hai. Lower band bhi ek moving average plus uska ek percentage neeche hota hai. In bands ke darmiyaan ki distance volatility ko represent karta hai.

                  Interpretation:
                  Click image for larger version

Name:	Envelope-1024x473.png
Views:	25
Size:	85.5 کلوبائٹ
ID:	12853046
                  Jab price upper band se bahar nikalta hai, yeh bullish signal ho sakta hai, aur jab price lower band se bahar nikalta hai, yeh bearish signal ho sakta hai. Lekin, sirf band ke bahar nikalna hi signal nahi hai, aur traders ko aur confirmatory indicators ka istemal karna chahiye.

                  Uses:

                  Traders ise trend ki direction aur volatility ka andaza lagane ke liye istemal karte hain. Ye ek part of a complete trading strategy hota hai aur doosre indicators aur analysis ke saath istemal hota hai.
                  Click image for larger version

Name:	fIvlS64B_mid.png
Views:	26
Size:	62.0 کلوبائٹ
ID:	12853047
                  Conclusion:

                  Envelope indicator ek powerful tool hai forex trading mein trend aur volatility ka analysis karne ke liye. Lekin, iska istemal karne se pehle traders ko proper training aur experience lena chahiye.

                  • #24 Collapse

                    Envelope Indicator


                    Definition And Purpose:

                    Assa;am o Alaikum Dear Friends and Fellows Envelope Indicator forex trading me istemaal hone wala aik technical analysis tool hy jis ki madad se potential support aur resistance levels ka pata lagaya jata hy aur agli market movements ki prediction karta hy. Is me aam taur par 2 lines hoti hy jo centerline ke upar aur neechy plot ki jati hy, jo ke aksar price ki moving average hoti hy. Uper wali line ko upper envelope kehty hein, jabke neechy wali line ko lower envelope kehty hein. Envelopes ka maqsad price volatility ko visual representation banana aur potential buying aur selling opportunities ko highlight karna hota hy. Envelope Indicator volatility bands ke concept par based hy. Upper aur lower envelopes ke beech ki doori ko measure kar ke traders price volatility ka level determine kar sakty hein. Jab price upper envelope ke qareeb hoti hy, to ye indicates karta hy ke market overbought hy aur aik reversal ya correction ho sakta hy. Ulta, jab price lower envelope ke qareeb hoti hy, to ye show karta hy ke market oversold hy aur potential buying opportunity ho sakti hy.

                    Envelope indicator ka istemal,

                    Friends Envelope Indicator market me price trends ko analyze karny aur potential entry/exit points ko identify karny ke liye istemal hota hy. Is indicator ke upper and lower bands price ke variations ko represent karte hein. Jab price upper band ko touch karta hy, yeh indicate kar sakta hy ke market overbought ho sakta hy aur price ka reversal hona mumkin hy. Jab price lower band ko touch karta hy, yeh oversold conditions ya price ka potential reversal signal de sakta hy. Traders is indicator ki madad se trend direction ko samajhty hein aur market entry ya exit points tay karty hein. Is ke saath sahi risk management ke saath, ye indicator trading strategies ko improve karny me helpful ho sakta hy.

                    What are the limitations of envelopes?
                    • Dear fellows baki sb indicators ki trha envelopes ki bhi kch limitations hein.
                    • Baz okat esa ho skta ha k price envelopes ki range ko break kr jati ha ksi bhi side main sell ya buy or ap es k signal py trade lety hein laikin price ap k mukhalif simt mn jati ha.
                    • es chz se bachny k lye apko chahye k envelopes k sth sth koe or indicator bhi istmal karen or sth sth price action ko use kr k rejection ya breakout ki confirmation k bad trade len.


                    • #25 Collapse

                      **Envelope Indicator Ki Wazahat**
                      Envelope Indicator ek popular technical analysis tool hai jo traders ko market ki volatility aur price trends ko analyze karne mein madad karta hai. Yeh indicator price ke fluctuations ke andar ek envelope ya boundary create karta hai, jo traders ko potential buying aur selling signals provide karta hai. Is post mein, hum Envelope Indicator ke features, calculation, aur trading implications ko detail se samjhenge.

                      **Envelope Indicator Kya Hai?**

                      Envelope Indicator ek trend-following aur volatility indicator hai jo price chart par do parallel lines ya envelopes draw karta hai. Yeh envelopes price ke moving average ke upar aur neeche hoti hain, aur market ke fluctuations ko capture karti hain. Envelopes ka width market ki volatility ko represent karta hai aur trading signals generate karne mein madad karta hai.

                      **Calculation Aur Features:**

                      1. **Moving Average**: Envelope Indicator ka calculation moving average ke around hota hai. Typically, simple moving average (SMA) use kiya jata hai, lekin exponential moving average (EMA) bhi use kiya ja sakta hai. Moving average ki period ko trader apne analysis ke according set kar sakta hai.

                      2. **Envelope Lines**: Moving average ke upar aur neeche parallel lines draw ki jati hain. Yeh lines generally ek fixed percentage (jaise 1% ya 2%) ke distance par moving average se set hoti hain. Yeh percentage market ki volatility ko reflect karta hai aur envelopes ki width ko determine karta hai.

                      3. **Volatility Indicator**: Envelope Indicator market ki volatility ko measure karta hai. Jab market volatility increase hoti hai, to envelopes ke beech ka distance bhi barhta hai, aur jab volatility decrease hoti hai, to envelopes ke beech ka distance kam hota hai.

                      **Trading Signals:**

                      1. **Price Touching Envelope Lines**: Jab price envelope ke upper line ko touch karti hai ya usse break karti hai, to yeh overbought condition ko indicate karta hai aur potential selling signal hota hai. Similarly, jab price envelope ke lower line ko touch karti hai ya break karti hai, to yeh oversold condition ko indicate karta hai aur potential buying signal hota hai.

                      2. **Price Reversals**: Price envelope lines ke touch ya break ke baad agar market reversal dikhata hai, to yeh trading signal ko confirm karta hai. Traders is signal ko trade entry aur exit points ke liye use kar sakte hain.

                      **Limitations:**

                      1. **Lagging Indicator**: Envelope Indicator moving average ke basis par hota hai, jo ek lagging indicator hai. Iska matlab hai ke yeh price movements ke changes ko thoda late detect karta hai aur early signals ko miss kar sakta hai.

                      2. **False Signals**: Envelope Indicator ke signals kabhi kabhi false signals bhi de sakte hain, especially in ranging markets. Envelopes ke upar aur neeche price touches ke baad price movement expected direction mein nahi ja sakti.

                      **Conclusion:**

                      Envelope Indicator ek useful tool hai jo traders ko market ki volatility aur trends ko analyze karne mein madad karta hai. Moving average ke around draw kiye gaye envelopes price ke fluctuations ko capture karte hain aur trading signals generate karte hain. Price envelopes ke touch aur break points potential buying aur selling signals ko indicate karte hain. Lekin, Envelope Indicator ke limitations ko dhyan mein rakhte hue, isse trading decisions mein combined analysis aur confirmation signals ke sath use karna behtar hota hai. Accurate understanding aur strategic use ke sath, traders Envelope Indicator ka maximum benefit le sakte hain aur market trends ko effectively analyze kar sakte hain.
                      • <a href="https://www.instaforex.org/ru/?x=ruforum">InstaForex</a>
                      • #26 Collapse

                        ### Envelope Indicator ki Tafseel
                        Envelope Indicator ek trading tool hai jo market ki volatility aur price movement ko analyse karne mein madad karta hai. Ye indicator trading charts pe ek upper aur ek lower band ke form mein nazar aata hai. In bands ke beech mein price ka movement hota hai, jo traders ko market ke overbought ya oversold conditions ko samajhne mein madad karta hai.

                        Envelope Indicator ko calculate karne ke liye, traders usually ek moving average ka use karte hain, jise percentage ya fixed distance se adjust kiya jata hai. Yeh upper aur lower bands moving average ke around set kiye jate hain, jo price ki fluctuations ko capture karte hain.

                        **Envelope Indicator ka Calculation:**
                        1. **Moving Average Calculation:** Pehle, aap ek moving average calculate karte hain, jo kisi bhi period ka ho sakta hai, jaise 20-day ya 50-day moving average.
                        2. **Envelope Bands Calculation:** Phir, moving average ke upar aur neeche ek fixed percentage ya distance add kiya jata hai. Example ke taur par, agar aapka moving average 100 hai aur envelope ki width 2% hai, to upper band 102 aur lower band 98 hoga.

                        **Envelope Indicator ki Usage:**
                        1. **Trend Analysis:** Agar price upper band ko touch karti hai, to market overbought ho sakta hai, aur agar price lower band ko touch karti hai, to market oversold ho sakta hai. Yeh signals trend reversal ya continuation ki hint dete hain.
                        2. **Entry and Exit Points:** Traders in bands ko use karke entry aur exit points identify karte hain. Agar price upper band ke paas hai, to selling opportunities dekhte hain, aur agar price lower band ke paas hai, to buying opportunities identify karte hain.
                        3. **Volatility Measurement:** Envelopes market ki volatility ko measure karne ke liye bhi use kiye jate hain. Jab bands ka distance badhta hai, to market ki volatility badh rahi hoti hai, aur jab distance kam hota hai, to market ki volatility kam hoti hai.

                        **Envelope Indicator ki Limitations:**
                        1. **Lagging Indicator:** Envelope Indicator ek lagging indicator hai, jo price movements ko follow karta hai. Iska matlab hai ki yeh signals thodi der se aate hain.
                        2. **False Signals:** Kabhi-kabhi, price bands ke paas aane par false signals bhi generate ho sakte hain, jo misleading ho sakte hain.

                        Envelope Indicator ko apne trading strategy mein integrate karte waqt, dusre technical indicators aur fundamental analysis ka bhi istemal karna zaroori hota hai, taake aap comprehensive decision le saken.

                        اب آن لائن

                        Working...
                        X