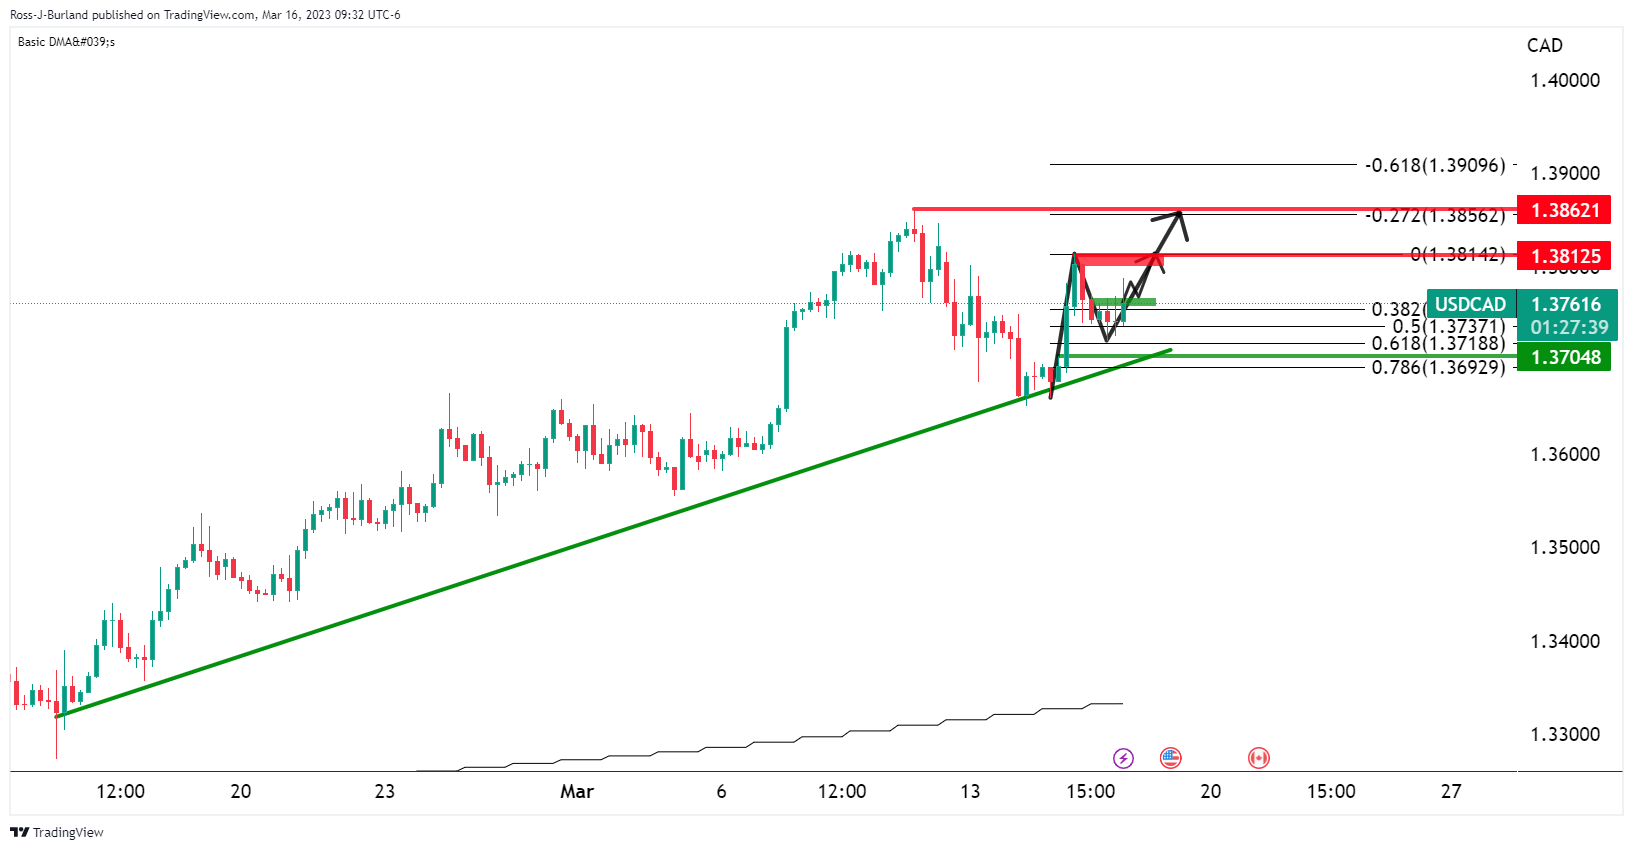
INTRUDUCTION OF USD CAD H1 TIME FRAME CHART; If the USD/CAD pair price is evaluated on the hourly chart and the pivot point line is at price 1.3140, then a bullish breakout and a double decrease in price are both indicated. The sideways primary trend in the chart's price is still present. If the pivot point line for the current price were to indicate a decline, and a bull candle were to form again, the target price on the chart would be 1.3200, and the resistance level at 1.3220 would be tested. If this were the case, a trade would be initiated right away. USD CAD KY TECHNICAL ANALYSIS: To price 1.3140 pivot point line say bullish breakout k bad thrice declined ho chuki hai, Piyary members USD/CAD ka one hour ka chart hamesha upper ka rujhaan our CANDL bnata hun our yeh pair price. The sideways primary trend in the chart's price is still present. Chart pay price ka agla target ooper 1.3200 aur phir usk bad price mazeed 1.3220 resistance levels ko test kar sakty hai if current price pivot point line says decreased k sath against try kar rahy hein our bull candle creat kkarty hai.
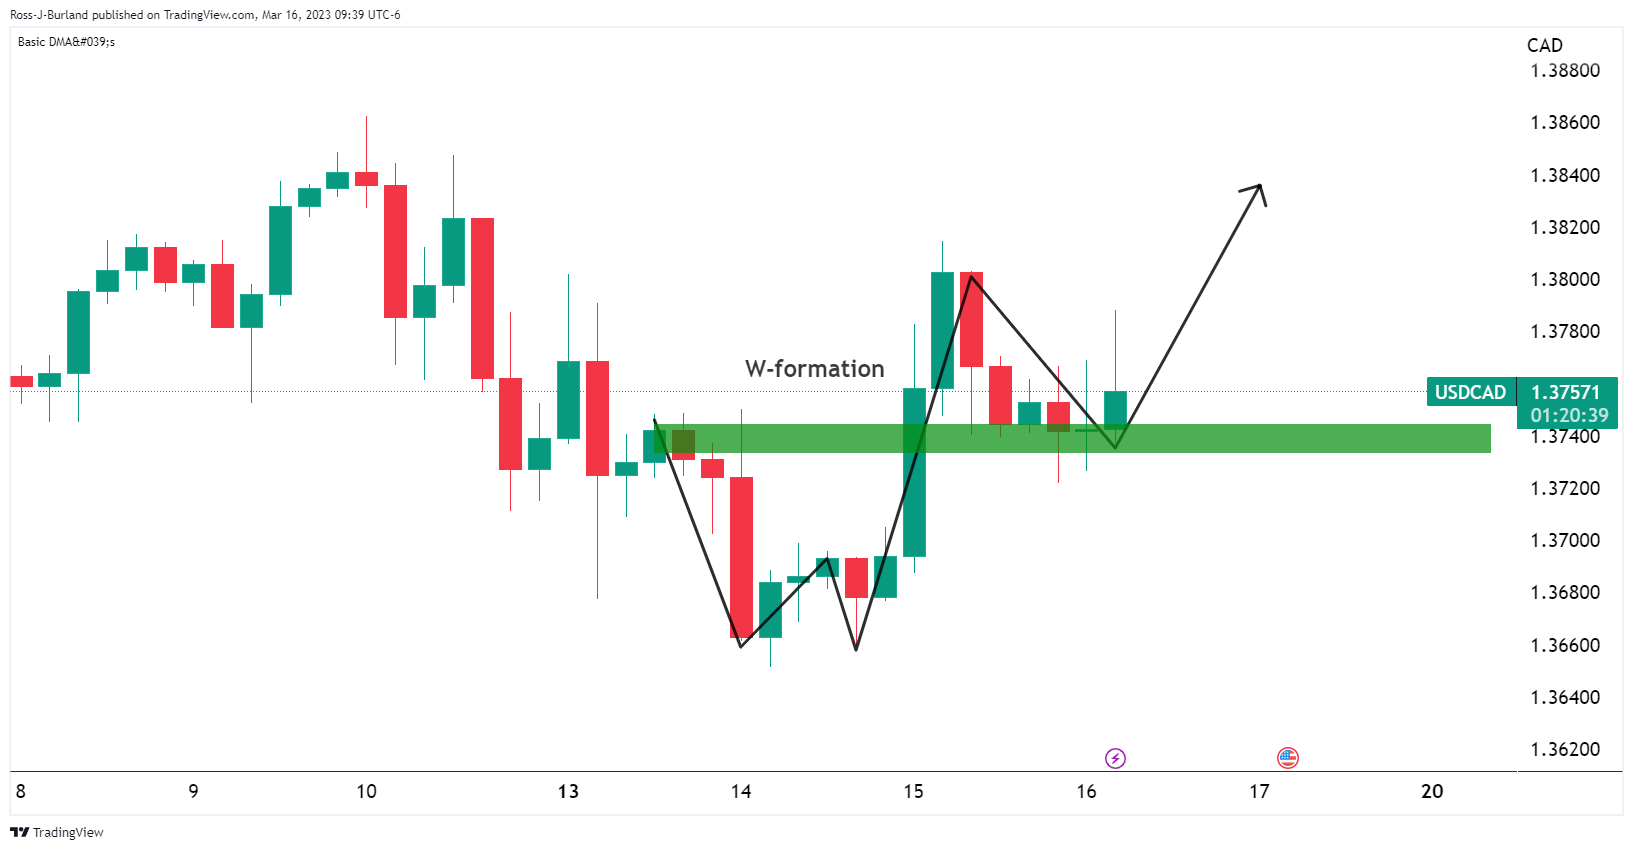
 USD / CAD H4 Chart Ibtidayi jad-o-jehad associated bawajood, lagta hai ke bear ko neechay ki taraf dabao abhi ke liye kam sun-hwa hai, kyunkay market ke jazbaat ko taizi ke muaqqaf ki taraf muntaqil karne ki koshishen ki ja rahi hain. Hatmi imthehaan 1. 3250 par muzahmati satah ko uboor karne mein hai, taham. Taham, aik islahi rule back ka tajurbah kya unhon ne thori the letter der baad. Aik kamyaab paish Raft 1. 3220 ki taraf mazeed fawaid ki raah hamwar kere gi, aur woh aik baar phir 1929. 69 ki satah ko tornay ki koshish kar rahay hain. jo fi al haal oopar ki taraf barh rahi hai, jo mumkina taaqat ki nishandahi karti hai, yeh khaas satah zaroori moving average ke sath bhi mawafiq hai. market ki simt ki wazeh tasweer faraham kere gi mustaqbil ki harkiyaat. channel ke nichale hissay di nishaan zad karta hai, belon ne haal hi mein 1. 3229 par muzahmati satah the ki lachak de tajurbah kya.
 USD CAD KY TECHNICAL ANALYSIS: To price 1.3140 pivot point line say bullish breakout k bad thrice declined ho chuki hai, Piyary members USD/CAD ka one hour ka chart hamesha upper ka rujhaan our CANDL bnata hun our yeh pair price. The sideways primary trend in the chart's price is still present. Chart pay price ka agla target ooper 1.3200 aur phir usk bad price mazeed 1.3220 resistance levels ko test kar sakty hai if current price pivot point line says decreased k sath against try kar rahy hein our bull candle creat kkarty hai.
 USD / CAD H4 Chart Ibtidayi jad-o-jehad associated bawajood, lagta hai ke bear ko neechay ki taraf dabao abhi ke liye kam sun-hwa hai, kyunkay market ke jazbaat ko taizi ke muaqqaf ki taraf muntaqil karne ki koshishen ki ja rahi hain. Hatmi imthehaan 1. 3250 par muzahmati satah ko uboor karne mein hai, taham. Taham, aik islahi rule back ka tajurbah kya unhon ne thori the letter der baad. Aik kamyaab paish Raft 1. 3220 ki taraf mazeed fawaid ki raah hamwar kere gi, aur woh aik baar phir 1929. 69 ki satah ko tornay ki koshish kar rahay hain. jo fi al haal oopar ki taraf barh rahi hai, jo mumkina taaqat ki nishandahi karti hai, yeh khaas satah zaroori moving average ke sath bhi mawafiq hai. market ki simt ki wazeh tasweer faraham kere gi mustaqbil ki harkiyaat. channel ke nichale hissay di nishaan zad karta hai, belon ne haal hi mein 1. 3229 par muzahmati satah the ki lachak de tajurbah kya.


تبصرہ
Расширенный режим Обычный режим