Technical analysis of the AUD/USD pair
4-hour chart
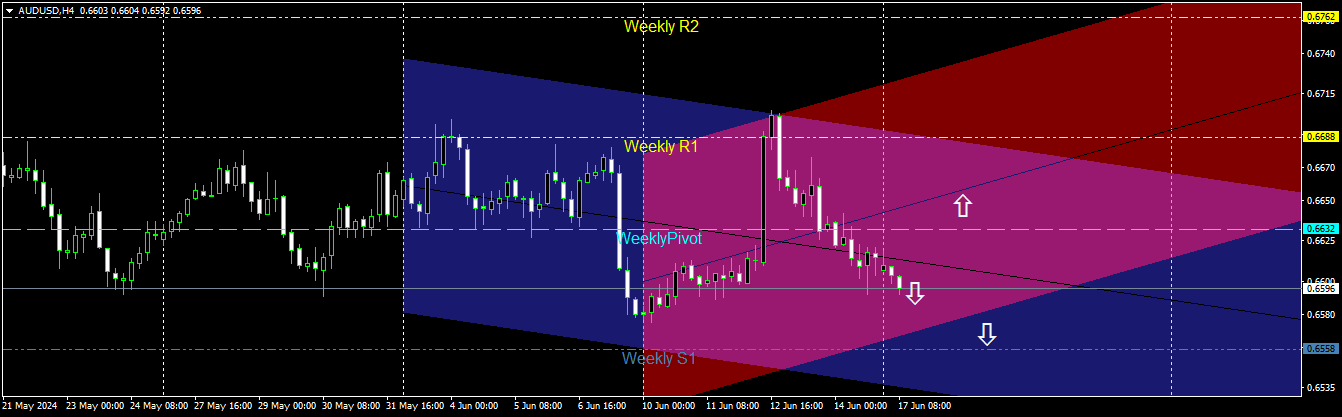
Pichle hafton mein price chart par hum dekh rahe hain ke price sideways direction mein move ho raha hai. Pichle hafte, price ne ek strong upward wave mein trend kiya, lekin hafte ke beech mein hi price ne downward trend shuru kiya, jo previous upward wave ke barabar tha. Is hafte, price weekly pivot level ke neeche trading shuru kiya hai aur pichle hafte ke lowest trading price ke qareeb hai, lekin ab tak price further decline ki taraf move karne ki koshish kar rahi hai.
Isliye agle trend ko determine karne ke liye, aapko price behavior ka wait karna aur monitor karna hoga, kyunke price current level par ek price bottom form kar sakta hai aur is hafte ke doran trend upward ho sakta hai. Price previous bottom level ko todne ki koshish kar sakti hai aur is hafte ke doran further fall continue kar sakti hai. Pair par ek trader next levels of trading par focus kar sakta hai.
Current level selling ke liye suitable hai, kyunke price middle line of the blue channel se resistance face kar rahi hai, jo kam se kam lower red channel line tak price ko girane ke liye lead karta hai. Dusra selling level hoga agar price red channel ko todta hai, kyunke is case mein price lower blue channel line ki taraf ja rahi hai. Is hafte ke buying levels ke liye, wo weekly pivot level ke upar hain, isliye aap price ko ek hour ke liye weekly pivot level ke upar settle hone ka wait kar sakte hain aur phir buying mein enter ho sakte hain. Dusra buying level hoga jab price 0.6688 weekly resistance ko todta hai aur iske upar ek hour ke liye stabilize ho jata hai.
تبصرہ
Расширенный режим Обычный режим