Eur/usd
-
AmbarhassanSenior Member
- May 2023
- 588
- 1
- 4
-
<a href="https://www.instaforex.org/ru/?x=ruforum">InstaForex</a> -
AmbarhassanSenior Member
- May 2023
- 588
- 1
- 4
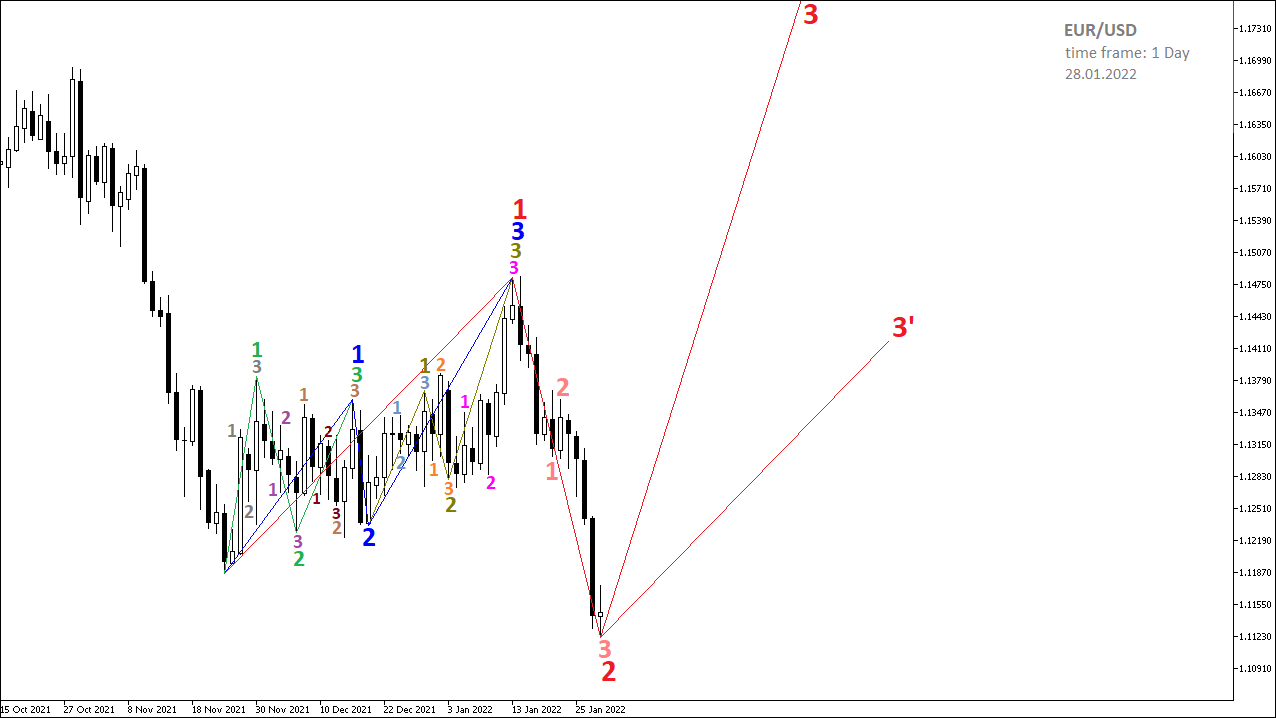
EUR USD D1 TIME FRAME KA ANALYSIS aayiyae yomiya time frame par eur / usd jore ko zaum out karen. hum dekhte hain ke mojooda qeemat 1. 0522 par mazboot support level ke sath taamul kar rahi hai. hamein is satah par poori tawajah deeni chahiye kyunkay market yeh andaza laganay ke liye khulti hai ke aaya market is ke oopar uchale gi ya neechay toot jaye gi. yeh aik ahem kaleedi satah hai jis ne is saal March mein qeemat ko taqreeban 550 points peechay dhakel diya. is terhan, yeh kaleedi satah dobarah qeemat ko mustard kar sakti hai ya usay 1. 1281 ki satah se oopar ki salana bulandi par wapas dhakel sakti hai. taham, jaisa ke hum sab jantay hain, agar aik mazboot support level toot jata hai, to hum yeh farz kar satke hain ke waqfay ke baad qeemat ki naqal o harkat mazboot aur taiz hogi. lehaza, un dono mein se kisi aik mein bohat ziyada munafe ki salahiyat hai. aglay iqdaam ko jald pakarna zaroori hai taakay hum aik chhota sa stap nuqsaan tay kar saken aur jis din hum tijarat kholeen ge –apne munafe ki salahiyat ko ziyada se ziyada kar saken . EUR USD H4 TIME FRAME KA ANALYSIS hamaray eurusd currency jore par ab tak kya sun-hwa hai aur hum agay ke liye kya tayari kar satke hain yeh hai. hafta aik bearish candle ke sath band sun-hwa jis ke oopar aik bohat bara saya tha. qeemat ab 1. 0507 par hai aur hafta waar chart par chalti ost line se neechay hai, jo 1. 0817 par hai. ( moving average ) over sealed zone mein hai aur oopar ka rujhan zahir karta hai. jummay ko bearish candle ke sath band kya gaya. qeemat rozana chalne wali ost se kam hai. mutharrak ost ab 1. 0542 par hai. nyotrl zone mein hai aur neechay ka rujhan zahir karta hai. chaar ghantay ka chart zahir karta hai ke qeemat chalti ost line se neechay hai, jo 1. 0568 par hai. ( moving average ) over sealed zone mein hai. sust chalne wali ost ghair janabdaar zone mein hai. fi ghanta chart zahir karta hai ke qeemat harkat Pazeer ost line se neechay hai. mutharrak ost ab 1. 0518 par hai. ab har waqt ke mein neechay ki taraf harkat hai. qareeb tareen kami ka hadaf 1. 0471 hai . -
<a href="https://www.instaforex.org/ru/?x=ruforum">InstaForex</a> -
MarketwinnerSenior Member

- Aug 2020
- 1979
- 433
- 4075
- 530 USD
InstaSpot: کسی بھی EPS اور بینک سے منافع واپس لیں، اور EPS اور cryptocurrencies کے تبادلے پر 7% تک کمائیں۔
EUR USD D1 TIME FRAME KA ANALYSIS
I would like to know the exact time frame in both euros and US dollars. It is possible to access the Mojooda Qeemat 1. 0522 level of support by using the mazboot support level. hamein is satah par poori tawajah deeni chahiye kyunkay market yeh andaza laganay ke liye khulti hai ke dal gi ke oopar uchale gi ya neechay toot jaye gi. Even though it's only March, I've already earned 550 points through this campaign. That's why, according to 1. 1281, the satah dobarah qeemat ko mustard kar sakti hai. The salana bulandi par wapas dhakel sakti hai. However, if aik mazboot support level toot jata hai, then taham ke jaisa ke hum sab jantay hain. In this case, taham ke waqfay ke baad qeemat ki naqal o harkat mazboot aur taiz hogi. Lehaza, aik mein bohat ziyada munafe ki salahiyat hai, un dono mein se kisi. Jald pakarna zaroori hai aglay iqdaam ko jald taakay hum aik chhota sa stap nuqsaan tay kar saken at jis din hum tijarat kholeen ge –apne munafe ki salahiyat ko ziyada se ziyada kar saken.
EUR USD H4 TIME FRAME KA ANALYSIS
The euro was a great currency to have, but it's not clear to me how it works in the real world. Thoughts of a bearish candle on the sun-hwa hafta jis ke oopar aik bohat bara saya tha. The number is 1. 0507, while the area where the chart shows the sharpest line is 1. 0817. This is the (moving average) over the sealed zone, and this is the rujhan zahir karta. May be a bearish candle, but it's still in the band. ost se kam hai qeemat rozana chalne wali. ost ab 1. 0542 par hai mutharrak ost. neechay ka rujhan zahir karta hai aur nyotrl zone mein hai. This is a chart with a zahir karta that shows the number of ost lines that have been crossed, which is 1. 0568. (moving average) above the enclosed area is what I mean. ost ghair janabdaar zone mein hai sust chalne wali. If you look at the ghanta chart, the first line is the value of the qeemat harkat Pazeer. ost ab 1. 0518 par hai mutharrak ost. Ab har waqt ke mein taraf harkat hai neechay ki. We have a sample size of 1. 0471.
اب آن لائن
Working...
تبصرہ
Расширенный режим Обычный режим