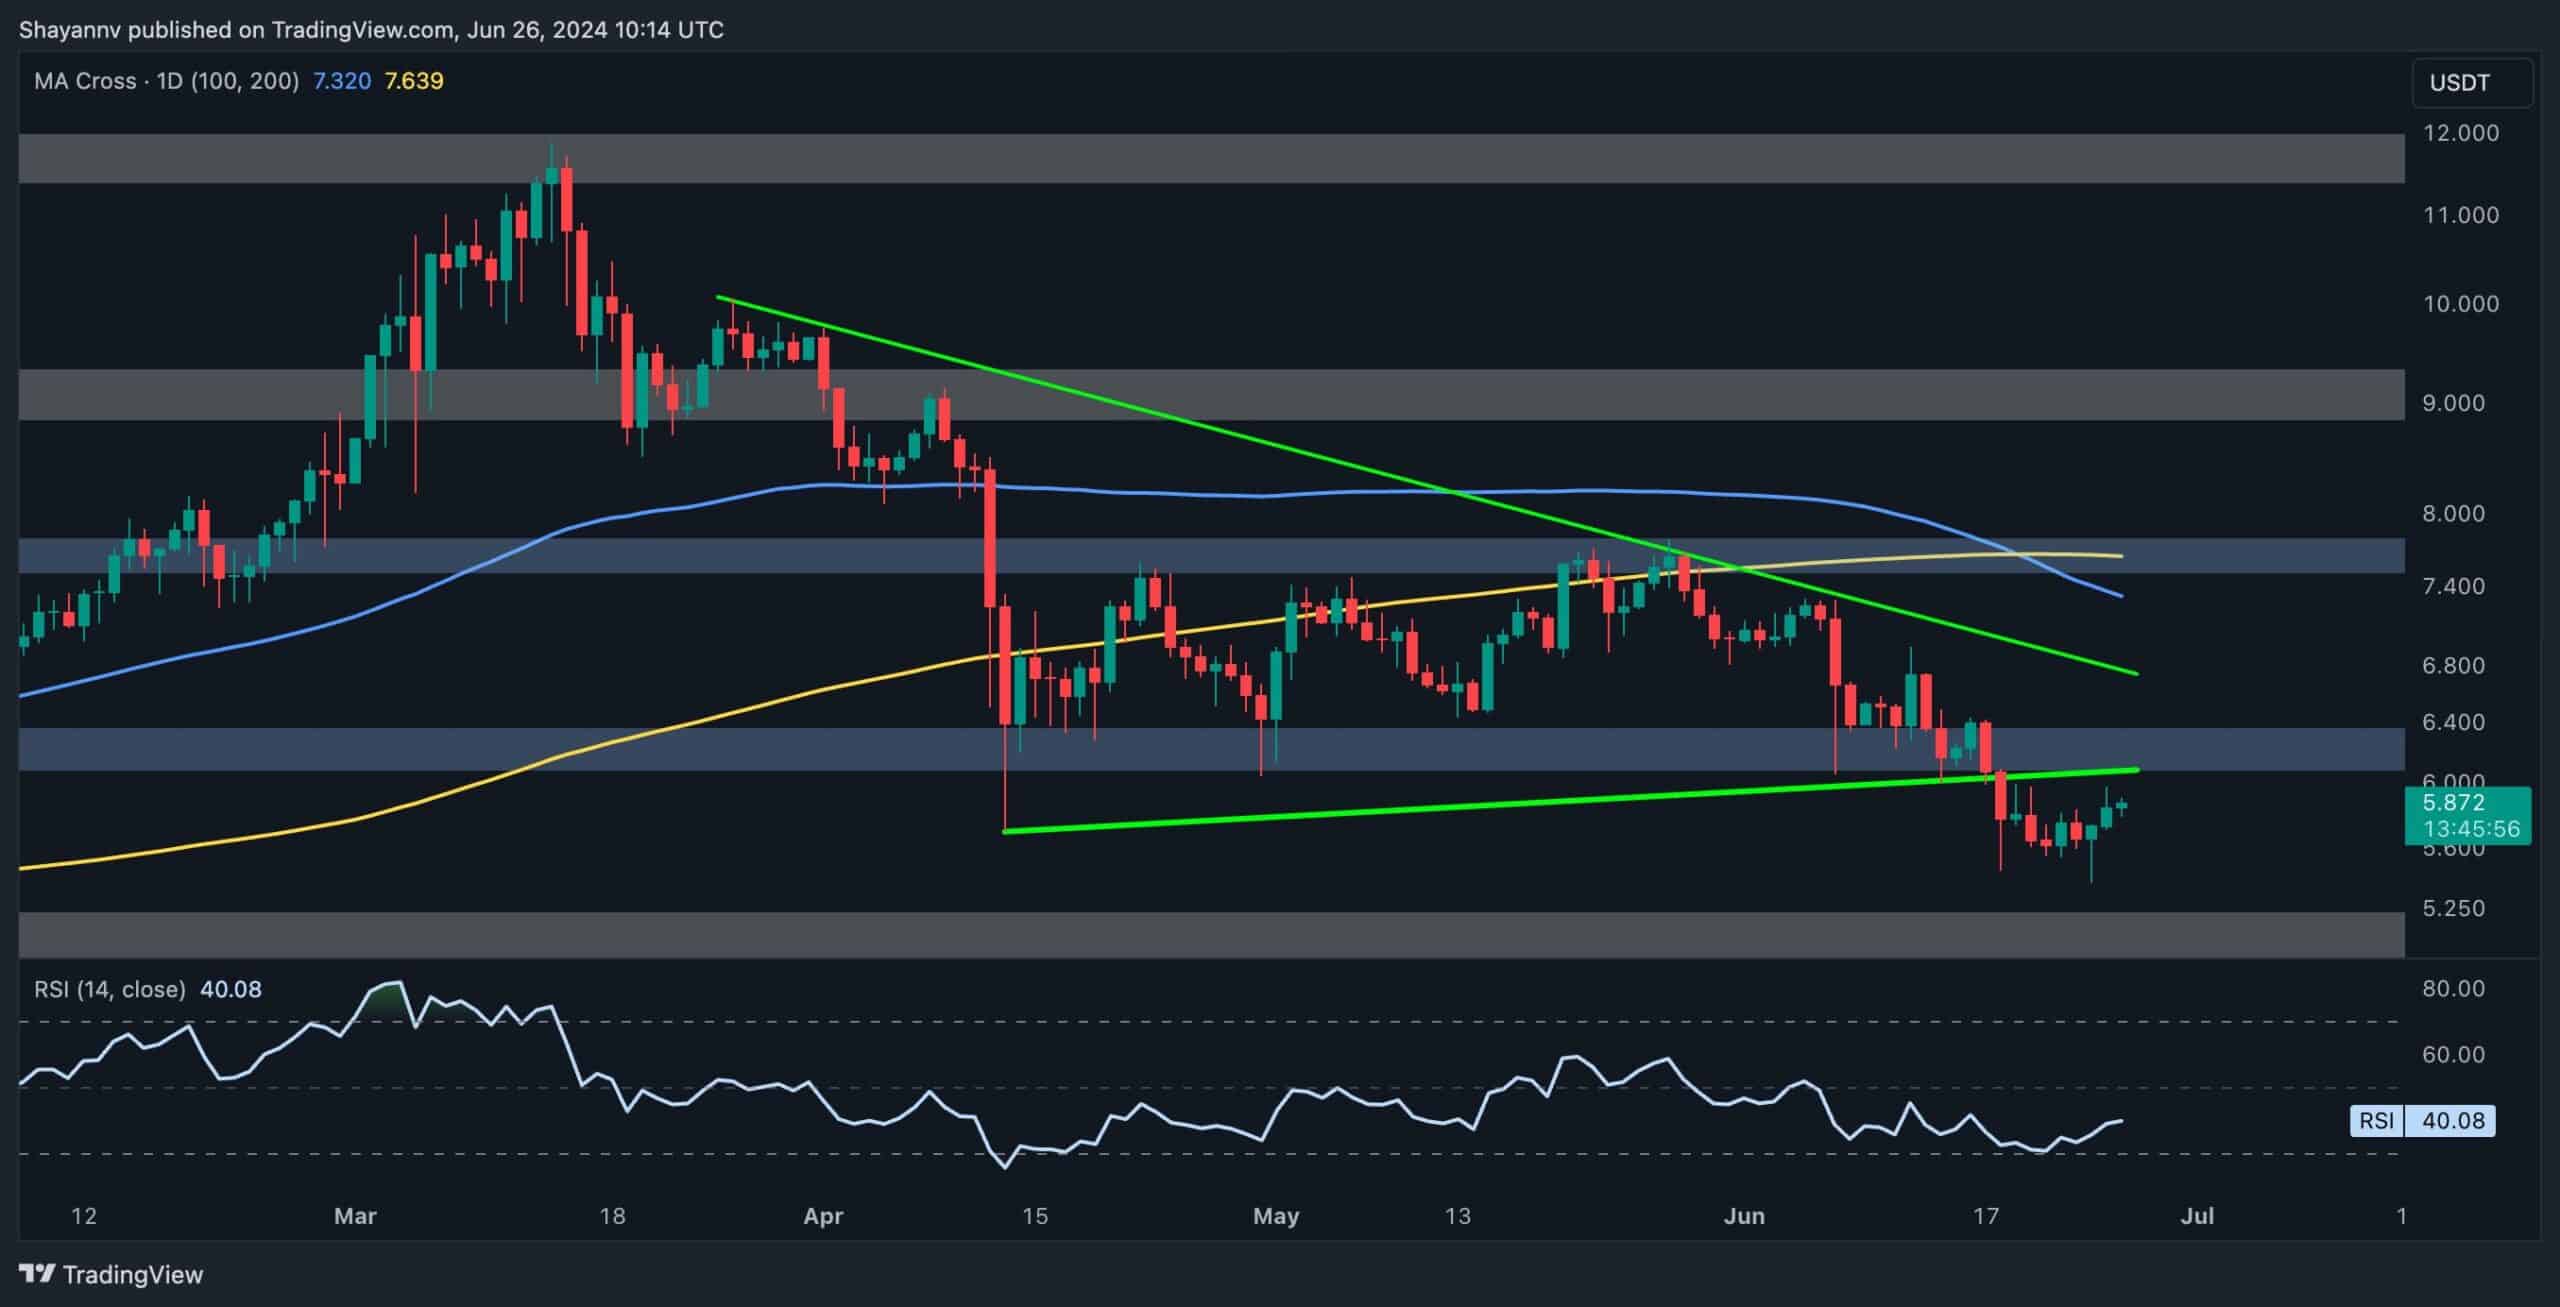
DOT/USD Polkadot Chart Analysis

No announcement yet.
`
X
  • وقت
  • دکھائیں
Clear All
new posts
  • #1 Collapse

    DOT/USD Polkadot Chart Analysis
    Dear Members

    Yaha ap DOT/USD Polkadot kay Chart Analysis Discuss Kar Sakty hain. Jis mai different Chart Patterns, Trend, Time Frames etc ko Mentioned Kar kay Beyan Kar sakty hain.

    Shukriya.
  • <a href="https://www.instaforex.org/ru/?x=ruforum">InstaForex</a>
  • #2 Collapse

    Polkadot (DOT/USD) Chart Analysis

    Polkadot, a leading blockchain network focused on interoperability, continues to be a focal point for traders and investors alike. DOT, the native token of Polkadot, has displayed notable price action recently, with mixed signals indicating both opportunities and risks in the market. Let’s dive into the technical and strategic aspects of trading DOT/USD.

    Current Market Overview


    Polkadot is currently trading around the $8.67 mark. The asset has shown resilience in the face of market corrections, with a monthly gain of over 70%. However, recent price action indicates a consolidation phase, as the token has dropped nearly 14% in the last week, reflecting a potential cool-off after its bullish run.

    Despite the short-term dip, long-term indicators still hold promise, especially as Polkadot focuses on enhancing its ecosystem and enabling interoperability across blockchains.
    Key Support and Resistance Levels


    To make informed trading decisions, it’s critical to understand the significant price levels:
    • Resistance Levels:
      • $9.92: Immediate resistance; a break above this could trigger a move toward $11.34.
      • $12.31: A major resistance point that could define the next bullish leg.
    • Support Levels:
      • $7.53: Strong support; losing this level may lead to further declines.
      • $6.56: Secondary support that aligns with long-term bullish trendlines.
    Technical Indicators Analysis
    1. Relative Strength Index (RSI):
      The RSI is currently hovering in the overbought territory, signaling caution for new buyers. This could imply a short-term correction, providing better entry points for long-term investors.
    2. Moving Averages:
      • The 50-day SMA indicates a slight bearish sentiment as DOT trades below this moving average.
      • The 200-day SMA reflects a longer-term bullish outlook, with DOT comfortably trading above this level.
    3. Volume Trends:
      A decline in trading volume suggests waning momentum, potentially leading to sideways movement or a pullback. High volume at breakout levels could reignite bullish sentiment.
    Bullish and Bearish Scenarios


    Bullish Case:
    • A successful breakout above $9.92 could set the stage for a rally toward $11.34 or even $12.31.
    • Sustained support above $9 will reinforce bullish confidence, attracting more buyers.

    Bearish Case:
    • Failing to hold the $7.53 support could see DOT retrace to $6.56, where buyers may re-enter.
    • Broader market corrections or negative macroeconomic developments might amplify selling pressure.
    Fundamental Factors to Watch
    1. Ecosystem Development:
      Polkadot’s unique parachain architecture continues to attract developers and projects. Increased adoption of parachains can directly influence DOT’s price.
    2. Market Sentiment:
      As a prominent altcoin, Polkadot often mirrors Bitcoin’s market movements. Positive news for BTC can translate to upward momentum for DOT.
    3. Regulatory Updates:
      Global regulatory policies around cryptocurrencies remain a wildcard, capable of significantly impacting Polkadot’s growth and adoption.
    Trading Strategy Tips
    1. Swing Traders:
      Utilize support and resistance levels to identify entry and exit points. Look for confirmation signals, such as bullish candlesticks or volume surges, before committing capital.
    2. Long-Term Investors:
      Consider accumulating DOT during dips, especially near strong support levels like $7.53. Focus on its long-term potential as Polkadot’s ecosystem matures.
    3. Risk Management:
      • Always use stop-loss orders to limit potential losses.
      • Avoid over-leveraging, particularly in a market known for high volatility.
    Final Thoughts


    Polkadot’s current price action presents opportunities for both short-term gains and long-term investments. However, traders must navigate its price movements cautiously, keeping an eye on key technical and fundamental factors. With its robust technology and growing ecosystem, DOT remains a promising contender in the cryptocurrency market, but as always, prudent risk management is essential for success.
    • <a href="https://www.instaforex.org/ru/?x=ruforum">InstaForex</a>
    • #3 Collapse

      **DOT/USD Polkadot Chart Analysis: Aaj Ki Halat Aur Mustaqbil Ki Peshgoi**
      Polkadot (DOT) ek aisi cryptocurrency hai jo blockchain interoperability ko solve karne ka aim rakhti hai. Yeh platform alag-alag blockchains ko ek doosre se connect karta hai, jis se decentralized applications (dApps) aur smart contracts ka ecosystem aur zyada efficient ban sakta hai. DOT/USD trading pair mein kaafi interest hai, aur agar aap isme invest karna chahte hain, to is post mein hum Polkadot ke current price trend ka analysis karenge aur future predictions ko explore karenge.

      **1. Polkadot Ka Current Price Trend:**

      Agar hum DOT/USD chart ko dekhein, to abhi Polkadot ka price lagbhag $4.50-$5.00 ke range mein fluctuate kar raha hai. Pichlay kuch mahino mein, Polkadot ki price mein significant ups and downs dekhe gaye hain. Filhal price kisi consolidation phase mein hai, jahan se yeh kisi major price movement ki taraf move kar sakta hai. Yeh phase market ki uncertainty ko reflect karta hai, lekin future mein major trend reversal ya continuation ho sakti hai.

      **2. Technical Indicators Ka Analysis:**

      Polkadot ka price analysis karte waqt, kuch technical indicators kaafi madadgar hote hain. Hum **Moving Averages (MA)**, **Relative Strength Index (RSI)**, aur **MACD** indicators ka use karte hain.

      - **Moving Averages (MA):** Polkadot ka 50-day moving average lagbhag $4.80 ke aas paas hai, aur agar price is level ke upar rehta hai, to yeh bullish signal ho sakta hai. Agar price 50-day moving average se neeche girta hai, to bearish momentum dekhne ko mil sakta hai. 200-day moving average ko long-term trend ke liye dekha jata hai, jo abhi $4.00 ke aas paas hai. Agar DOT/USD is level ke neeche jata hai, to price further decline kar sakta hai.

      - **RSI (Relative Strength Index):** RSI indicator abhi 45-50 ke aas paas hai, jo neutral zone ko indicate karta hai. Agar RSI 30 ke niche jata hai, to Polkadot oversold ho sakta hai, aur agar yeh 70 ke upar jata hai, to overbought condition ho sakti hai. Filhal, RSI ka neutral hone ka matlab hai ke market mein koi clear direction nahi hai aur price movement future mein decide ho sakta hai.

      - **MACD (Moving Average Convergence Divergence):** MACD indicator Polkadot ke liye kaafi important hai. Agar MACD line signal line ko cross karti hai, to yeh bullish signal hota hai. Agar MACD line negative zone mein jati hai, to bearish trend ka signal ho sakta hai. Abhi tak, MACD neutral hai, lekin agar positive territory mein jata hai, to upward momentum dekhne ko mil sakta hai.

      **3. Support Aur Resistance Levels:**

      Polkadot ke liye support aur resistance levels ko samajhna kaafi zaroori hai, kyun ke yeh price movement ke direction ko samajhne mein madad karte hain.

      - **Support Level:** DOT ka strong support level $4.50 ke aas paas hai. Agar price is level ke neeche jata hai, to hum DOT/USD ko $4.00 tak girte dekh sakte hain. Yeh level ek major support point ho sakta hai, jahan price bounce back kar sakta hai.

      - **Resistance Level:** Polkadot ka major resistance level $5.50 ke aas paas hai. Agar DOT/USD is level ko break karta hai, to price $6.00 ya usse upar ja sakta hai. Yeh bullish signal hoga aur price ko upward momentum mil sakta hai.

      **4. Market Sentiment:**

      Polkadot ka price market sentiment aur adoption par kaafi depend karta hai. Agar Polkadot network ke adoption mein tezi aati hai, aur agar alag-alag blockchains ka integration hota hai, to DOT ka price barh sakta hai. Lekin agar cryptocurrency market mein general uncertainty ho, ya market mein koi negative news aati hai, to DOT/USD ka price neeche bhi gir sakta hai. Institutional interest aur Polkadot ke ecosystem mein naye developments bhi DOT ki price ko influence kar sakte hain.

      **5. Future Outlook:**

      Agar hum Polkadot ke future ki baat karein, to DOT/USD ka price kaafi potential rakhta hai. Agar market mein positive sentiment rehta hai, aur Polkadot network ki adoption barhti hai, to hum DOT ko $6.00 aur uske upar dekh sakte hain. Lekin agar price $4.50 ke support level ke neeche girta hai, to hum DOT/USD ko $4.00 tak bhi dekh sakte hain.

      **Conclusion:**

      DOT/USD chart analysis se yeh samajh aata hai ke Polkadot ka market abhi consolidation phase mein hai. Lekin technical indicators aur support-resistance levels ko dekhte hue, future mein price movements kaafi promising ho sakte hain. Agar aap Polkadot mein invest karna chahte hain, to market sentiment aur Polkadot ke ecosystem developments ko closely monitor karna hoga. Risk management ko apni strategy ka hissa banayein aur market trends ke mutabiq apne decisions lein.

      اب آن لائن

      Working...
      X