Assalamu Alaikum
dear friend kaise hain Sab ummid Hai Ki Harriet se Honge aur Apna Achcha kam kar rahe Honge Jab aap ismein kam karte hain to aapko proper learning experience aur planning ke sath kam karna hota hai agar aap ismein hard work Karenge to aapko is market Mein kamyabi Milegi forex market Mein different patterns bante Hain Har patterns ko samajhne ke liye aapke pass proper learning aur experience Hona chahie Jab aap market Mein proper time Denge to aapko Achcha hai experience Milega isliye aapko proper time Dena Hoga main aaj aapko bahut important information share karungi jo aapki trading ko profitable banaa sakti hai to Mera topic Hai Broadening Chart Pattren Kia hai iski details aapke sath discuss karungi.
Broadening Pattern:
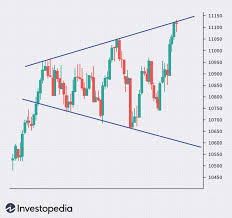
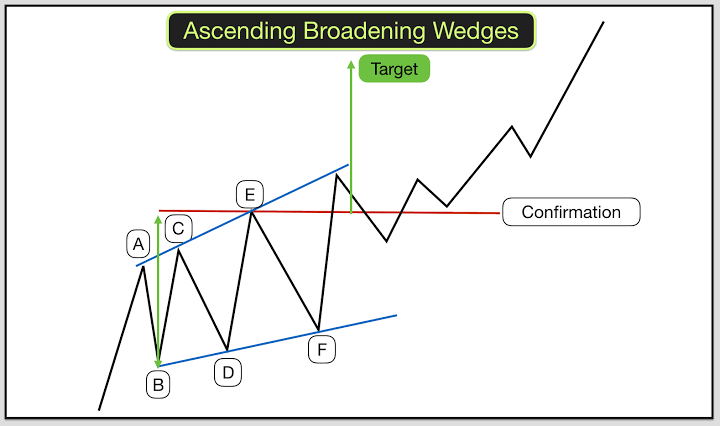
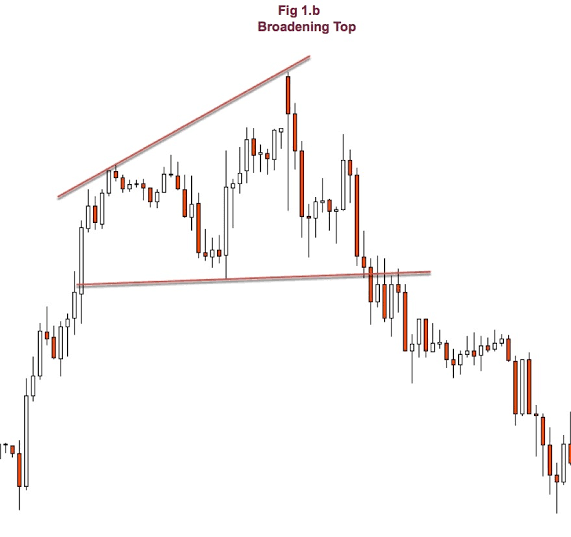
Dear friend forex market Mein Jaab Hum kaam kar rahy hoty hain to usmain Broadening pattern banny Main chart par bahot arsa leta hai jo ki trend reversal pattern Main shumar Hota Hai broadening pattern Main price different gap Ky dauran 4 se 5 dafa trend line ko touch Karti Hai Lekin Aakhir main yeh Kesi dusri side par Chali Jati Hai technical analysis is pattern ke bary main Kahaty Hain ky pattern ya to bahot zyada high price or ya bahot zyada kaam price waly area Main paya jata hai yeah pattern bullish area Mein market ke top trend ko for 6 touch karny ke bad bearish trend Main change ho jata hai Jab ke bearish area Main down trend ko line Kafi dafa fore se 6 se touch karny ky bad Main change ho jata hai yeh pattern market Main Maloom karny thora Mushkil hota hai Kyun ki yeh bahot Ehsas Ny banta hai yeh pattern market main Bary paimany par movement Sy Wapas ki shape main Aksar banta hai.

Candles Formation:
Dear member broadening Chart bullish aur bearish broding pattern per mustamail hai yah Ek trend reversal pattern Hai Jis per aap Sel aur buy ki entry Le sakte hain iski information aapko darja zail Tarah Se mil rahi hoti hai.

Bullish Broadening Pattern
Bearish Broadening Pattern
Bullish Broadening Pattern:
Dear friend Bullish Broadening pattern trend reversal pattern hai jo ke bearish market ke and Mein Banta Hai Jab Bhi price low price area Main trade kar rahi hoti hai to vah bearish Trend ke support level se down jaane ke bad bar koshish karti hai but Har dafa sirf trend line ko hi Touch Kar ke price Wapas Ho Jaati Hai price ke yah wapasi bullish trend ka sabab banti hai.
Bearish Broadening Pattren:
Dear friend trading main bearish Broadening pattern Main price Bullish trend reversal hokar Aati Hai yah pattern zyada tar Bullish trend ke last Main Banta Hai Jaab Bhi price high price area Mein trade kar rahi ho to yah bullish trend line ke resistance level ko touch karny ke bad Wapas Hoti Hai price Ek to bullish trend line ko Sahi tarike se follow nahin kar rahi party dusri Taraf woh market mein pahle Jaati Hai but Aakhir Main Bearish side sy break out Ho Jaati Hai.
Trade On This Pattern :
Dear friend forex trading Main Jaab Hum kaam kaar rahy hoty hain to usmain broadening pattern long term trading Ek best tool hai but is cost of loss position Aksar hit hone ke chances hoty hain market Main price pahly rahti hai jisse yeh Apne trend line ko break out karne ki koshish karte hain but nakam Ho Jaate Hain broadening pattern Mein price se Kai martba trend line ko touch karne ke bad Wapas Aati Hai aur zyadatar analysis se yah Karty Hain Ki Amal Wapas ki vajah se hota hai Fir Bhi Agar yah pattern market Mein Banta Hai Tujhe ek strong friend reversal pattern Hai jisse bearish side se buy aur bullish side se Sel ki entry ki Ja sakti hai.

Dear friend Is pattern ma long term traders is main bullish ke long term trade ko enter kary ga or is main traders buy ke long term trade ko bhi enter kar saka ga. Jab is pattern main market upper or lower trend line main move kary ge or move karty hoi market kesy trend line ko break kary ge to is main long term ke trade ko enter kiya jay ga. Agar market bullish main move hoti hoi upper trend line ko break kary ge to is main long term ka liya buy ki trade ko enter kiya jay ga or is ka stop loss is upper trend line par rakha jay ga. Or jab market break kara ge lower trend line ko to traders is main long term ka liya sell ke trade ko enter kara ga or is ka stop loss lower trend line par place kara ga.
dear friend kaise hain Sab ummid Hai Ki Harriet se Honge aur Apna Achcha kam kar rahe Honge Jab aap ismein kam karte hain to aapko proper learning experience aur planning ke sath kam karna hota hai agar aap ismein hard work Karenge to aapko is market Mein kamyabi Milegi forex market Mein different patterns bante Hain Har patterns ko samajhne ke liye aapke pass proper learning aur experience Hona chahie Jab aap market Mein proper time Denge to aapko Achcha hai experience Milega isliye aapko proper time Dena Hoga main aaj aapko bahut important information share karungi jo aapki trading ko profitable banaa sakti hai to Mera topic Hai Broadening Chart Pattren Kia hai iski details aapke sath discuss karungi.
Broadening Pattern:
Dear friend forex market Mein Jaab Hum kaam kar rahy hoty hain to usmain Broadening pattern banny Main chart par bahot arsa leta hai jo ki trend reversal pattern Main shumar Hota Hai broadening pattern Main price different gap Ky dauran 4 se 5 dafa trend line ko touch Karti Hai Lekin Aakhir main yeh Kesi dusri side par Chali Jati Hai technical analysis is pattern ke bary main Kahaty Hain ky pattern ya to bahot zyada high price or ya bahot zyada kaam price waly area Main paya jata hai yeah pattern bullish area Mein market ke top trend ko for 6 touch karny ke bad bearish trend Main change ho jata hai Jab ke bearish area Main down trend ko line Kafi dafa fore se 6 se touch karny ky bad Main change ho jata hai yeh pattern market Main Maloom karny thora Mushkil hota hai Kyun ki yeh bahot Ehsas Ny banta hai yeh pattern market main Bary paimany par movement Sy Wapas ki shape main Aksar banta hai.
Candles Formation:
Dear member broadening Chart bullish aur bearish broding pattern per mustamail hai yah Ek trend reversal pattern Hai Jis per aap Sel aur buy ki entry Le sakte hain iski information aapko darja zail Tarah Se mil rahi hoti hai.
Bullish Broadening Pattern
Bearish Broadening Pattern
Bullish Broadening Pattern:
Dear friend Bullish Broadening pattern trend reversal pattern hai jo ke bearish market ke and Mein Banta Hai Jab Bhi price low price area Main trade kar rahi hoti hai to vah bearish Trend ke support level se down jaane ke bad bar koshish karti hai but Har dafa sirf trend line ko hi Touch Kar ke price Wapas Ho Jaati Hai price ke yah wapasi bullish trend ka sabab banti hai.
Bearish Broadening Pattren:
Dear friend trading main bearish Broadening pattern Main price Bullish trend reversal hokar Aati Hai yah pattern zyada tar Bullish trend ke last Main Banta Hai Jaab Bhi price high price area Mein trade kar rahi ho to yah bullish trend line ke resistance level ko touch karny ke bad Wapas Hoti Hai price Ek to bullish trend line ko Sahi tarike se follow nahin kar rahi party dusri Taraf woh market mein pahle Jaati Hai but Aakhir Main Bearish side sy break out Ho Jaati Hai.
Trade On This Pattern :
Dear friend forex trading Main Jaab Hum kaam kaar rahy hoty hain to usmain broadening pattern long term trading Ek best tool hai but is cost of loss position Aksar hit hone ke chances hoty hain market Main price pahly rahti hai jisse yeh Apne trend line ko break out karne ki koshish karte hain but nakam Ho Jaate Hain broadening pattern Mein price se Kai martba trend line ko touch karne ke bad Wapas Aati Hai aur zyadatar analysis se yah Karty Hain Ki Amal Wapas ki vajah se hota hai Fir Bhi Agar yah pattern market Mein Banta Hai Tujhe ek strong friend reversal pattern Hai jisse bearish side se buy aur bullish side se Sel ki entry ki Ja sakti hai.
Dear friend Is pattern ma long term traders is main bullish ke long term trade ko enter kary ga or is main traders buy ke long term trade ko bhi enter kar saka ga. Jab is pattern main market upper or lower trend line main move kary ge or move karty hoi market kesy trend line ko break kary ge to is main long term ke trade ko enter kiya jay ga. Agar market bullish main move hoti hoi upper trend line ko break kary ge to is main long term ka liya buy ki trade ko enter kiya jay ga or is ka stop loss is upper trend line par rakha jay ga. Or jab market break kara ge lower trend line ko to traders is main long term ka liya sell ke trade ko enter kara ga or is ka stop loss lower trend line par place kara ga.

تبصرہ
Расширенный режим Обычный режим