Uses of neck line in trading

No announcement yet.
`
X
  • وقت
  • دکھائیں
Clear All
new posts
  • #1 Collapse

    Uses of neck line in trading
    Uses of neck line in trading
    Introduction


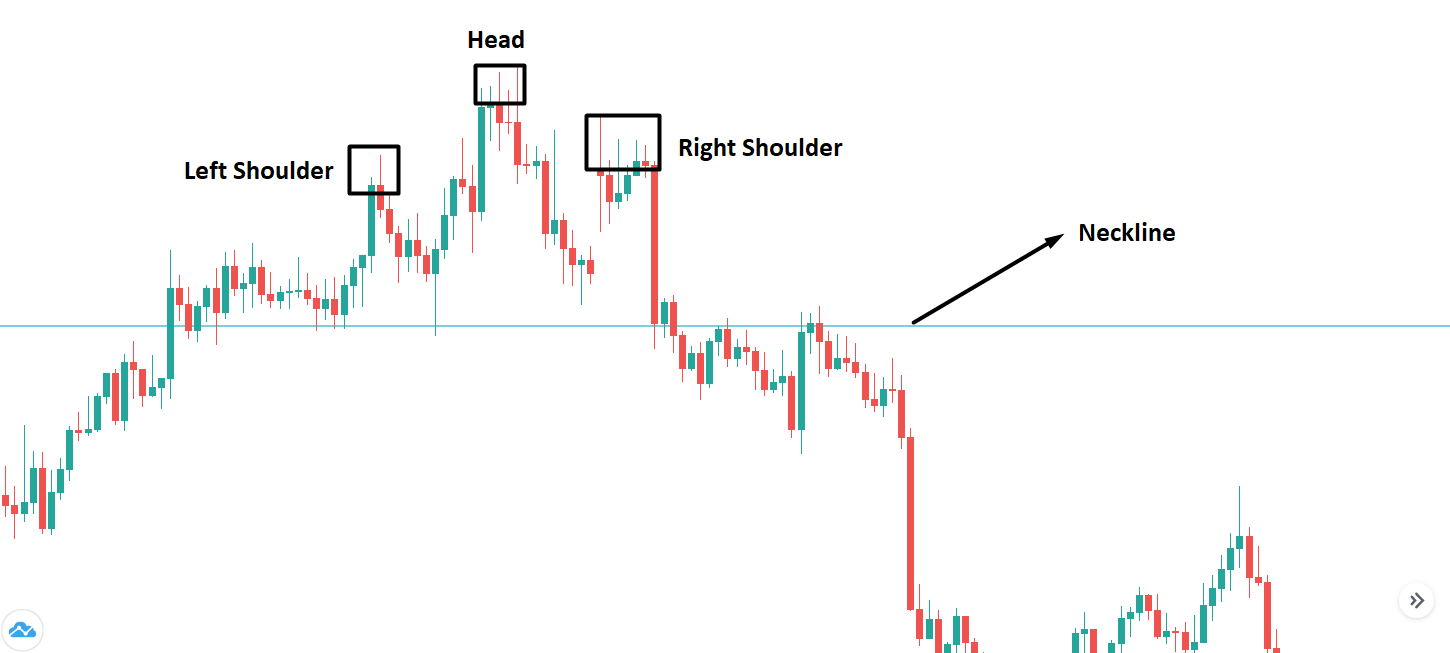
    Trading mein, istilaah" neckline" ka istemaal aik trend line ke liye kya jata hai jo chart patteren ke sab se kam nichale points ko jorta hai, jaisay ke head & Shoulder Pattern aik takneeki chart patteren hai jo is waqt bantaa hai jab stock ki qeemat chouti head tak pahonch jati hai, phir wapas girty hai, phir is se bhi onche chouti ( head ) par charh jati hai, aur phir dobarah girty hai. teesri chouti (right shoulders) jo aam tor par head se neechay hoti hai neck line head & Shoulders kay 2 falls ke nichale points ko jor kar khenchi jati hai jo sir aur kaandhon ke nichale hissay ko tashkeel dete hain.


    Neck line in trading definition

    Neck k line support ya muzahmat ki aik satah hai jo sir aur kaandhon ke patteren par payi jati hai jisay traders order dainay ke liye astritjk ilaqon ka taayun karne ke liye istemaal karte hain. gardan ki lakeer sir aur kaandhon ke ٹاپنگ patteren ke jhoolon ( jo pehli do chotyon ke baad hoti hai ) ko judte hai. naik line ke neechay ki harkat patteren ke break out ka ishara deti hai aur is baat ki nishandahi karti hai ke pichlle up trained ke neechay ki taraf ulat jana jari hai .

    sir aur kaandhon ke neechay walay patteren ki soorat mein, jisay ulta sir aur kandhay kaha jata hai, naik line patteren ki do jhoolon ki oonchaiyon ko judte hai aur dayen janib phail jati hai. jab qeemat naik line se oopar uthti hai to yeh patteren ke break out aur Sabiqa neechay ke rujhan ke ulat jane ka ishara deti hai .

    Click image for larger version

Name:	download (11).jpeg
Views:	1
Size:	7.0 کلوبائٹ
ID:	12600971

    Head and shoulder pattern
    Sir aur kaandhon ka patteren oopar ke rujhan ke baad bantaa hai aur yeh chouti, aik ریٹیسمنٹ, aik onche doosri chouti, aik retestment aik nichli teesri chouti, aur gardan ki lakeer ke neechay aik qatra par mushtamil hota hai .

    kuch traders short position mein daakhil hotay hain ya lambi pozishnon se bahar nikaltay hain jab qeemat naik line se neechay gir jati hai. mukhtasir mein daakhil honay walon ke liye, aik stap nuqsaan aksar haliya jhulay ke oopar ya teesri chouti ke ounchay oopar rakha jata hai .

    sir aur kaandhon ke liye mutawaqqa manfi harkat patteren ki oonchai hai — jo ke doosri chouti ki qeematon ke darmiyan do retestment mein se sab se kam qeemat tak ka farq hai. usay qeemat ka hadaf kaha jata hai. is baat ki koi zamanat nahi hai ke qeemat is satah tak pahonch jaye gi, ya is satah par girna band ho jaye gi. yeh sirf aik takhmeenah hai .

    Click image for larger version

Name:	download (14).png
Views:	47
Size:	5.9 کلوبائٹ
ID:	12600973

    On neck trader psychology
    security aik bunyadi neechay ke rujhan ya bunyadi up trained ke andar aik barray pal back mein masroof hai. pehli mom batii aik lambi siyah asli body post karti hai. qeemat ki yeh kamzor karwai mandi ki khushnodi mein izafah karti hai jabkay kamzor belon ko mukammal paspaai par majboor karti hai .

    doosri mom batii par hifazati farq neechay aa jata hai aur aik nai nichli satah par farokht hota hai, lekin khredar control sambhaal letay hain aur qeemat ko pehlay ke qareeb tak le jane ke qabil hotay hain lekin is se oopar nahi. reechh dekhte hain ke belon ke paas qeemat ko pehlay ke qareeb se oopar dhakelnay ki taaqat nahi hai. nazriya yeh hai ke reechh agli kayi mom btyon par qaabiz ho jayen ge aur qeemat ko kam kar den ge. jaisa ke behas ki gayi hai, haqeeqat mein, yeh sirf adhay waqt mein hota hai. is terhan patteren reechh aur bail dono ko kinare par rakhta hai, jis ke nateejay mein bunyadi tor par aik sikka palat_ta hai ke aaya patteren ke baad qeematein ziyada hon gi ya kam .


  • <a href="https://www.instaforex.org/ru/?x=ruforum">InstaForex</a>
  • #2 Collapse

    Forex aur stock trading mein technical analysis ek fundamental tool hai jo traders ko market movements aur trends ko predict karne mein madad karta hai. Technical analysis mein kai concepts aur patterns hoti hain jo trading decisions ko enhance karti hain. Inmein se ek important concept Neckline hai. Neckline trading patterns ka ek crucial element hai jo support aur resistance levels ko define karta hai aur market trends ko analyze karne mein madad karta hai. Neckline ek horizontal ya slanting line hoti hai jo technical analysis mein kai reversal aur continuation patterns ko define karti hai. Yeh line support aur resistance levels ko mark karti hai aur price movements ke crucial points ko indicate karti hai. Neckline ko commonly head and shoulders, inverse head and shoulders, double top, aur double bottom patterns mein use kiya jata hai.


    Importance of Neckline
    Neckline trading mein bohot important role play karti hai. Yeh line traders ko kai important insights provide karti hai:
    1. Trend Reversal Indication: Neckline ka break hona potential trend reversal ka strong signal hota hai. Jab price neckline ko breach karti hai, toh yeh indicate karta hai ke existing trend khatam hone wala hai aur naya trend shuru ho sakta hai.
    2. Support and Resistance Levels: Neckline support aur resistance levels ko clearly define karti hai. Yeh levels trading decisions ko execute karne mein key points hoti hain, jahan price action significant hota hai.
    3. Price Targets: Neckline ka use karke price targets ko predict kiya ja sakta hai. Reversal patterns mein neckline ka break hote hi traders apne price targets set kar sakte hain based on pattern height.
    Types of Necklines
    Neckline kai types ki hoti hain, jo different trading patterns ke sath associated hoti hain:
    1. Head and Shoulders Neckline:
      • Definition: Head and Shoulders pattern ek reversal pattern hai jisme neckline ek horizontal ya slanting line hoti hai jo left shoulder, head, aur right shoulder ke low points ko connect karti hai.
      • Bullish Scenario: Inverse Head and Shoulders pattern mein neckline ek resistance level hota hai jo break hone pe uptrend ka signal deta hai.
      • Bearish Scenario: Head and Shoulders pattern mein neckline ek support level hota hai jo break hone pe downtrend ka signal deta hai.
    2. Double Top and Double Bottom Neckline:
      • Definition: Double Top aur Double Bottom patterns reversal patterns hain jisme neckline ek horizontal line hoti hai jo two peaks ya troughs ke low/high points ko connect karti hai.
      • Bullish Scenario: Double Bottom pattern mein neckline ek resistance level hota hai jo break hone pe uptrend ka signal deta hai.
      • Bearish Scenario: Double Top pattern mein neckline ek support level hota hai jo break hone pe downtrend ka signal deta hai.
    3. Triple Top and Triple Bottom Neckline:
      • Definition: Triple Top aur Triple Bottom patterns reversal patterns hain jisme neckline ek horizontal line hoti hai jo three peaks ya troughs ke low/high points ko connect karti hai.
      • Bullish Scenario: Triple Bottom pattern mein neckline ek resistance level hota hai jo break hone pe uptrend ka signal deta hai.
      • Bearish Scenario: Triple Top pattern mein neckline ek support level hota hai jo break hone pe downtrend ka signal deta hai.
    Identification and Drawing of Neckline
    Neckline ko accurately identify aur draw karna zaroori hai. Yeh process kuch steps pe based hai:
    1. Identify Pattern: Pehle pattern ko identify karna hota hai jaise Head and Shoulders, Double Top, ya Double Bottom. Pattern ko accurately identify karna zaroori hai taake neckline ko correctly draw kiya ja sake.
    2. Connect Points: Pattern ke low/high points ko identify karke unhe connect karte hain. For instance, Head and Shoulders pattern mein left shoulder, head, aur right shoulder ke low points ko connect karke neckline draw karte hain.
    3. Adjust for Accuracy: Neckline ko accurately draw karne ke liye zaroori hai ke points ko closely monitor kiya jaye aur line ko adjust kiya jaye taake wo maximum points ko connect kar sake.
    4. Confirm with Volume: Neckline ke break hone pe volume ka analysis bhi important hai. High volume ke sath neckline ka break hona strong signal hota hai.
    Trading Strategies Using Neckline
    Neckline ko dekh kar kai trading strategies adopt ki ja sakti hain. In strategies ko use kar ke traders profitable trading decisions le sakte hain:
    1. Breakout Trading:
      • Strategy: Neckline ka breakout hone pe trade execute karna breakout trading kehlata hai. Jab price neckline ko breach karti hai, toh traders position lete hain in the direction of breakout.
      • Bullish Breakout: Inverse Head and Shoulders ya Double Bottom pattern mein neckline ka break hona bullish signal hota hai. Traders long position lete hain aur stop loss neckline ke niche set karte hain.
      • Bearish Breakout: Head and Shoulders ya Double Top pattern mein neckline ka break hona bearish signal hota hai. Traders short position lete hain aur stop loss neckline ke upar set karte hain.
    2. Retest Strategy:
      • Strategy: Breakout ke baad price aksar neckline ko retest karti hai. Retest pe successful support ya resistance validation hone pe trade execute karna retest strategy kehlata hai.
      • Bullish Retest: Inverse Head and Shoulders ya Double Bottom pattern mein neckline ko retest karke bounce hona bullish signal hota hai. Traders long position lete hain aur stop loss neckline ke niche set karte hain.
      • Bearish Retest: Head and Shoulders ya Double Top pattern mein neckline ko retest karke reject hona bearish signal hota hai. Traders short position lete hain aur stop loss neckline ke upar set karte hain.
    3. Using Multiple Time Frames:
      • Strategy: Neckline ka analysis multiple time frames pe karna effective hota hai. Higher time frame pe neckline ka confirmation milne pe lower time frame pe trading decisions le sakte hain.
      • Implementation: Higher time frame pe neckline break hone pe lower time frame pe entry points search karte hain aur trade execute karte hain.
    4. Combining with Other Indicators:
      • Strategy: Neckline ko other technical indicators ke sath combine karna effective trading strategy hoti hai. Moving averages, RSI, MACD jaise indicators ke sath combine kar ke better trading signals milte hain.
      • Implementation: Neckline break hone pe agar moving average crossover ya RSI divergence confirm hoti hai toh trade execute karte hain.
    Psychological Aspect of Neckline
    Neckline ko samajhne ka ek important aspect market participants ki psychology hai. Yeh line market participants ke sentiment aur behavior ko reflect karti hai:
    1. Trader Sentiment: Neckline break hone pe trader sentiment ka shift hota hai. Bullish breakout market mein optimism ko indicate karta hai jabke bearish breakout pessimism ko.
    2. Market Psychology: Neckline market psychology ko bhi reflect karti hai. Breakout ke dauran market participants ka behavior significant hota hai. High volume breakout strong conviction ko indicate karta hai.


    Limitations of Neckline
    Neckline ke kuch limitations bhi hain jo traders ko dhyan mein rakhni chahiye:
    1. False Breakouts: Neckline ka false breakout hone ka risk hota hai. Kabhi kabhi price temporarily neckline ko breach karti hai lekin trend sustain nahi hota.
    2. Complex Identification: Neckline ko accurately identify aur draw karna complex ho sakta hai, especially beginners ke liye. Patterns ko correctly identify karna zaroori hai.
    3. Volume Consideration: Neckline break hone pe volume ka analysis important hai. Low volume breakout weak signal hota hai.
    Neckline trading mein ek powerful tool hai jo market trends aur price movements ko analyze karne mein madad karta hai. Yeh line support aur resistance levels ko define karti hai aur reversal patterns mein potential trend reversals ko indicate karti hai. Neckline ko accurately identify aur draw karke profitable trading decisions liye ja sakte hain. Different trading strategies jaise breakout trading, retest strategy, multiple time frames ka use aur indicators ke sath combination ko adopt karke better trading outcomes achieve kiye ja sakte hain. Lekin, neckline ko samajhne ke liye deep understanding aur practice zaroori hai. Iske limitations ko dhyan mein rakhte hue risk management strategies ko adopt karna bhi zaroori hai. Trading mein successful hone ke liye neckline ka comprehensive understanding aur accurate application bohot important hai.
    Believe in yourself and your abilities. When you fight for your dreams, you can achieve anything.
    • #3 Collapse

      **Neckline Ke Istemal Trading Mein**
      Neckline, ek technical analysis concept hai jo trading mein ahmiyat rakhta hai, khas tor par chart patterns jaise ki head and shoulders ya double top ya double bottom ke sath. Yeh article uske mukhtalif istemalat aur trading mein uske roles par roshni dalta hai.

      **1. Head and Shoulders Pattern:**
      Neckline head and shoulders pattern mein ek significant role ada karta hai. Yeh pattern bearish trend reversal ke liye istemal hota hai jab price ek higher high ke baad down movement start karta hai. Neckline is pattern mein middle line hota hai jo head and shoulders ke beech mein hota hai aur jab price is line ko break karta hai, yeh signal hota hai ke bearish trend shuru hone wala hai.

      **2. Double Top and Double Bottom Patterns:**
      Double top aur double bottom patterns mein bhi neckline ka istemal hota hai. Jab price ek resistance level ko do baar touch karta hai aur phir usay break kar ke neeche jaata hai, toh woh double top pattern hai. Ismein neckline resistance level ko represent karta hai. Double bottom pattern mein neckline support level ko represent karta hai, jab price ek support level ko do baar touch kar ke upar jaata hai.

      **3. Breakout and Confirmation:**
      Neckline breakout trading mein ek crucial role ada karta hai. Jab price neckline ko break karta hai, traders ko is breakout ko confirm karne ke liye wait karna chahiye. Agar volume bhi breakout ke saath aata hai, toh yeh confirmation signal strong hota hai aur traders ko price ke further movement ke liye plan banane mein madad deta hai.

      **4. Stop Loss Placement:**
      Neckline ko istemal kar ke traders apne stop loss placement mein bhi madad lete hain. Agar price neckline ko break karta hai, toh traders apne positions ko protect karne ke liye stop loss orders ko thik usi breakout ke opposite side rakh sakte hain. Isse risk management improve hoti hai.

      **5. Price Targets:**
      Neckline breakout ke baad, traders price targets determine karne mein bhi neckline ka istemal karte hain. Head and shoulders pattern mein for example, breakout ke baad price ka target neckline ke height ke according calculate kiya ja sakta hai.

      Neckline trading mein versatile tool hai jo traders ko patterns ko identify, confirm aur analyze karne mein madad deta hai. Iska sahi istemal kar ke, traders apne trading strategies ko improve kar sakte hain aur better trading decisions le sakte hain.
      • #4 Collapse

        Necklinetechnical analysis mein ek aham tareeka hai jo traders ko chart patterns mein support aur resistance ki levels ko identify karne mein madad karta hai. Yeh traders ko potential trend reversals, entry aur exit points, aur informed trading decisions ke liye zaruri insights deta hai.


        Neckline ke kuchh mukhya uses hain:
        • Trend reversals ko identify karna: Neckline ka break trend reversal ka signal ho sakta hai. Agar price neckline se niche ya upar jaata hai, toh yeh trend mein badlav ho sakta hai.
        • Entry aur exit points ko establish karna: Traders neckline ke break ko entry ya exit point ke roop mein use kar sakte hain. Agar price neckline se niche jaata hai, toh yeh ek short selling opportunity ho sakti hai. Agar price neckline se upar jaata hai, toh yeh ek long buying opportunity ho sakti hai.
        • Stop loss aur profit targets ko set karna: Traders neckline ke break ke basis par stop loss aur profit targets set kar sakte hain.
        Click image for larger version

Name:	images (69).jpeg
Views:	15
Size:	14.2 کلوبائٹ
ID:	13045216

        Neckline ke kuchh limitations bhi hain:
        • Neckline subjective ho sakti hai: Neckline ko draw karne ka koi ek sahi tareeka nahi hai. Traders ko apne experience aur judgement ka use karke neckline ko draw karna hoga.
        • Neckline hamesha reliable nahi hoti hai: Neckline break hamesha trend reversal ka signal nahi hoti hai. Kabhi kabhi, price neckline se break karne ke baad bhi trend continue ho sakta hai.

        Neckline ko effective tarike se use karne ke liye, yeh zaruri hai ki traders:
        • Technical analysis ki principles ko samjhe: Neckline ko technical analysis ke dusre indicators aur tools ke sath use karna chahiye.
        • Chart patterns ko identify karne mein practised ho: Neckline sirf chart patterns mein hi valid hoti hai.
        • Risk management ki strategies ko implement kare: Neckline ka use karte waqt, traders ko hamesha stop loss aur profit targets ka use karna chahiye.
        • <a href="https://www.instaforex.org/ru/?x=ruforum">InstaForex</a>
        • #5 Collapse

          ## Trading mein Neck Line ka Istemaal

          Trading dunya mein, neck line ka concept aik aham kirdar ada karta hai. Ye aik aisi line hai jo chart par support aur resistance levels ko identify karne mein madadgar hoti hai. Neck line ko samajhna aur uska sahi istimaal karna har trader ke liye faida mand ho sakta hai.

          ### Neck Line ki Tashkeel

          Neck line tab banti hai jab do ya ziada price points milte hain aur aik straight line banate hain. Ye line head and shoulders pattern aur inverse head and shoulders pattern mein bohot zyada use hoti hai. Head and shoulders pattern mein, neck line ko low points ko mila kar draw kiya jata hai jabke inverse head and shoulders pattern mein, high points ko mila kar.

          ### Trend Reversal ka Ishara

          Neck line ka sabse aham faida ye hai ke ye trend reversal ka clear signal deti hai. Jab price neck line ko cross karta hai, to ye is baat ka ishara hota hai ke market trend change hone wala hai. For example, agar price neck line ko upar ki taraf cross kare to ye bullish trend ka ishara hai aur agar neeche ki taraf cross kare to bearish trend ka.

          ### Stop Loss aur Target Levels

          Neck line ka istimaal stop loss aur target levels ko define karne mein bhi hota hai. Jab trader neck line ke neeche buy order place kare, to wo apni stop loss ko neck line ke thoda neeche rakhta hai. Isi tarah, sell order ke case mein, stop loss ko neck line ke thoda upar rakha jata hai. Ye strategy risk management mein madadgar hoti hai aur potential losses ko minimize karne mein help karti hai.

          ### Entry aur Exit Points

          Neck line ko use karte hue traders apne entry aur exit points ko accurately define kar sakte hain. Jab price neck line ko breach kare, to wo entry signal hota hai. Uske baad, price ka movement observe karna aur sahi waqt par exit lena bhi zaroori hota hai. Neck line ke upar price movement ko dekh kar trader apne profits book kar sakte hain.

          ### Psychological Impact

          Neck line ka aik psychological impact bhi hota hai. Jab price neck line ke qareeb hoti hai, to market participants zyada cautious ho jate hain. Ye line support aur resistance ka kaam karti hai aur market sentiments ko influence karti hai. Neck line ko cross karne par zyada volume aur volatility dekhne ko milti hai jo market direction ko confirm karne mein madadgar hoti hai.

          ### Conclusion

          Trading mein neck line ka sahi istimaal karna har trader ke liye zaroori hai. Ye na sirf trend reversal ka signal deti hai balki risk management aur accurate entry-exit points ko define karne mein bhi madadgar hoti hai. Trading strategies ko effective banane ke liye neck line ka concept samajhna aur uska sahi istimaal karna bohot zaroori hai.

          اب آن لائن

          Working...
          X