Dear friends Counterattack line candlestick pattern main jab creat hoti hai tou ayse main market ka reverse trend confirm hota hai ky jab market continuously aik trend ko follow karty huy movement karti hai aur aik bari candle creat hony ky badh market main next candle gap ky sath open ho ker reverse direction main movement karty huy previous candle ki closing position ky sath hi close ho jati hai tou aesy main jo pattern creat hota hai woh counterattack line candlestick pattern hota hai ky agar market kisi aik direction main bari movement ker chuki hai tou phir usi hisab sy reverse direction main bhi movement continue ker leti hai ky yeh trend reversal ki clear confirmation hoti hai jis ko follow karty huy hame reverse direction main trade open ker ky bohot achi earning ker sakty hain.
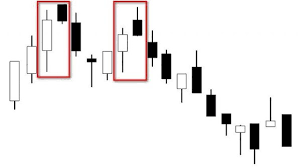
Bearish and Bullish Counterattack line candlestick pattern:
Dear forex members jab ap counterattack market candlestick pattern Ki Baat Karte Hain To ismein apko yeh candlestick just do candlestick ki formation per Milta hai aur is candlestick ko properly learn karne ke liye ap isko major to pass mein divide kar sakte hain jo ki bearish counterattack market pattern aur bullish counterattack candlestick pattern ho sakte hain.
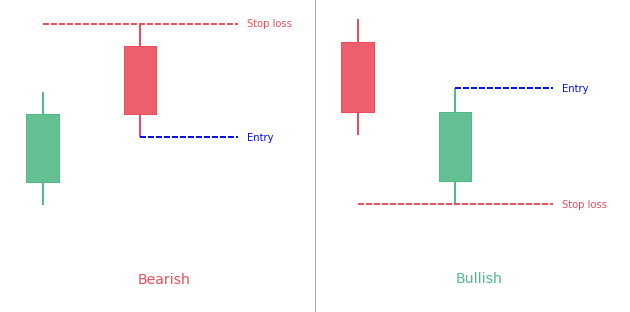
Bearish Counterattack Patterns.
Bullish Counterattack Patterns.
Explanation of Counterattack line candlestick pattern:
Dear sisters and brothers Counterattack line candlesticks pattern bi ek bohot ehm indicators hy jis se hame market ki movement show hoti hy aur ham thek tareky se andaza kar lety hain ke currency pair ko buy karna hy ya sell karna hy , is kaliy ek to hamen bohot zyada mehnat karna pary ge takeh ham is tool aur is indicators ko achy tareky se samaja saken .isko samajna bht mushkil hy yeh ek tarah ka technical analysis hota hy jo keh bht ziada complex hota hy . is se professional traders bi andaza laga lety hain market buy ki traf j arhe hy ya market sell ki traf ja rhe hy . is lye hamen chahye keh aagar ham isko thek tarah se samkjen gy to is se ham apni trade ko secure kar saken gy ,is trah ke indicators me market trend reverse bu show ho sakta hy aur forward bi show ho sakta hy . jb bi market me up gtred shro hota hy aur ek line close ho jati hy to dosri line ek gap ke sath open hoti hy .yeh gap kuch is tarah se banta hy keh bearish candle aur ballish candle ek dosry ke sath ek he point py a kar mil jaty hain .jaisy he yeh ek pooint py a kar milty hain to usi time me jo trend hamen dehkny ko milta hy us me silling traders bohot zyada hoty hain kyu ke is time dosri candles ek he point py mili hoti hy . aur yeh bohot yakini baat hy keh market apni trend selling me e lay kar ja raha hota hy . aur agar dono candlestick ek dosry se ek point py ni milty to is sorat me trend buying ka e show hota hy aur market buy currency pair ki taraf he jati hy.
Bearish and Bullish Counterattack line candlestick pattern:
Dear forex members jab ap counterattack market candlestick pattern Ki Baat Karte Hain To ismein apko yeh candlestick just do candlestick ki formation per Milta hai aur is candlestick ko properly learn karne ke liye ap isko major to pass mein divide kar sakte hain jo ki bearish counterattack market pattern aur bullish counterattack candlestick pattern ho sakte hain.
Bearish Counterattack Patterns.
Bullish Counterattack Patterns.
Explanation of Counterattack line candlestick pattern:
Dear sisters and brothers Counterattack line candlesticks pattern bi ek bohot ehm indicators hy jis se hame market ki movement show hoti hy aur ham thek tareky se andaza kar lety hain ke currency pair ko buy karna hy ya sell karna hy , is kaliy ek to hamen bohot zyada mehnat karna pary ge takeh ham is tool aur is indicators ko achy tareky se samaja saken .isko samajna bht mushkil hy yeh ek tarah ka technical analysis hota hy jo keh bht ziada complex hota hy . is se professional traders bi andaza laga lety hain market buy ki traf j arhe hy ya market sell ki traf ja rhe hy . is lye hamen chahye keh aagar ham isko thek tarah se samkjen gy to is se ham apni trade ko secure kar saken gy ,is trah ke indicators me market trend reverse bu show ho sakta hy aur forward bi show ho sakta hy . jb bi market me up gtred shro hota hy aur ek line close ho jati hy to dosri line ek gap ke sath open hoti hy .yeh gap kuch is tarah se banta hy keh bearish candle aur ballish candle ek dosry ke sath ek he point py a kar mil jaty hain .jaisy he yeh ek pooint py a kar milty hain to usi time me jo trend hamen dehkny ko milta hy us me silling traders bohot zyada hoty hain kyu ke is time dosri candles ek he point py mili hoti hy . aur yeh bohot yakini baat hy keh market apni trend selling me e lay kar ja raha hota hy . aur agar dono candlestick ek dosry se ek point py ni milty to is sorat me trend buying ka e show hota hy aur market buy currency pair ki taraf he jati hy.
تبصرہ
Расширенный режим Обычный режим