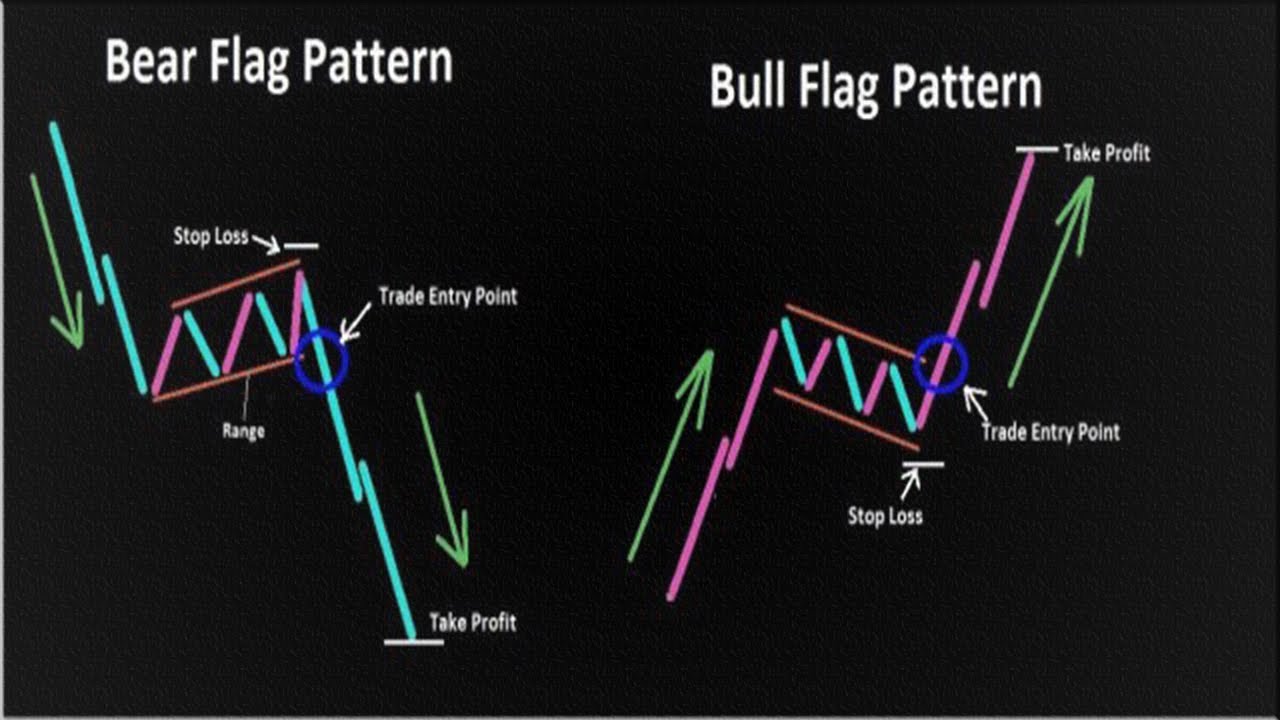
Flag candlestick chart pattern aik tasalsul ka pattern hai jo is waqt bantaa hai jab market mazboot up trained ya down trained ke baad tawaquf laita hai. Is waqfay ki numaindagi aik mazbooti ki muddat se hoti hai, jis ke douran qeemat aik tang range mein muntaqil hoti hai. Mazbooti ki muddat chhootey haqeeqi jismon ke sath shama daan ki aik series ki khasusiyat hai, aur usay aksar pattern ke parcham walay hissay ke tor par kaha jata hai. Pattern ka parcham wala hissa pichlle rujhan ke tasalsul ke baad aata hai, jis ki numaindagi mukhalif simt mein aik mazboot harkat se hoti hai. Yeh harkat aam tor par lambay asli jism ke sath aik barri mom batii ki taraf se khususiyaat hai, aur usay aksar pattern ka qutub hissa kaha jata hai. Pattern ke qutbi hissay mein misali tor par qeemat ka hadaf hona chahiye jo parcham walay hissay ki lambai ke barabar ho.
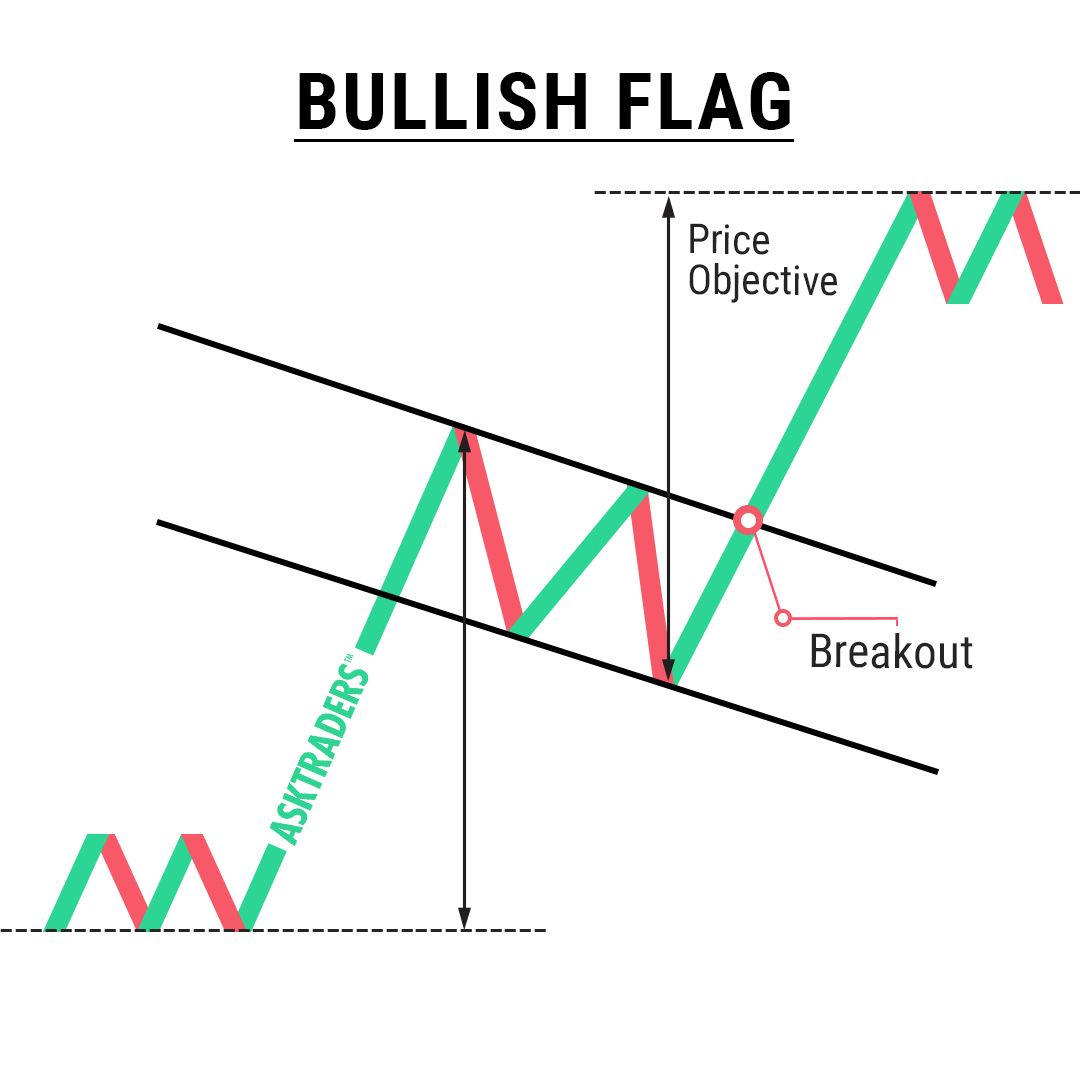
Bullish Flag Candlestick Chart Pattern
Aik blush flag candlestick chart pattern mazboot up trained ke baad bantaa hai, aur is ki khasusiyat aik consolidation period se hoti hai jis ke baad up trained ka tasalsul hota hai. Pattern ka parcham wala hissa chhootey jism walay shama daan ki aik series se bantaa hai jo do matawazi trained lines mein mojood hotay hain. Yeh trained lines consolidation ki muddat ke liye support aur muzahmati sthon ki numaindagi karti hain. Pattern ka qutbi hissa pichlle up trained ki terhan isi simt mein aik mazboot harkat se bantaa hai. Is iqdaam mein misali tor par qeemat ka hadaf hona chahiye jo parcham walay hissay ki lambai ke barabar ho. Tajir aksar pattern ke qutbi hissay ke douran aala tijarti hajam ke zariye taizi ke jhanday ke pattern ki tasdeeq talaash karte hain.
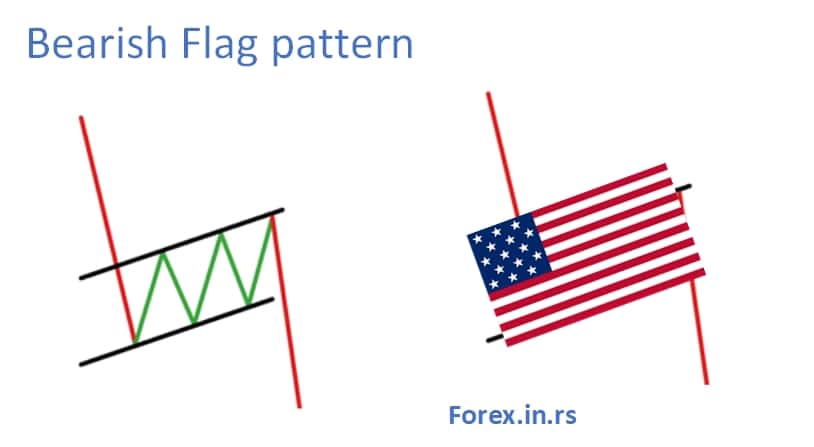
Bearish Flag Candlestick Chart Pattern
Aik bearish flag candlestick chart pattern mazboot kami ke rujhan ke baad bantaa hai, aur is ki khasusiyat aik mazbooti ki muddat hai jis ke baad neechay ka rujhan jari rehta hai. Pattern ka parcham wala hissa chhootey jism walay shama daan ki aik series se bantaa hai jo do matawazi trained lines mein mojood hotay hain. Yeh trained lines consolidation ki muddat ke liye support aur muzahmati sthon ki numaindagi karti hain. Pattern ka qutbi hissa pichlle neechay ke rujhan ki terhan isi simt mein aik mazboot harkat se bantaa hai. Is iqdaam mein misali tor par qeemat ka hadaf hona chahiye jo parcham walay hissay ki lambai ke barabar ho. Tajir aksar pattern ke qutbi hissay ke douran aala tijarti hajam ke zariye bearish flag pattern ki tasdeeq talaash karte hain.
Bullish Flag Candlestick Chart Pattern
Aik blush flag candlestick chart pattern mazboot up trained ke baad bantaa hai, aur is ki khasusiyat aik consolidation period se hoti hai jis ke baad up trained ka tasalsul hota hai. Pattern ka parcham wala hissa chhootey jism walay shama daan ki aik series se bantaa hai jo do matawazi trained lines mein mojood hotay hain. Yeh trained lines consolidation ki muddat ke liye support aur muzahmati sthon ki numaindagi karti hain. Pattern ka qutbi hissa pichlle up trained ki terhan isi simt mein aik mazboot harkat se bantaa hai. Is iqdaam mein misali tor par qeemat ka hadaf hona chahiye jo parcham walay hissay ki lambai ke barabar ho. Tajir aksar pattern ke qutbi hissay ke douran aala tijarti hajam ke zariye taizi ke jhanday ke pattern ki tasdeeq talaash karte hain.
Bearish Flag Candlestick Chart Pattern
Aik bearish flag candlestick chart pattern mazboot kami ke rujhan ke baad bantaa hai, aur is ki khasusiyat aik mazbooti ki muddat hai jis ke baad neechay ka rujhan jari rehta hai. Pattern ka parcham wala hissa chhootey jism walay shama daan ki aik series se bantaa hai jo do matawazi trained lines mein mojood hotay hain. Yeh trained lines consolidation ki muddat ke liye support aur muzahmati sthon ki numaindagi karti hain. Pattern ka qutbi hissa pichlle neechay ke rujhan ki terhan isi simt mein aik mazboot harkat se bantaa hai. Is iqdaam mein misali tor par qeemat ka hadaf hona chahiye jo parcham walay hissay ki lambai ke barabar ho. Tajir aksar pattern ke qutbi hissay ke douran aala tijarti hajam ke zariye bearish flag pattern ki tasdeeq talaash karte hain.
تبصرہ
Расширенный режим Обычный режим