Relative Vigor Index Indicator (RVI)
X
  • وقت
  • دکھائیں
Clear All
new posts
  • #1 Collapse

    Relative Vigor Index Indicator (RVI)
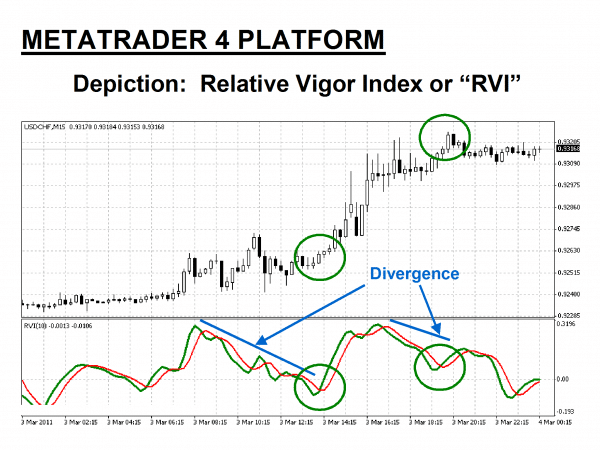
    Introduction to Relative Vigor Index Indicator
    Relative Vigor Index (RVI) ik technical indicator ha go technical analysis krny mn use kia jata ha. Ye indicator traders ko trend ke strength calculate krny k moqay deta ha. Traders current closing price ko trading range say compare kr k iski calculations krty hain aur isko trend ke strength measure krny k liye use krty hain aur achi trading k liye use krty hain. Relative Vigor index market mn kam karty howe aap ko ik indicator dia jata hai. Aap kisi bhi broker mein is ko istemal kar skty hain aur aap is ky zariye market mein trends ky bry mn useful information lety howe isko analysis ka hisab bna skty hain aur apni trades is ko use kar k lgaty hain. Market mn dusry indicator ke trha RVI b bhut important indicator hai.

    Click image for larger version

Name:	RVI.jpg
Views:	11
Size:	38.1 کلوبائٹ
ID:	12598131


    Relative Vigor Index Indicator ki Tafseeli Wazahat


    Relative vigor index ko use karaty rehna chahiay additionally Kam k contest can also additionally postingkartay hay to appko apni gettingto know talents kogrowth kartay hoye posting karniparti hay.jab haum contest canalso additionally am nai hotay hay haumay postings kinice pay zayada cognizance kartay hoyecontest can also additionally postskarni chahiye aur apnayinformation ko enhance kartay rehna chahiyeThe RVI Indicator is calculated by comparing the current closing price with the previous closing price, and then calculating the difference between the two. This difference is then divided by the range of the price over the same period, which is typically a 10-day period. The result is a ratio that is then smoothed using an exponential moving average (EMA) to provide a more reliable trend indicator

    Click image for larger version

Name:	images - 2023-03-08T160103.864.jpeg
Views:	3
Size:	53.5 کلوبائٹ
ID:	12598132

    RVI Oscillator ka Trading main Istamal


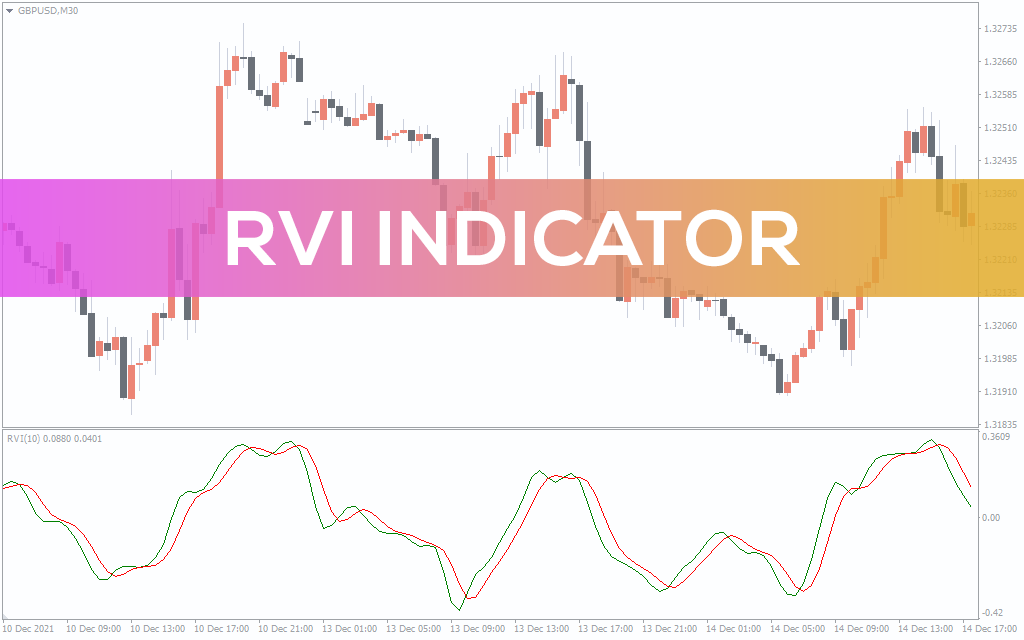
    The Relative Vigor Index (RVI) is a technical indicator used in financial analysis to measure the strength of a trend in a particular security or asset. The RVI is calculated by comparing the closing price of a security to its opening price, with the difference being divided by the range of the security for that period.The RVI integrator is a method of smoothing out the RVI indicator over a period of time to better identify trends and minimize false signals. This is typically achieved by taking a moving average of the RVI over a specified time period, which can help to reduce the impact of short-term fluctuations and noise in the data.

    Click image for larger version

Name:	images (3).jpeg
Views:	2
Size:	42.7 کلوبائٹ
ID:	12598133


    RVI Oscillator ka Working Principle


    Relative vigor index indicator asset ki close price ka recent price range Se mavaj Na karta hai aur price ki nakalo Harkat Ke Piche takat ki value Paida Karta Hai yah jitni Jyada value Paida Karega friend itna hi strong Hona chahie dusri Taraf Lo aur relative vigor index value Ek Purush sukun aur sideways market ko jahir Karti Hai relative vigor index indicator value Paida Karta Hai Jo Kabhi Kabhi Upar aur down levels ke kareeb trading Karti Hai relative vigor index indicator relative strength index indicator Ki Tarah trend ki Simat Mein change ka immun hai jo darasal iski Sabse Badi takat Hai dusri Taraf relative figure index indicator se Lekh important weakness yah hai ki yah range market Mein Amali Taur per bekar Hai Jab price action figure index indicator Se mashvara Karte Hain Jab price action Upar ya down ki taraf friend Mein Lambe arse Tak trading Karta Hai Kyunki vah karne ki koshish Karte Hain ke maujuda trend kab khatm hoga.
    Click image for larger version

Name:	relative-vigor-index_pre1.png
Views:	3
Size:	87.7 کلوبائٹ
ID:	12598134
  • <a href="https://www.instaforex.org/ru/?x=ruforum">InstaForex</a>
  • #2 Collapse

    Re: Relative Vigor Index Indicator (RVI)

    Description:

    The the relative index is an oscillator based on the concept that prices 10 to close higher than they open in UP Trends and close lower than they open in down trends basically it is an oscillator that is in face with the cycle of underlying price.
    how how this indicator works?
    divergence between the r v i and the price action Mein Signal divergence between the r v i and the price action Mein Signal a change in the trend in a friends potential by opportunity is occur when the RBI crosses above its signal line. In In the down transportentional short shares in the down transportentional short shares opportunities occur in the down transportentional short shares opportunities occur when the in the down transportentional short shares opportunities occur when the RBI in the down transportentional short shares opportunities occur when the RBI crosses below in the down transportentional short shares opportunities occur when the RBI crosses below its signal line.
    This is basically the technical analysis of the market technical analysis focuses on market action significantly and specifically on volume and prices technical analysis is only one approach to analyse talks when considering which stock to buy ourself you should use the approach that you are most comfortable with as with all your investment you must make your own determination as weather and investment in a particular security or security is right for you based investment objectives risk tolerance and investment objectives risk tolerance and financial situation pause performance has no guarantee of future results so always try to analyse the whole market before you start putting your investment in the market a market has many ups and downs so be careful well analysing it with different type of analysis and flowchart
    • #3 Collapse

      Re: Relative Vigor Index Indicator (RVI)

      Exchanging Procedures RVI.

      RVI Signal Line Crosses:-
      RVI signal line crosses ek famous exchanging method hai. Hit RVI ki signal line RVI ki primary line ko upar se cross karti hai toh yeh ek purchase signal hota hai. Aur punch RVI ki signal line RVI ki principal line ko neeche se cross karti hai toh yeh ek sell signal hota hai. Yeh signals dealers ko sahi waqt standard exchanging positions enter aur exit karne mein madad karte hain.

      Dissimilarity:-
      Uniqueness RVI ka ek strong sign hai. Agar market bullish pattern mein hai aur RVI worse low points banata hai toh yeh ek negative uniqueness signal hai. Aur agar market negative pattern mein hai aur RVI better upsides banata hai toh yeh ek bullish dissimilarity signal hai. Difference signals ko merchants ko market patterns ko samajhne mein aur sahi exchanging choices lene mein madad karte hain.

      Overbought and Oversold Levels:-
      RVI ke overbought aur oversold levels ko istemal karke merchants sahi waqt standard exchanging positions enter aur exit kar sakte hain. Agar RVI ka result 0 se 1 tak ka hota hai toh yeh demonstrate karta hai ke market areas of strength for mein pattern hai aur agar RVI ka result 0 se - 0.4 tak hota hai toh yeh show karta hai ke market mein negative pattern hai. Agar market overbought hai toh dealers short positions enter kar sakte hain aur agar market oversold hai toh brokers long positions enter kar sakte hain.


      RVI and Moving Midpoints:
      RVI ke signals ko moving midpoints ke saath affirm karke brokers sahi exchanging choices lene mein madad mil sakti hai. Punch RVI moving normal ko cross karta hai toh yeh ek solid sign hai. Agar RVI ki primary line moving normal ko upar se cross karti hai toh yeh ek purchase signal hai aur agar RVI ki principal line moving normal ko neeche se cross karti hai toh yeh ek sell signal hai.
      RVI and MACD:
      RVI ke signals ko MACD ke saath affirm karke dealers sahi exchanging choices lene mein madad mil sakti hai. Hit RVI MACD ko cross karta hai toh yeh ek solid sign hai. Agar RVI ki principal line MACD ko upar se cross karti hai toh yeh ek purchase signal hai aur agar RVI ki fundamental line MACD ko neeche se cross karti hai toh yeh ek sell signal hai.


      RVI Marker PARAMETRS

      RVI ke liye kuch boundaries hai, jo dealers ko sahi waqt standard exchanges enter aur exit karne mein madad karte hain. In boundaries ki jaankari brokers ko honi chahiye, taaki woh RVI ka sahi istemal kar sakein.

      Time period:
      RVI ka time period dealer ke exchanging objectives aur procedure standard depend karta hai. Agar koi dealer transient exchanging karta hai toh woh chote time period jaise ki 5-minute, 15-minute ya 30-minute ka istemal karega. Lekin agar koi broker long haul exchanging karta hai toh woh bade time period jaise ki everyday, week by week ya month to month ka istemal karega. RVI ke time span ko select karte waqt merchant ko apne exchanging objectives aur procedure ko dhyan mein rakhna chahiye.
      Periods:
      RVI ke periods ke choice ke liye dealers ko market unpredictability ko samajhna chahiye. Agar market unstable hai toh brokers brief periods jaise ki 10, 14 ya 20 ka istemal kareinge. Lekin agar market stable hai toh dealers extensive stretches jaise ki 30, 40 ya 50 ka istemal kareinge. Periods ke determination mein market ki liquidity aur unpredictability ko bhi consider karna significant hai.
      Overbought and Oversold Levels:
      RVI ke overbought aur oversold levels ki information dealers ke liye significant hai. RVI ka result 0 se 1 tak ka hota hai. Agar RVI ka result 0.4 se 1 tak hota hai toh yeh demonstrate karta hai ke market areas of strength for mein pattern hai. Aur agar RVI ka result 0 se - 0.4 tak hota hai toh yeh show karta hai ke market mein negative pattern hai. Lekin agar RVI ka result 0.4 se - 0.4 ke beech mein hai toh yeh demonstrate karta hai ke market sidewise hai. Dealers ko RVI ke overbought aur oversold levels ko istemal karke sahi waqt standard exchanges enter aur exit karna chahiye.


      • <a href="https://www.instaforex.org/ru/?x=ruforum">InstaForex</a>
      • #4 Collapse

        Re: Relative Vigor Index Indicator (RVI)

        Relative Vigor Index indicator:

        Relative Life File (RVI) Marker ek specialized examination device hai jo cost energy aur pattern ki strength ko measure karta hai. Yeh pointer force oscillators ki family mein aata hai jo market patterns ko decide karne mein help karte hain. RVI Marker ko StockCharts.com ke pioneer John Ehlers ne create kiya tha. Yeh marker cost ki instability aur exchanging volume ko consider karta hai, jisse ki market ke fundamental patterns ko survey karne mein help karta hai.Relative Life File (RVI) ek specialized examination marker hai, jo market patterns ke investigation ke liye istemal hota hai. RVI energy oscillator ki tarah kaam karta ha


        Relative Life File (RVI) ik specialized marker ha jo specialized investigation krny mn use kia jata ha. Ye pointer dealers ko pattern ke strength ascertain krny k moqay deta ha. Brokers current shutting cost ko exchanging range say analyze kr k iski estimations krty hain aur isko pattern ke strength measure krny k liye use krty hain aur achi exchanging k liye use krty hain. Relative Life record market mn kam karty howe aap ko ik marker dia jata hai. Aap kisi bhi representative mein is ko istemal kar skty hain aur aap is ky zariye market mein patterns ky bry mn helpful data lety howe isko examination ka hisab bna skty hain aur apni exchanges is ko use kar k lgaty hain. Market mn dusry marker ke trha RVI b bhut significant pointer hai.


        Indicator Formation:

        file pointer resource ki close cost ka late cost range Se mavaj Na karta hai aur cost ki nakalo Harkat Ke Piche takat ki esteem Paida Karta Hai yah jitni Jyada esteem Paida Karega companion itna hello solid Hona chahie dusri Taraf Lo aur relative life record esteem Ek Purush sukun aur sideways market ko jahir Karti Hai relative force record marker esteem Paida Karta Hai Jo Kabhi Upar aur down levels ke kareeb exchanging Karti Hai relative power list marker relative strength file marker Ki Tarah pattern ki Simat Mein change ka immun hai jo darasal iski Sabse Badi takat Hai dusri Taraf relative figure list pointer se Lekh significant shortcoming yah hai ki yah range market Mein Amali Taur per bekar Hai Punch cost activity figure list pointer Se mashvara Karte Hain Hit cost activity Upar ya down ki taraf companion Mein Lambe arse Tak exchanging Karta Hai


        Sabse pehle aapko current cost aur past cost ke beech ka rate change ascertain karna hoga. Isko aap basic rate change equation se compute kar sakte hain Iske baad aapko relative strength ko ascertain karna hoga. Iske liye aapko 10-period SMA (Basic Moving Normal) ka use karna hoga:Relative Strength = (10-period SMA of Value Change)/(10-period SMA of Outright Value Change) At long last, aap RVI ko compute kar sakte hain. Iske liye aapko Smoothed Relative Strength ke 4-period EMA (Dramatic Moving Normal) ka use karna hoga:Iske baad aapko relative strength ko smooth karna hoga. Iske liye aapko 4-period SMA ka use karna hoga:Smoothed Relative Strength = 2 (4-period SMA of Relative Strength) - (4-period SMA of 4-period SMA of Relative Strength)


        Indicator Types And Identification:

        RVI Marker ka use pattern bearing aur force ke assurance ke liye kiya jata hai. RVI Pointer 0 se 100 territory mein hota hai, jahaan 0 se 30 ke beech ki values negative pattern aur 70 se 100 ke beech ki values bullish pattern ko show karti hain. RVI Pointer ka use merchants aur financial backers dwara kiya jata hai jo market patterns ko dissect karne ke liye kisi specialized examination instrument ki zarurat mehsus karte hain.Iske alawa, RVI Marker ka use bhi kiya jata hai pattern inversions aur pattern continuations ko distinguish karne ke liye. Agar RVI Pointer ki esteem 50 ke upar hai, toh yeh bullish pattern ko affirm karti hai aur dealers ko long positions lena chahiye. Aur agar RVI Marker ki esteem 50 se kam hai, toh yeh negative pattern ko affirm karti hai aur brokers ko short positions lena chahiye.


        RVI = (Close - Open)/(High - Low) Is recipe mein "Close" current candle ka shutting cost hai, "Open" current light ka opening cost hai, "High" current candle ka greatest cost hai aur "Low" current flame ka most reduced cost hai. RVI ka result ek number hota hai, jo zero se ek tak ki range mein hota hai.Agar RVI ka result zero ke kareeb hota hai to yeh demonstrate karta hai ke market mein koi bhi pattern nahi hai aur sideways development hai. Agar RVI ka result 0.4 se 0.6 ke beech hota hai to yeh solid bullish pattern show karta hai. Aur agar RVI ka result 0.4 se kam ya fir - 0.4 se kam hota hai to yeh negative pattern show karta hai.


        Trading view:

        RVI ke overbought aur oversold levels ki information dealers ke liye significant hai. RVI ka result 0 se 1 tak ka hota hai. Agar RVI ka result 0.4 se 1 tak hota hai toh yeh demonstrate karta hai ke market areas of strength for mein pattern hai. Aur agar RVI ka result 0 se - 0.4 tak hota hai toh yeh demonstrate karta hai ke market mein negative pattern hai. Lekin agar RVI ka result 0.4 se - 0.4 ke beech mein hai toh yeh show karta hai ke market sidewise hai. Brokers ko RVI ke overbought aur oversold levels ko istemal karke sahi waqt standard exchanges enter aur exit karna chahiye.RVI ke periods ke choice ke liye dealers ko market unpredictability ko samajhna chahiye. Agar market unpredictable hai toh dealers brief periods jaise ki 10, 14 ya 20 ka istemal kareinge. Lekin agar market stable hai toh merchants significant stretches jaise ki 30, 40 ya 50 ka istemal kareinge.


        RVI ke signals ko decipher karke brokers exchanging positions exit kar sakte hain. Agar market bullish pattern mein hai aur RVI ka signal line RVI ki principal line ko neeche se cross karti hai toh yeh ek leave signal hota hai. Aur agar market negative pattern mein hai aur RVI ka signal line RVI ki primary line ko upar se cross karti hai toh yeh ek leave signal hota hai. Brokers ko RVI ke signals ko affirm karne ke liye dusre specialized markers ka bhi istemal karna chahiye. Isse merchants ko sahi waqt standard leave positions lene mein madad mil sakti hai. signals ko decipher karke dealers exchanging positions enter kar sakte hain. Agar RVI ka signal line RVI ki primary line ko upar se cross karta hai toh yeh ek purchase signal hota hai aur agar RVI ka signal line RVI ki fundamental line ko neeche se cross karta hai toh yeh ek sell signal hota hai. Agar market bullish pattern mein hai toh brokers purchase positions enter kar sakte hain aur agar market negative pattern mein hai toh dealers sell positions enter kar sakte hain.

        اب آن لائن

        Working...
        X