Triple Bottom Chart Pattern
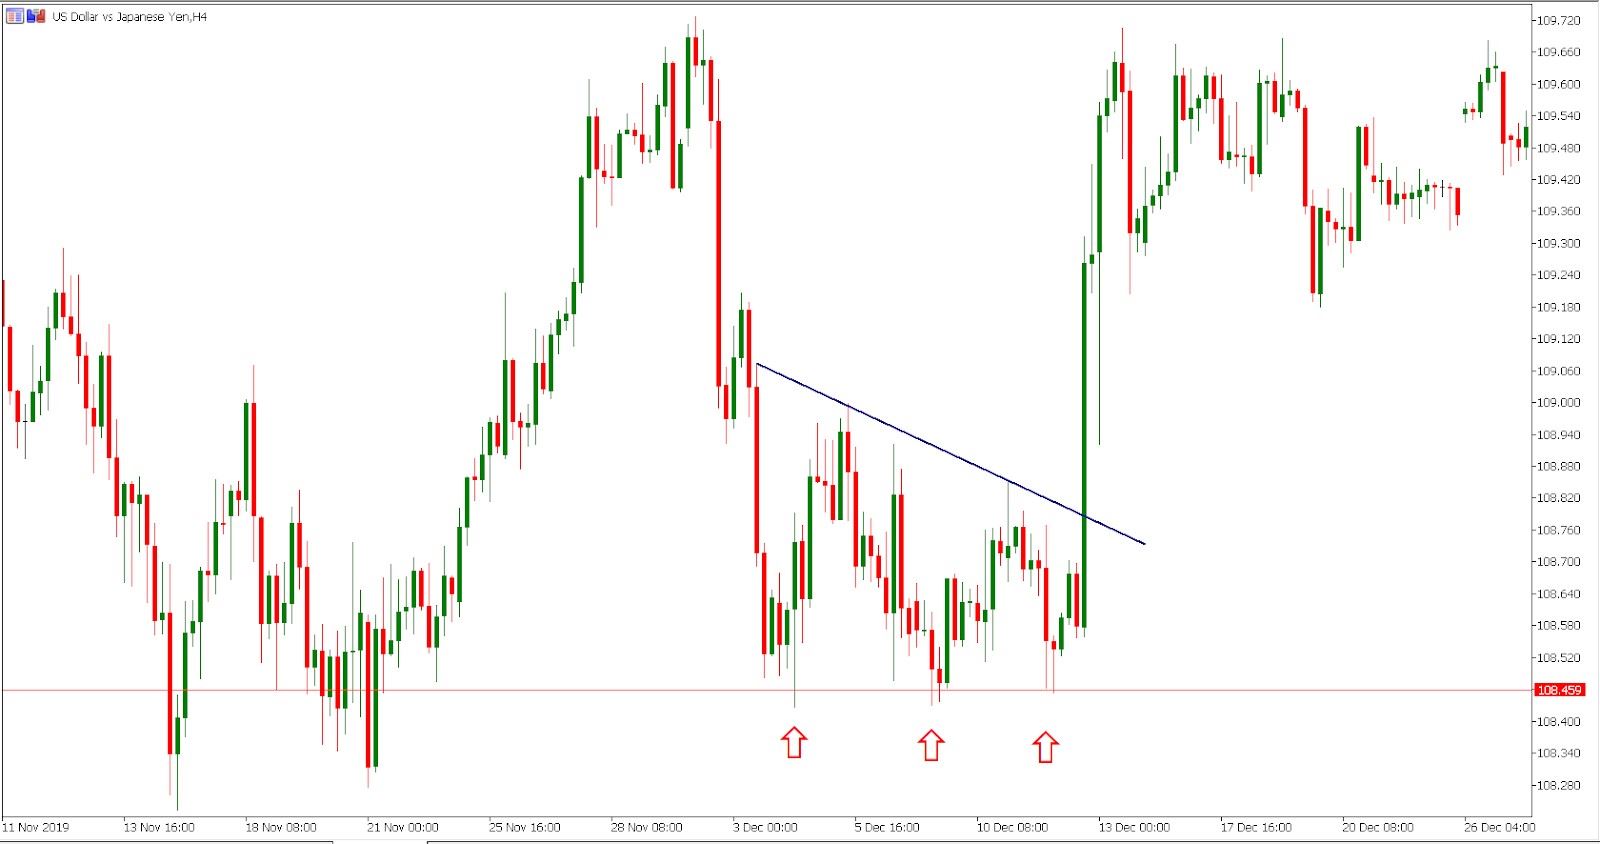
Triple Bottom chart patteren aik taizi se reversal patteren hai jo neechay ke rujhan mein ho sakta hai. yeh teen lovs se bantaa hai jo qeemat mein taqreeban barabar hain, darmiyan mein do pal bacchus hotay hain. patteren mukammal hota hai jab qeemat muzahmat ki satah se oopar toot jati hai jo teen kmon ke darmiyan oonchai se banti hai .
Teen kam qeematon ki nisbatan tang range mein waqay honay chahiye, aur doosri kam ko pehli kam ko nahi torna chahiye. neechay ke darmiyan pal bacchus kam hona chahiye, jo is baat ki nishandahi karta hai ke khredar agay barh rahay hain aur qeemat ko mazeed girnay se rokkk rahay hain .
Patteren mukammal hojane ke baad, tajir teen kmon ke darmiyan oonchai se ban'nay wali muzahmati satah se oopar totnay ka intzaar karkay ulat jane ki tasdeeq talaash karte hain. yeh break out mazboot hajam ke sath hona chahiye, jis se zahir hota hai ke khredar control mein hain .
Patteren ke liye qeemat ka hadaf rizstns level se lovs tak faaslay ki pemaiesh karkay aur usay break out point mein shaamil karkay lagaya jata hai. is se taajiron ko andaza hota hai ke naye up trained mein qeemat mumkina tor par kis had tak barh sakti hai .
Yeh note karna zaroori hai ke tamam triple bottom patteren ka nateeja kamyaab ulat nahi hota hai. taajiron ko ulat ki tasdeeq karne ke liye deegar takneeki aur bunyadi asharion ko talaash karna chahiye aur is ke mutabiq –apne khatray ka intizam karna chahiye .

Trading with Triple Bottom Chart Pattern
Triple Bottom chart patteren ke sath tijarat mein patteren ki nishandahi karna, tasdeeq ka intzaar karna, aur phir break out ki bunyaad par tijarat ko injaam dena shaamil hai .
Triple Bottom chart patteren ke sath tijarat karne ke iqdamaat yeh hain :
Patteren ki shanakht karen : teen lagataar kmyan talaash karen jo qeemat mein taqreeban barabar hain, darmiyan mein do pal bacchus ke sath. patteren mukammal hota hai jab qeemat muzahmat ki satah se oopar toot jati hai jo teen kmon ke darmiyan oonchai se banti hai .
Tasdeeq ka intzaar karen : mazboot hajam ke sath qeemat ke muzahmati satah se oopar totnay ka intzaar karen, yeh zahir karta hai ke khredar control mein hain. yeh break out reversal ki tasdeeq karta hai aur mumkina izafay ka ishara deta hai .
Tijarat darj karen : break out point par ya muzahmati satah se qadray oopar aik lambi position ( khareed ) darj karen. khatray ka intizam karne ke liye patteren ke sab se kam nichale darjay se neechay stap nuqsaan set karen .
Munafe ka hadaf muqarrar karen : munafe ke hadaf ka hisaab muzahmat ki satah se kam tak faaslay ki pemaiesh karkay aur usay break out point mein shaamil karkay lagaya jata hai. is se taajiron ko andaza hota hai ke naye up trained mein qeemat mumkina tor par kis had tak barh sakti hai. is hisaab ki bunyaad par munafe ka hadaf muqarrar karen ya mumkina qeemat ke hadaf ka taayun karne ke liye deegar takneeki isharay istemaal karen .
Tijarat ka intizam karen : jaisay jaisay tijarat agay barhti hai, qeemat ki karwai ki nigrani karen aur zaroorat ke mutabiq nuqsaan aur munafe ke hadaf ko adjust karen. traders dosray takneeki isharay bhi istemaal kar satke hain jaisay moving averages , trained lines, aur oscilator up trained ki tasdeeq aur tijarat ko munazzam karne ke liye .
Yeh yaad rakhna zaroori hai ke tamam triple bottom patteren ka nateeja kamyaab ulat nahi hota hai. taajiron ko hamesha deegar takneeki aur bunyadi isharay istemaal karne chahiye taakay ulat ki tasdeeq ki jasakay aur is ke mutabiq –apne khatray ka intizam kya jaye .

Triple Bottom chart patteren aik taizi se reversal patteren hai jo neechay ke rujhan mein ho sakta hai. yeh teen lovs se bantaa hai jo qeemat mein taqreeban barabar hain, darmiyan mein do pal bacchus hotay hain. patteren mukammal hota hai jab qeemat muzahmat ki satah se oopar toot jati hai jo teen kmon ke darmiyan oonchai se banti hai .
Teen kam qeematon ki nisbatan tang range mein waqay honay chahiye, aur doosri kam ko pehli kam ko nahi torna chahiye. neechay ke darmiyan pal bacchus kam hona chahiye, jo is baat ki nishandahi karta hai ke khredar agay barh rahay hain aur qeemat ko mazeed girnay se rokkk rahay hain .
Patteren mukammal hojane ke baad, tajir teen kmon ke darmiyan oonchai se ban'nay wali muzahmati satah se oopar totnay ka intzaar karkay ulat jane ki tasdeeq talaash karte hain. yeh break out mazboot hajam ke sath hona chahiye, jis se zahir hota hai ke khredar control mein hain .
Patteren ke liye qeemat ka hadaf rizstns level se lovs tak faaslay ki pemaiesh karkay aur usay break out point mein shaamil karkay lagaya jata hai. is se taajiron ko andaza hota hai ke naye up trained mein qeemat mumkina tor par kis had tak barh sakti hai .
Yeh note karna zaroori hai ke tamam triple bottom patteren ka nateeja kamyaab ulat nahi hota hai. taajiron ko ulat ki tasdeeq karne ke liye deegar takneeki aur bunyadi asharion ko talaash karna chahiye aur is ke mutabiq –apne khatray ka intizam karna chahiye .
Trading with Triple Bottom Chart Pattern
Triple Bottom chart patteren ke sath tijarat mein patteren ki nishandahi karna, tasdeeq ka intzaar karna, aur phir break out ki bunyaad par tijarat ko injaam dena shaamil hai .
Triple Bottom chart patteren ke sath tijarat karne ke iqdamaat yeh hain :
Patteren ki shanakht karen : teen lagataar kmyan talaash karen jo qeemat mein taqreeban barabar hain, darmiyan mein do pal bacchus ke sath. patteren mukammal hota hai jab qeemat muzahmat ki satah se oopar toot jati hai jo teen kmon ke darmiyan oonchai se banti hai .
Tasdeeq ka intzaar karen : mazboot hajam ke sath qeemat ke muzahmati satah se oopar totnay ka intzaar karen, yeh zahir karta hai ke khredar control mein hain. yeh break out reversal ki tasdeeq karta hai aur mumkina izafay ka ishara deta hai .
Tijarat darj karen : break out point par ya muzahmati satah se qadray oopar aik lambi position ( khareed ) darj karen. khatray ka intizam karne ke liye patteren ke sab se kam nichale darjay se neechay stap nuqsaan set karen .
Munafe ka hadaf muqarrar karen : munafe ke hadaf ka hisaab muzahmat ki satah se kam tak faaslay ki pemaiesh karkay aur usay break out point mein shaamil karkay lagaya jata hai. is se taajiron ko andaza hota hai ke naye up trained mein qeemat mumkina tor par kis had tak barh sakti hai. is hisaab ki bunyaad par munafe ka hadaf muqarrar karen ya mumkina qeemat ke hadaf ka taayun karne ke liye deegar takneeki isharay istemaal karen .
Tijarat ka intizam karen : jaisay jaisay tijarat agay barhti hai, qeemat ki karwai ki nigrani karen aur zaroorat ke mutabiq nuqsaan aur munafe ke hadaf ko adjust karen. traders dosray takneeki isharay bhi istemaal kar satke hain jaisay moving averages , trained lines, aur oscilator up trained ki tasdeeq aur tijarat ko munazzam karne ke liye .
Yeh yaad rakhna zaroori hai ke tamam triple bottom patteren ka nateeja kamyaab ulat nahi hota hai. taajiron ko hamesha deegar takneeki aur bunyadi isharay istemaal karne chahiye taakay ulat ki tasdeeq ki jasakay aur is ke mutabiq –apne khatray ka intizam kya jaye .

تبصرہ
Расширенный режим Обычный режим