Symmetrical Triangle Chart Pattern
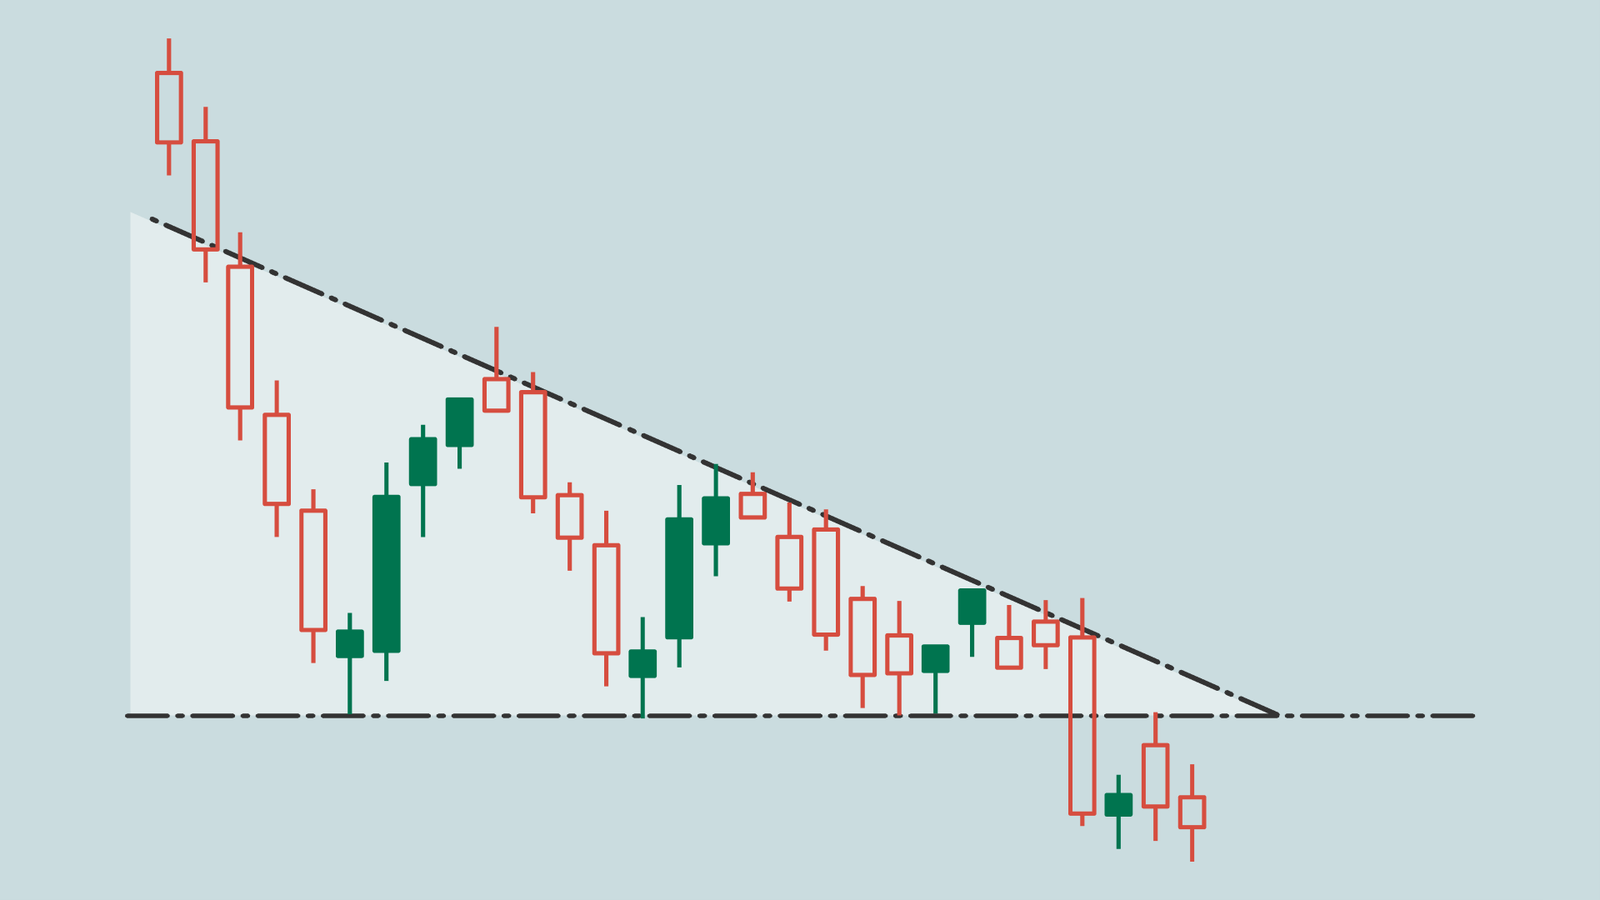
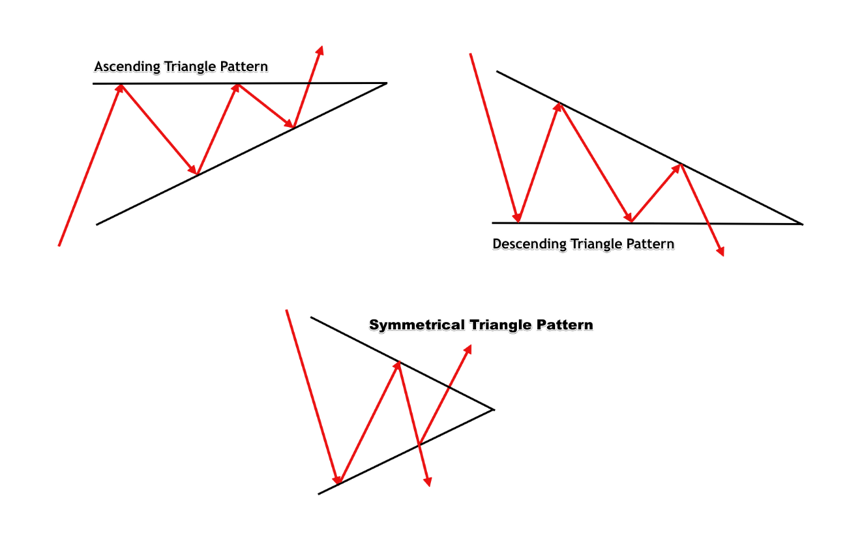
Symmetrical Triangle Chart Pattern ak consolidation pattern ha, jis man market price ki movement man continuosly decrease ata ha aur last man price bhot tazi sa fall ya up jati ha.A symmetrical triangle is a common chart pattern in technical analysis, often used to help predict potential breakouts in stock prices. It is formed by two trendlines that converge towards each other, with both lines having equal slopes. This creates a triangle shape that becomes narrower over time as the price range narrows. The pattern can be bullish or bearish, depending on the direction of the breakout.

Symmetrical Triangle Charts Pattern ki Wazahat
Symmetrical triangle chart pattren main kaaam karna hain tu forex trading ko samjhy forex trading main pratice kare forex trading main learning strong nhe hoti hain tu kabi b Symmetrical triangle chart pattren ki samjh nhe aati hain forex trading main learning karna must hain forex trading main Symmetrical triangle chart pattren main rules ko b follow karna parta hain qk jaaab tak rules ko follow nhe kia jata hain tu kamyabii b nhe hain learning ko strong kare Symmetrical triangle chart pattren main market k trend ko b dekha jata hainThe symmetrical triangle pattern is created by drawing two trendlines that connect the highs and lows of the price action. One trendline connects the highs and the other connects the lows. The two lines converge to form a triangle, with the price range becoming narrower as the pattern develops.

Symmetrical Triangle Chart Pattern ko kaisy Draw kia jata hy
Symmetrical Triangle Chart Pattern ko draw kerna k liye trader price k swing high aur swing low ko two trendlines sa jorh ker draw kerta ha. Dono trend lines ak dosra ko cross kerna chaheye. Is pattern man upper trend line ko resistance level aur lower trend line ko support level consider kiya jata ha. Is pattern k complete hona per price resistance level ya support level ko break kerti haThe symmetrical triangle pattern is considered a continuation pattern, which means that it suggests a continuation of the current trend after the breakout. In other words, if the price was in an uptrend before the pattern formed, it is likely to continue moving higher after the breakout. Similarly, if the price was in a downtrend, it is likely to continue moving lower after the breakout

Symmetrical triangle chart pattern ki identification
Symmetrical triangle ko wedge chart pattern bi Kahate Hain. Symmetrical Triangle pattern consolidation ko represent karta hai aur jab market is triangle oper ki line ko Breakout Karti Hai To to Ek bullish Trend start Hota Hai aur Agar market price iski lower line ko Breakout Kare to Ek bearish market Trend start Hota Hai.aur is mein result sideways triangle ki Surat mein hota hai jismein triangle ki best left side per hoti hai aur point right side per create hota hai aur symmetrical triangle hi market ke a breakup up down hone ko apply karti hai dear friends forex market mein bahut sari triangle's strategies ka istemal ho raha hota hai aik wahid stragety ha jo kay chopy market me use ki jati ha is se stragety ka success ratio 80% se b zada ha
Symmetrical Triangle Chart Pattern ak consolidation pattern ha, jis man market price ki movement man continuosly decrease ata ha aur last man price bhot tazi sa fall ya up jati ha.A symmetrical triangle is a common chart pattern in technical analysis, often used to help predict potential breakouts in stock prices. It is formed by two trendlines that converge towards each other, with both lines having equal slopes. This creates a triangle shape that becomes narrower over time as the price range narrows. The pattern can be bullish or bearish, depending on the direction of the breakout.
Symmetrical Triangle Charts Pattern ki Wazahat
Symmetrical triangle chart pattren main kaaam karna hain tu forex trading ko samjhy forex trading main pratice kare forex trading main learning strong nhe hoti hain tu kabi b Symmetrical triangle chart pattren ki samjh nhe aati hain forex trading main learning karna must hain forex trading main Symmetrical triangle chart pattren main rules ko b follow karna parta hain qk jaaab tak rules ko follow nhe kia jata hain tu kamyabii b nhe hain learning ko strong kare Symmetrical triangle chart pattren main market k trend ko b dekha jata hainThe symmetrical triangle pattern is created by drawing two trendlines that connect the highs and lows of the price action. One trendline connects the highs and the other connects the lows. The two lines converge to form a triangle, with the price range becoming narrower as the pattern develops.
Symmetrical Triangle Chart Pattern ko kaisy Draw kia jata hy
Symmetrical Triangle Chart Pattern ko draw kerna k liye trader price k swing high aur swing low ko two trendlines sa jorh ker draw kerta ha. Dono trend lines ak dosra ko cross kerna chaheye. Is pattern man upper trend line ko resistance level aur lower trend line ko support level consider kiya jata ha. Is pattern k complete hona per price resistance level ya support level ko break kerti haThe symmetrical triangle pattern is considered a continuation pattern, which means that it suggests a continuation of the current trend after the breakout. In other words, if the price was in an uptrend before the pattern formed, it is likely to continue moving higher after the breakout. Similarly, if the price was in a downtrend, it is likely to continue moving lower after the breakout
Symmetrical triangle chart pattern ki identification
Symmetrical triangle ko wedge chart pattern bi Kahate Hain. Symmetrical Triangle pattern consolidation ko represent karta hai aur jab market is triangle oper ki line ko Breakout Karti Hai To to Ek bullish Trend start Hota Hai aur Agar market price iski lower line ko Breakout Kare to Ek bearish market Trend start Hota Hai.aur is mein result sideways triangle ki Surat mein hota hai jismein triangle ki best left side per hoti hai aur point right side per create hota hai aur symmetrical triangle hi market ke a breakup up down hone ko apply karti hai dear friends forex market mein bahut sari triangle's strategies ka istemal ho raha hota hai aik wahid stragety ha jo kay chopy market me use ki jati ha is se stragety ka success ratio 80% se b zada ha

تبصرہ
Расширенный режим Обычный режим