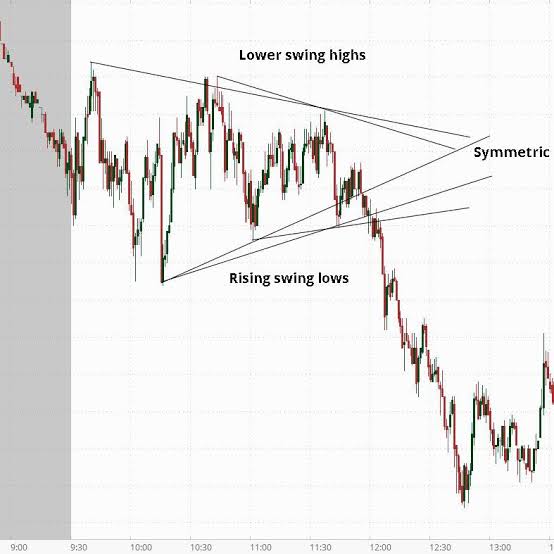
Triangle Candlestick Pattern
Triangle Candlestick Pattern
Dear Friends ye pattern market ma bull or bear both shapes ma banta hai. Ye pattern three candles par mabni hota hai. is pattern ma 2 different color candlestick same closing point py hi close hoti hain. is pattern ko hamazeed deeply dakhn to ye do parts me hota Hy.
Basic Working Strategy
Triangle candlestick pattern aik technical trading pattern ha, is ma three candles hoti hain jin ma sa 2 candles k darmian aik opposite candle lengthy price chart par mojood hoti ha, dono side wali candles ki range middle wali candle sa ziada hoti ha, stick sandwich pattern both bullish aur bearish indications provide karta ha,

Confirmation of Bullish and Bearish Candles
1 - Bearish Triangle Candlestick Pattern. Ye pattern forex market ma bhot kam nazar ata hai. ie pattern ma pehle candle green or long hoti hai jo show karti hai k market bull k control ma hai. Es pattern ma second candle red banti hai jo market ma down gap sy sy open hoti hai or eski closing price pehle candle ki closing price k same hoti hai. Jo third candle hoti hai wo again green hoti hai or ye second candle ko engulf kar leti hai. Trader ko third candlestick k break hony ka wait karna chahe or phr us hesab sy apni trade open karni chahe.
Bullish Triangle Candlestick Pattern
2. downtrend ma bnta ha aur rectangle candlestick pattern uptrend ma bnta ha, dono sides wali candles ki takreeban equal closing price hoti ha, is liay pattern ma strong support hoti ha jis sa reversal k chances ziada hotay hain, confirmation k liay last two closes k darmian midpoint hota ha, lihaza is baat ka khyal rakhna chaiiay k bullish ki surat ma prices is point k above hon aur bearish ki surat ma prices is point sa below hon, hmain hint k liay last candle ki closing position ko b daikhna chaiay, bullish k liay third candle k high aur bearish k liay third candle k low ko break karnay ka wait karain
Trading Strategy is pattern ma pehle candle red banti hai or second candle green banti hai jo gap down sy open hoti hai. Third candle phr red or long banti hai jo second candle ko engulf kar leti hai or maket ko pehle candle k low par ley ati hai. Trader ko es pattern ma market k break hony ka wait karna chahe or es k bad he apna order place karna chahe or sath stop los b lazmi use karna chahe. Tb he trader ka account safe rahy ga or iski trade less risk ma rahy gi.
Dear Friends ye pattern market ma bull or bear both shapes ma banta hai. Ye pattern three candles par mabni hota hai. is pattern ma 2 different color candlestick same closing point py hi close hoti hain. is pattern ko hamazeed deeply dakhn to ye do parts me hota Hy.
Basic Working Strategy
Triangle candlestick pattern aik technical trading pattern ha, is ma three candles hoti hain jin ma sa 2 candles k darmian aik opposite candle lengthy price chart par mojood hoti ha, dono side wali candles ki range middle wali candle sa ziada hoti ha, stick sandwich pattern both bullish aur bearish indications provide karta ha,
Confirmation of Bullish and Bearish Candles
1 - Bearish Triangle Candlestick Pattern. Ye pattern forex market ma bhot kam nazar ata hai. ie pattern ma pehle candle green or long hoti hai jo show karti hai k market bull k control ma hai. Es pattern ma second candle red banti hai jo market ma down gap sy sy open hoti hai or eski closing price pehle candle ki closing price k same hoti hai. Jo third candle hoti hai wo again green hoti hai or ye second candle ko engulf kar leti hai. Trader ko third candlestick k break hony ka wait karna chahe or phr us hesab sy apni trade open karni chahe.
Bullish Triangle Candlestick Pattern
2. downtrend ma bnta ha aur rectangle candlestick pattern uptrend ma bnta ha, dono sides wali candles ki takreeban equal closing price hoti ha, is liay pattern ma strong support hoti ha jis sa reversal k chances ziada hotay hain, confirmation k liay last two closes k darmian midpoint hota ha, lihaza is baat ka khyal rakhna chaiiay k bullish ki surat ma prices is point k above hon aur bearish ki surat ma prices is point sa below hon, hmain hint k liay last candle ki closing position ko b daikhna chaiay, bullish k liay third candle k high aur bearish k liay third candle k low ko break karnay ka wait karain
Trading Strategy is pattern ma pehle candle red banti hai or second candle green banti hai jo gap down sy open hoti hai. Third candle phr red or long banti hai jo second candle ko engulf kar leti hai or maket ko pehle candle k low par ley ati hai. Trader ko es pattern ma market k break hony ka wait karna chahe or es k bad he apna order place karna chahe or sath stop los b lazmi use karna chahe. Tb he trader ka account safe rahy ga or iski trade less risk ma rahy gi.


تبصرہ
Расширенный режим Обычный режим