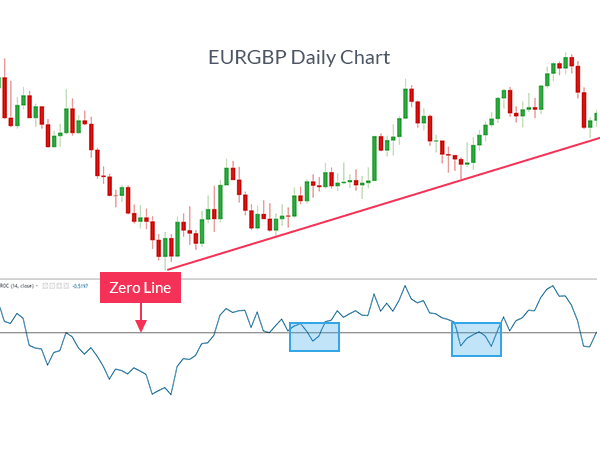
Dear friends jub aap current price ki specified* prices say compare karte hain aur uski basic per aap ek decision Lena chahte hain to aap ko price rate of change indicator bahut hi perfect calculation provide kar raha hota hai jo aapki next trading ke liye ek acchi base ban raha Hota Hai friends Price Rate Of Change* ( ROC ) indicator ko zero kay against bnaya jata hai* jis main price changes upside par hon to indicator b upward yani positive area ki taraf move karta ha aur agr prices downword hon to indicator b down area ki taraf move karta hai friends Positive value jo zero sy uper hoti hai wo show karti hai buying pressure ko or negative value jo zero sy nechy hoti hai wo show karti hai selling pressure ko jub yea values zero par wapis aa jaian to in ko warning movement* kehty hain.
Trading at Price Rate of Change Indicator (ROC).
Dear friends Price Rate of Change indicator (ROC) per trade karne ke liye sabse pahle aapko iski values Ka Pata Hona zaruri hai kyn kay aik momentum based technical indicator hai Jo ke price ki tabdeel hoti Hui percentage ko measure karta hai maujuda price ko aur mukhtalif periods k doran Jo price thi indicators forex market ko samjyne ka laye hote hain indicator ki help sa he hum trade kar sakte hain aur friends market kay trend ka sahi pata laga sakty hain kay market kub ooper jaye gi ya neechay Mt4 aur Mt5 indicator forex trade main achi help karte hain meta trade4 aur 5 ka alag alag indicator hain main meta trader 4 ko used kar sakty Hain.
Price rate of change indicator (ROC) ka istimal aur Tafseel
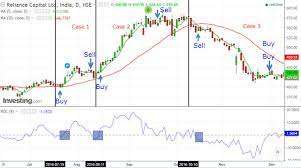
Price rate of change indicator (ROC) aik acha leading indicator hai ya hume market ki value ke bare me guide karta hai hume ya batata hai ke hum market me kis point per hai hum kya market ki price up ward jaye gi ya down ward jaye gi ya aik aisa indicator hai jis ki help se hum market me entry or exit bohat asani se le sakte hai hume is indicator ke bare me inforamtion hasil karni chahiye You Tube per hum is indicator ko daikh sakte hai
ROC k sath trading Strategy.
Respected Members ROC aik boht hi kamal ka indicator hy , ROc ka istimal trading k liay boht hi ahmiat ka hamil hota hy iski aik simple strategy ye ha k jb b rate of change zero line sa upar jayega to ye price ma positive momentum hoga aur jb rate of change zero line saa neechay jay go to ye price ma negative momentum ho ga, agr ROC positive aur badh raha ho ga to buying pressure b increase hoga is he tarah agr ROC positive ha lekin km ho raha ha to buying pressure blow ya slow ho jay ga, ROC Negative honay par selling pressure ziada ho jayega aur price low ho jaye gi. aapko price rate of change indicator bahut hi perfect calculation provide kar raha hota hai jo aapki next trading ke liye ek acchi base ban raha Hota Ha
Trading at Price Rate of Change Indicator (ROC).
Dear friends Price Rate of Change indicator (ROC) per trade karne ke liye sabse pahle aapko iski values Ka Pata Hona zaruri hai kyn kay aik momentum based technical indicator hai Jo ke price ki tabdeel hoti Hui percentage ko measure karta hai maujuda price ko aur mukhtalif periods k doran Jo price thi indicators forex market ko samjyne ka laye hote hain indicator ki help sa he hum trade kar sakte hain aur friends market kay trend ka sahi pata laga sakty hain kay market kub ooper jaye gi ya neechay Mt4 aur Mt5 indicator forex trade main achi help karte hain meta trade4 aur 5 ka alag alag indicator hain main meta trader 4 ko used kar sakty Hain.
Price rate of change indicator (ROC) ka istimal aur Tafseel
Price rate of change indicator (ROC) aik acha leading indicator hai ya hume market ki value ke bare me guide karta hai hume ya batata hai ke hum market me kis point per hai hum kya market ki price up ward jaye gi ya down ward jaye gi ya aik aisa indicator hai jis ki help se hum market me entry or exit bohat asani se le sakte hai hume is indicator ke bare me inforamtion hasil karni chahiye You Tube per hum is indicator ko daikh sakte hai
ROC k sath trading Strategy.
Respected Members ROC aik boht hi kamal ka indicator hy , ROc ka istimal trading k liay boht hi ahmiat ka hamil hota hy iski aik simple strategy ye ha k jb b rate of change zero line sa upar jayega to ye price ma positive momentum hoga aur jb rate of change zero line saa neechay jay go to ye price ma negative momentum ho ga, agr ROC positive aur badh raha ho ga to buying pressure b increase hoga is he tarah agr ROC positive ha lekin km ho raha ha to buying pressure blow ya slow ho jay ga, ROC Negative honay par selling pressure ziada ho jayega aur price low ho jaye gi. aapko price rate of change indicator bahut hi perfect calculation provide kar raha hota hai jo aapki next trading ke liye ek acchi base ban raha Hota Ha
تبصرہ
Расширенный режим Обычный режим