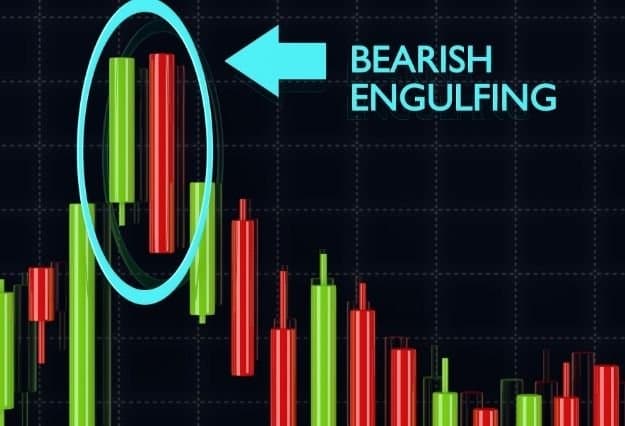
Candlestick pattern trade ma bhot important role play karty hain. Chart ma pattern ki different shapes hoti hain or esy he ik candlestick pattern ko ham bearish mat hold candlestick kay name sy janty hain. Bearish mat hold candlestick pattern five candlesticks pad mabni hota hai or ye bearish trend ma appear hota hai. Ye pattern market kay bearish trend kay continuation ko show karta hai. Ye market kay temporary pause hony ko indicate karta hai. Es pattern kay bad phr sy market apni continuation move kara deta hai.

What is bearish mat hold candlestick pattern.
Bearish mat hold candlestick pattern five bars par mabni hota hai or es pattern ki first or fifth candlestick long or negative hoti hai. Jb kay es kay darmeyan wali three candlesticks small or positive hoti hain. Market ma kiu kay bearish trend hota hai or es laye pehle candlestick tall or bearish hoti hai jo bearish trend ko show karti hai. Second, third or fourth candlestick small or positive hoti hai. Ye market ko hold kar deti hain or es kay bad last candlestick phr sy tall or bearish hoti hai. Jo ye show karti hai kay market ma phr sy down trend continue karny wala hai. Ye pattern market kay pull back ko show karta hai or market ye show karti hai kay wo mazeed down fall karny wali hai.

Difference between Bearish Mat Hold Candlestick and falling three method.
Falling three method traders kay mind ma kuch confusion peda karta hai but ye pattern bearish mat hold pattern kay sath bhot resemble karta hai. Ye both pattern bhot similar hain but en kay ik difference hai. Jin ko hamy es post ma mazeed explain karty hain. Falling three method ma middle candlesticks kay first tall bearish candlestick ki body ma confined hoti hai or bearish mat hold candlestick kay mamlay ma middle candlesticks pehle bearish candlestick ki body ma confined ni hoti or wo pehle candlestick kay hesab sy out side range ma hota hai.

Final thoughts on the topic.
Chart ma har candlestick different story ko indicate karta hai. Sb candlestick market ma different meaning ko indicate karta hai. En pattern ki base par hamy market ki unique information mohaya hoti hai kay ye current trend ko carry kary gi ya phr apna trend reverse karny wali hai. Ye pattern five candlesticks par mabni hota hai or es laye es ko samajny ma bhot time lagta hai or es par trade karna bi bhot tricky hota hai. Es pattern ko samajny kay laye hamy different filters or technical analysis ko use karna hota hai. Ye market kay worse effect ko filter kar lety hain or trader ko mazeed accuracy sy signal mel jaty hain jin ko carry kar kay wo apna profit gain kar saktyn hain.

Conclusion of the topic.
Chart ma hamesa kisi bi pattern ko 100 percent trade ma use ni karna chahe. Es pattern ma bi trader ko kisi tool kay sath combine kar kay use karna chahe. Trader ko chahe kay wo hamesa small lot sy apni trades ko manage kary. Agr wo big lot sy trade ko execute karyn gy to loss bi double ho ga or account kay wash hony ma dair ni lagy gi.
What is bearish mat hold candlestick pattern.
Bearish mat hold candlestick pattern five bars par mabni hota hai or es pattern ki first or fifth candlestick long or negative hoti hai. Jb kay es kay darmeyan wali three candlesticks small or positive hoti hain. Market ma kiu kay bearish trend hota hai or es laye pehle candlestick tall or bearish hoti hai jo bearish trend ko show karti hai. Second, third or fourth candlestick small or positive hoti hai. Ye market ko hold kar deti hain or es kay bad last candlestick phr sy tall or bearish hoti hai. Jo ye show karti hai kay market ma phr sy down trend continue karny wala hai. Ye pattern market kay pull back ko show karta hai or market ye show karti hai kay wo mazeed down fall karny wali hai.
Difference between Bearish Mat Hold Candlestick and falling three method.
Falling three method traders kay mind ma kuch confusion peda karta hai but ye pattern bearish mat hold pattern kay sath bhot resemble karta hai. Ye both pattern bhot similar hain but en kay ik difference hai. Jin ko hamy es post ma mazeed explain karty hain. Falling three method ma middle candlesticks kay first tall bearish candlestick ki body ma confined hoti hai or bearish mat hold candlestick kay mamlay ma middle candlesticks pehle bearish candlestick ki body ma confined ni hoti or wo pehle candlestick kay hesab sy out side range ma hota hai.
Final thoughts on the topic.
Chart ma har candlestick different story ko indicate karta hai. Sb candlestick market ma different meaning ko indicate karta hai. En pattern ki base par hamy market ki unique information mohaya hoti hai kay ye current trend ko carry kary gi ya phr apna trend reverse karny wali hai. Ye pattern five candlesticks par mabni hota hai or es laye es ko samajny ma bhot time lagta hai or es par trade karna bi bhot tricky hota hai. Es pattern ko samajny kay laye hamy different filters or technical analysis ko use karna hota hai. Ye market kay worse effect ko filter kar lety hain or trader ko mazeed accuracy sy signal mel jaty hain jin ko carry kar kay wo apna profit gain kar saktyn hain.
Conclusion of the topic.
Chart ma hamesa kisi bi pattern ko 100 percent trade ma use ni karna chahe. Es pattern ma bi trader ko kisi tool kay sath combine kar kay use karna chahe. Trader ko chahe kay wo hamesa small lot sy apni trades ko manage kary. Agr wo big lot sy trade ko execute karyn gy to loss bi double ho ga or account kay wash hony ma dair ni lagy gi.


تبصرہ
Расширенный режим Обычный режим