Asalamualikum dear members hope you all are fine and doing well on forex trading.dear members aaj hm apni post mein high wave candlestick pattern k bary mein baat krein gy.
High wave candlestick pattern:
Dear members High wave candle aik small real body main banny wali upper or lower sides pr long shadows rkhny wali aik single candle pattern hy, jis ko price chart pattern pr aik neutral candle mana jata hy. Yeh candle market main bullish or bearish, supply or demand, resistance or support power main equal hony ke wja sy bnti hy. Candle es trha Sy bnti hy, aik special timeframe k darmiyan price chart pr pehly investors prices ko aik side pr ly jany k bd same dusri side pr b usi trah sy push krti hy, lekin aik day k end pr prices apny start wali position k pr close hoti hy.jis Sy hm easily smjh skty Hain .

Formation of candles :
Dear friends High wave candles prices main zyada daikhty hain, Kun k yeh aik neutral candle mani jati hain. Yeh candle aik he time mein market mein buyers or sellers k equal power rkhti hain, jo prices ko aik position pr pai jati hy. Candle ke formation es trha Sy hoti hy.
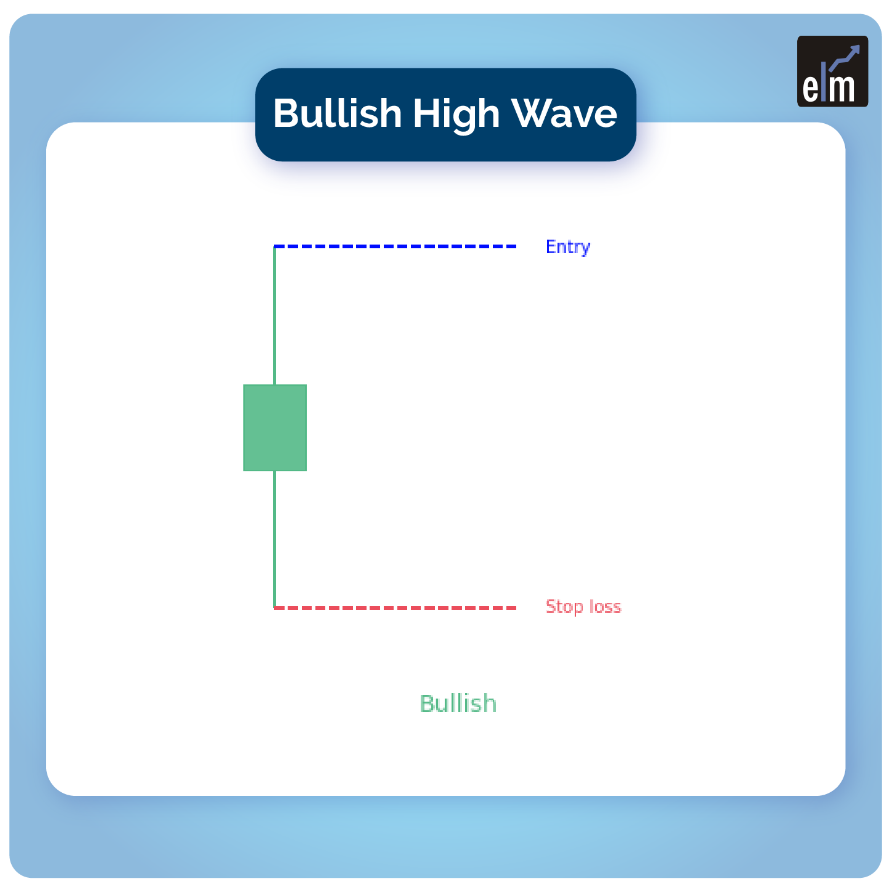
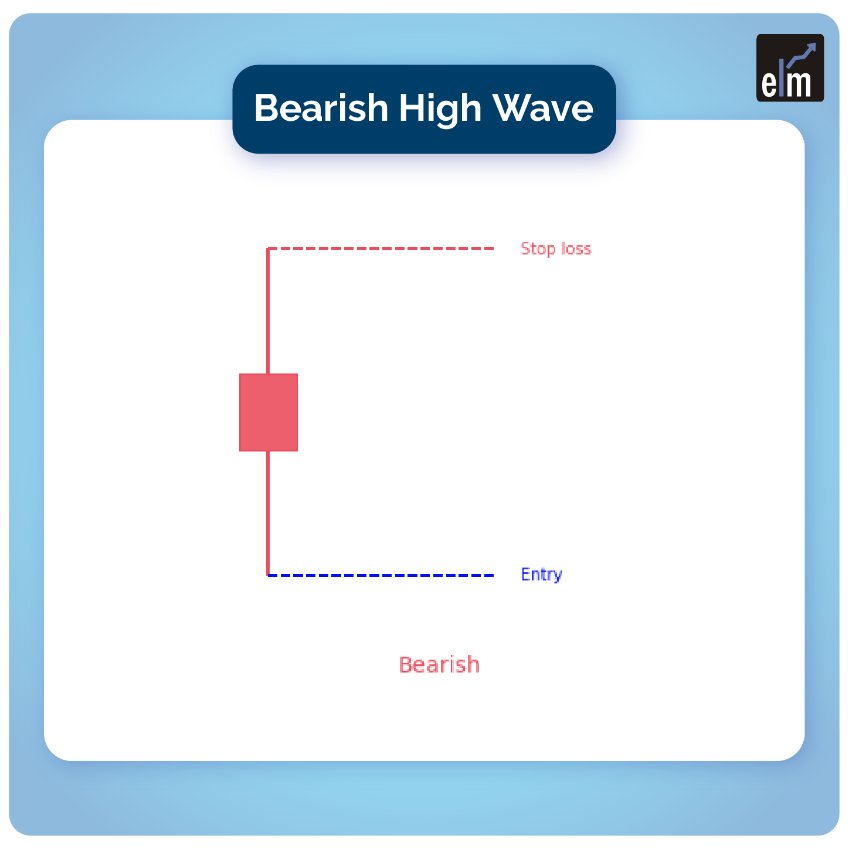
Spinning top candlestick :*High wave candlestick prices k darmiyan mein zyada tr neutral hoti hy, jb k bottom or top prices pr trend reversal ke salaheyat rkhti hy. Yeh candle aik small real body main hoti hy, jb k yeh candle single hony ke wja sy bullish or bearish dono trah sy ho skti hy. Candle k upper or lower sides pr shadow hota hy, jo k dono sides pr size main equal hota hy.
Explanation :
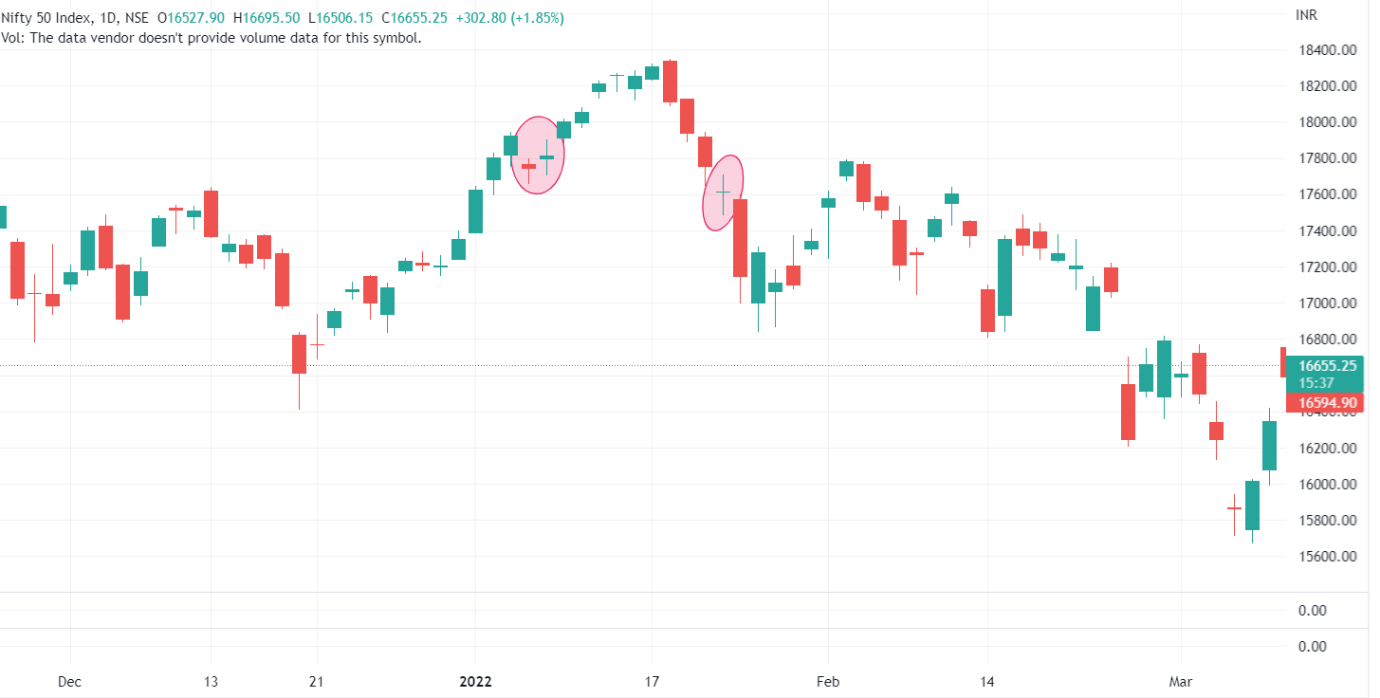
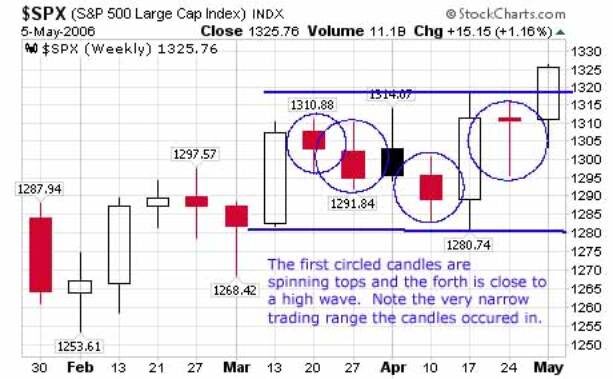
High wave candlestick mein prices candle k center ya darmiyan mein aik small real body bnati hy, jis k upper or lower side pr aik long shadow hota hy. Yeh candle a aik neutral candle smjhe jati hy, jis ko price chart pr boht zyada daikha jta hy. Yeh candle prices k center main ya aik trend k neutral value hoti hy, jb k prices k top ya bottom pr banney par yeh trend reversal Jasi importance rkhti hy. High wave candlestick b Spinning top candle, long-legged doji candle or doji star candle ke trah hoti hy, jis main market k prices zyada tr same trend ko he follow krti hy.
Trading strategy :
High wave candlestick trading k leye zyada perfect signals es wja sy nai dy skti hy, Kun k yeh candles zyada tr neutral hoti hy. Zyada tr yeh candles price chart main boht zyada nazar ati hy, lekin trend pr yeh boht kam asar andaz hoti hy. Price chart k top pr banney pr yeh candles thori boht trend reversal ho skti hy. Candle pr trading k liye zaruri hy, k prices trend k top ya bottom main hona chaheay, jab k candle k bd aik confirmation candle ka hona zaruri hota hy, jo k real body main lazmi hona chaheay. Jb k same trend ke candle banney pr yeh trend continuation ka role play krti hy.*Stop Loss*candle k sb sy top ya bottom end sy two pips above ya below set Karein.stop loss set kr he hm save trading kr skty Hain.

High wave candlestick pattern:
Dear members High wave candle aik small real body main banny wali upper or lower sides pr long shadows rkhny wali aik single candle pattern hy, jis ko price chart pattern pr aik neutral candle mana jata hy. Yeh candle market main bullish or bearish, supply or demand, resistance or support power main equal hony ke wja sy bnti hy. Candle es trha Sy bnti hy, aik special timeframe k darmiyan price chart pr pehly investors prices ko aik side pr ly jany k bd same dusri side pr b usi trah sy push krti hy, lekin aik day k end pr prices apny start wali position k pr close hoti hy.jis Sy hm easily smjh skty Hain .
Formation of candles :
Dear friends High wave candles prices main zyada daikhty hain, Kun k yeh aik neutral candle mani jati hain. Yeh candle aik he time mein market mein buyers or sellers k equal power rkhti hain, jo prices ko aik position pr pai jati hy. Candle ke formation es trha Sy hoti hy.
Spinning top candlestick :*High wave candlestick prices k darmiyan mein zyada tr neutral hoti hy, jb k bottom or top prices pr trend reversal ke salaheyat rkhti hy. Yeh candle aik small real body main hoti hy, jb k yeh candle single hony ke wja sy bullish or bearish dono trah sy ho skti hy. Candle k upper or lower sides pr shadow hota hy, jo k dono sides pr size main equal hota hy.
Explanation :
High wave candlestick mein prices candle k center ya darmiyan mein aik small real body bnati hy, jis k upper or lower side pr aik long shadow hota hy. Yeh candle a aik neutral candle smjhe jati hy, jis ko price chart pr boht zyada daikha jta hy. Yeh candle prices k center main ya aik trend k neutral value hoti hy, jb k prices k top ya bottom pr banney par yeh trend reversal Jasi importance rkhti hy. High wave candlestick b Spinning top candle, long-legged doji candle or doji star candle ke trah hoti hy, jis main market k prices zyada tr same trend ko he follow krti hy.
Trading strategy :
High wave candlestick trading k leye zyada perfect signals es wja sy nai dy skti hy, Kun k yeh candles zyada tr neutral hoti hy. Zyada tr yeh candles price chart main boht zyada nazar ati hy, lekin trend pr yeh boht kam asar andaz hoti hy. Price chart k top pr banney pr yeh candles thori boht trend reversal ho skti hy. Candle pr trading k liye zaruri hy, k prices trend k top ya bottom main hona chaheay, jab k candle k bd aik confirmation candle ka hona zaruri hota hy, jo k real body main lazmi hona chaheay. Jb k same trend ke candle banney pr yeh trend continuation ka role play krti hy.*Stop Loss*candle k sb sy top ya bottom end sy two pips above ya below set Karein.stop loss set kr he hm save trading kr skty Hain.
تبصرہ
Расширенный режим Обычный режим