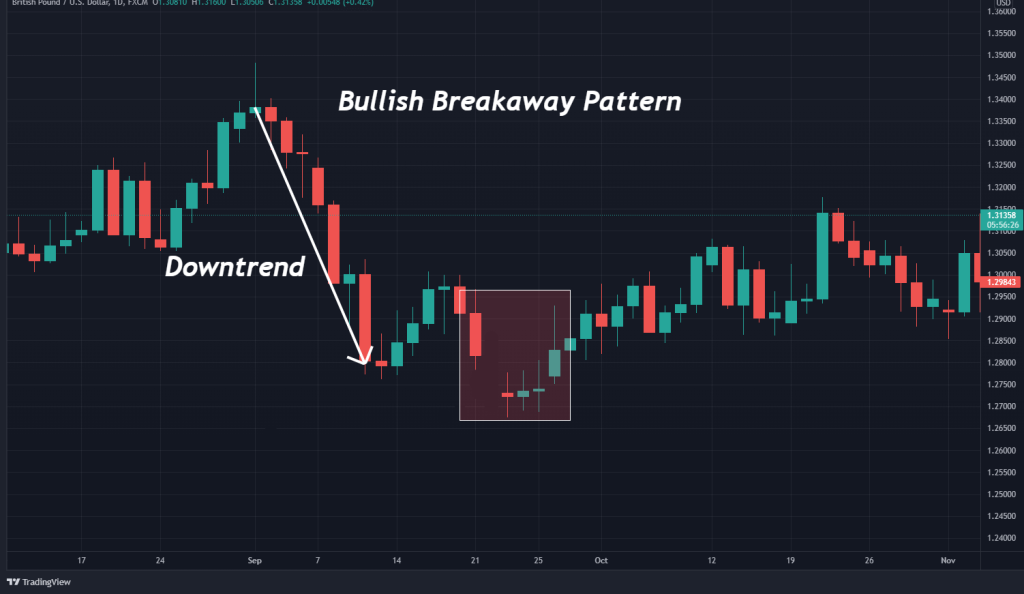
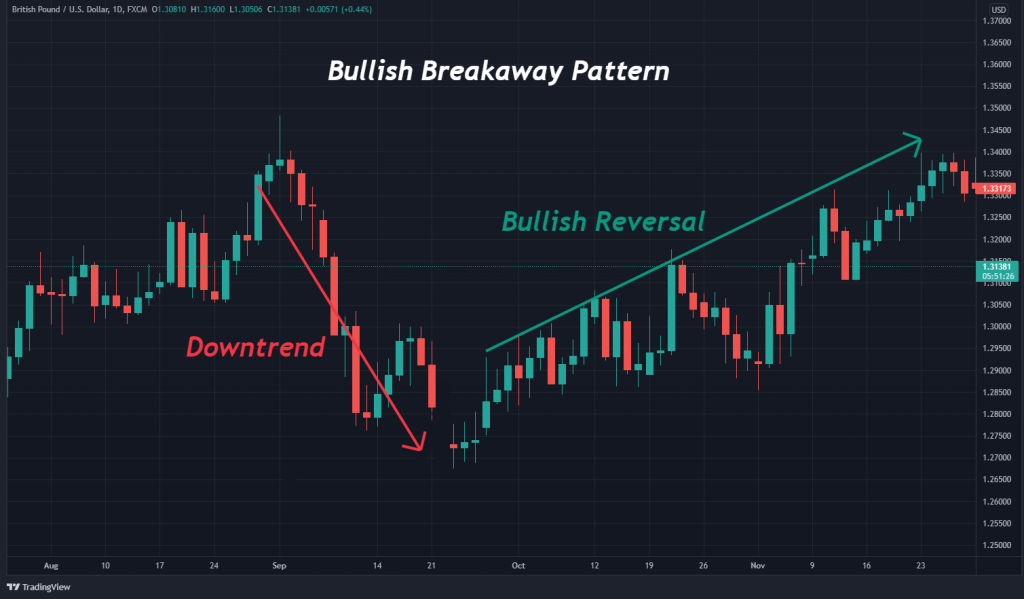
Bullish breakaway pattern in forex:

No announcement yet.
`
X
  • وقت
  • دکھائیں
Clear All
new posts
  • #1 Collapse

    Bullish breakaway pattern in forex:
    INTRODUCTION:


    ASSALAMU ALAIKUM DEAR FRIEND !Dear friend kese hn ap sb Umeed Karti hun Sab khairiyat se Honge aur Apna Achcha profit banaa Rahe Honge Jab aap ismein profitable trading karna chahte hain to aapko different analysis krne hun ge aj ka topic bullish breakaway pattern aj mn is k bare mn btaun ga ..umeed he ap aj k topic se bht seekhen ge.


    BULLISH BREAKAWAY PATTERN:


    Dosto, ye aik best trading pattern hy jis me apko green candles ko moatly observed krna ho ga jub bhi marlet ka bullish trend strong hota hai to bullish candles apko nazar ati hain hai haia mostly news time hota hai waisy monday aor Friday market slow hoti hai lkn kabi kabar un dino ma market bahot fast ho jati hai jiski wajah sy hamen market ko complete smjhna chye aor understand krna chye.


    Click image for larger version

Name:	images.png
Views:	13
Size:	8.8 کلوبائٹ
ID:	12577801


    CHART KI IMPORTANCE:


    Trading members hamen maloom hona chye ky market ma aik direction ma analysis kam nhi hata hai bahot sary factors ko study kren gay to market ko asani sy amkha ja saky ga agr market ko smjhny ma ham sentiment bhi ignore kren to perfect trader entry nhi bn pati hai isky leay he hamen efforts krnq hon gi ta ky ham amrlet ko achi traj sy understand kren jo bhi kam query ho usko discuss kren senior guide kren to follow kren qor candle breakaway strategy bnain back up plan hona chye tab behtr market ko kabu kia ja skta hai agr market ma confidence ky sath kam kren gay tb he ham achy perfe t tarder bn pain gay dosto market ko smjhna hai to mehnat he krna ho gi warna kamyab nhi ho pao gay kamyabi ky leay efforts krna prti hain jin ma apko extra source use krna hoty hain.


    TRADING :

    DEAR Trading members hamein pta hona chahiye ky market mein aek direction mein analysis kam nahi hata hai bohat sary factors ko study krein gay tou market ko asani sy samjha ja saky ga agr market ko smjhny mein ham sentiment bhi ignore krein tou perfect trader entry nhi bn pati hai isky leay he hamen efforts krna hon gi ta ky ham unko market mein achi trahan sy understand kren jo bhi kam query ho usko discuss kren senior guide kren to follow kren aur candle breakaway strategy bnain back up plan hona chahiye tab behtr market ko kabu kia ja skta hai agr market mein confidence ky sath kam kren gay tb he ham achy perfect tarder bn paein gay dosto market ko smjhna hai tou mehnat hi krna ho gi warna kamyab nhi ho pao gay kamyabi ky liye efforts krna prti hain jin ma apko extra source use krna hoty hain.


    FORMATION :

    Composition ki bat ki jaye to yeh candlestick pattern 5 candles par composed ek market ka candlestick pattern hai jo ky complete hoty huey 5 candles ki formation dikhata hai. In 5 candles mein first two candles Bearish candles hoti hain jab ky 3rd candle bearish or bullish ho skti hai. 4th candle aur fifth candle Bullish hoti hain aur aap in ko Buying mrin trade kar ky achy profits gain kar skty hain.Market ki First Candle Ek Long Bearish honi chahiye...​Yeh candle baqi tamam​candles se long hoti hai jiski body tall hoti hai..​Isky ilawa 2nd candle mein ek price gap hota hai. Is trha first and 2nd candle ky darmian ek price gap dekhny ko milta hai aur 2nd candle ki opening price first candle ki closing se lower hoti hai. 3rd candle ky bad banny wali 4th candle bhi short hoti hai aur 5th candle short hony ky stah sath iski closing Gap ky darmian mein hoti hai is trha yeh pattern complete ho jata hai.Agar market mrin first aur 2nd candle ky darmian mein gap nah dekha jaye to yeh pattern Bullish Breakaway pattern nshin kehlaye ga. Isi trha agar 5th candle ki closing price first 2 candles ky price gap ky darmian mein mojud nah ho to tb bhi yeh pattern Bullish Breakaway pattern nshin ho skta.​


    TECHNICAL ANALYSIS:


    Trading members agr apka technical analysis strong ho jay aoki market ky opper grip mazboot ho jati hai aor aoko management aor planning ktna jatai hai jesq ky topic hai ky bullish breakawqy pattern to isko amjhny ky leay camdle chart ko smjhna ho ga.


    THANKS.......
  • <a href="https://www.instaforex.org/ru/?x=ruforum">InstaForex</a>
  • #2 Collapse

    Re: Bullish breakaway pattern in forex:

    Bullish breakaway PatternBullish Breakaway Canldle stick pattern ma apko green camdles ko moatly observed krna ho ga jub bhi marlet ka bullish trend strong hota hai to bullish candles apko nazar ati hain hai haia mostly news time hota hai waisy monday aor Friday market slow hoti hai lkn kabi kabar un dino ma market bahot fast ho jati hai jiski wajah sy hamen market ko complete smjhna chye aor understand krna chyeis ko bullish reversal pattern ki indication ke liye istemal karte Hain yah pattern dusre patterns ke mukabale mein kafi complex hota hai Jo ke panch candlesticks per Mustafa mil hota hai aur is main break away bearish candle se start hota hai aur isko follow karte hue teen inner bar honi chahie janme se har bar ka top aakhri khel aur top ke upar hota hai aur ISI tarah Bottom har bar ka dusre ki top pr hota hea


    Click image for larger version

Name:	images.jpeg
Views:	1
Size:	13.3 کلوبائٹ
ID:	12438099
    Bullish Breakaway Canldle stick pattern ki explaination
    Bullish Breakaway candle stick pattern ek 5 candles pattern hai. Yeh candlestick pattern market mein rarely dekhny ko milta hai Jisko aap buying mein trade kar skty hain. Yeh ek short term trading ka pattern hai Jisko aap long term trading ky liye strategy ky tor par istemal nahin kar skty.​Dusry pattern ki​trha​yeh pattern bhi market mein good entry points hasil karny ky liye rk behtren pattern shumar kia jata hai.​Iski mukamal knowledge aur experience aap ko is se acha profit target de skta hai.Market ki First Candle Ek Long Bearish honi chahiye...​Yeh candle baqi tamam​candles se long hoti hai jiski body tall hoti hai..​Isky ilawa 2nd candle mein ek price gap hota hai. Is trha first and 2nd candle ky darmian ek price gap dekhny ko milta hai aur 2nd candle ki opening price first candle ki closing se lower hoti hai. 3rd candle ky bad banny wali 4th candle bhi short hoti hai aur 5th candle short hony ky stah sath iski closing Gap ky darmian mein hoti hai is trha yeh pattern complete ho jata hai.


    Click image for larger version

Name:	images.png
Views:	12
Size:	2.1 کلوبائٹ
ID:	12438100
    Bullish Breakaway Canldle stick pattern ky sath trading krna
    Bullish breakaway pattern aap ko short term ky liye a buying signals deta hai. Is mein aap last 2 candles par buying kar ky acha profit gain kar skty hain. Is trha agar sap iski complete knowledge le kar market mein signals gain karty hain to aapko yeh ek behtren entry point de skta hai.
    • #3 Collapse

      Re: Bullish breakaway pattern in forex:

      What is Bullish Breakaway Candlestick chart pattern


      My dear forex member I hope of sab khairiyat se honge aur achcha profit hasil kar rahe honge ji bilkul aaj ke topic mein main aapko batana chahta hun kha bullish breakaway candlestick chart pattern ki identification kasy krty Hy is ki important information aapke sath share karta hun to my dear forex member yah ek important trading pattern hai jismein aapko ek green color wali candles ko identify karna hota hai jaj karna hota hai usko jab Bhi market ke bullish trend strong hota hai to bullish candles aapko bahut jyada najar aati Hain mostally news time hota hai vaise mande aur Friday market slow hoti hai but kabhi kbar ine dinon mein market bahut jyada fast ho jaati hai jiski vajah se hamen market ko completely samajhna chahie usko identify completely karna chahie kyunki jitna jyada Ham isko acchi Tarah se identify kar payenge utna hi jyada hamare liye fayda man sabit hoga isliye aap logon ke liye jyada jaruri hai ki aap market mein maujud pattern ko acchi Tarah se samjhe usko acchi Tarah se understand Karen usko acchi Tarah se identify Karen tab jakar aap use mein trading ki entry le to fir aapko achcha profit hasil hoga is Tarah se aap market mein hansane ke sath achcha profit hasil kar sakte hain aapke liye bahut jyada jaruri hai har use pattern ki information Jo ke market mein banta hai jab Bhi aap is police break Ave pattern ko acchi Tarah se identify karenge iske liye jaruri hai kya aapke pass acchi information honi chahie


      Identification of Bullish Breakaway Candlestick chart pattern


      Forex member hamen information honi chahie ki market mein ek direction mein analysis karna Nahin hota hai balki bahut sare kuchh aise factors bhi hote Hain jinko humne study ke jarie hi solve kar sakte hain agar Ham study karenge to market ko easily se identify kar payenge agar market ko samajhne mein humne thodi bahut sentiment bhi ignore karen to perfect trader entry Nahin milegi hamen kyunki agar aap study karte waqt Kisi aur jagah per focus karte Hain to is Tarah se aap acchi Tarah se study nahin kar paate jiski vajah se aap market mein acchi entry Nahin Le sakte iske liye hamen Apne bahut jyada focus ke sath study Karni chahie Taki hamen acchi si acchi information hasil ho jitne jyada hamare pass good information Hogi utna hi jyada Ham market mein good point ke mutabik entry Le payenge aap logon ke pass scandal break Ve strategy honi chahie aur backup plan hona chahie tab behtar market ko control mein laya ja sakta hai agar market mein confidence ke sath kam karenge tabhi Ham acche perfect trader Ban sakte hain doston market ko attentify hi to karna hota hai jiske Liye bahut jyada mehnat ki jarurat hoti hai aur mehnat karenge to hi kamyab honge Varna aap log kamyab kabhi Nahin ho sakte isliye hamen market ko acchi Tarah se identify kar lena chahie Taki ismein hamen jo bhi acchi information hasil ho isase hamen yah yad rahega ki yah candle Jahan Bhi market mein banega is ismein aap ek good entry Le sakenge


      Treading with this pattern


      Forex member ab baat aati hai hamari trading ki Ham trading kis Tarah karte hain trading ke liye sabse jyada important jo chij hoti hai vah hoti hai aapki identification Jo aapke pass information Hoti hai my dear forex member we information ki help se aap log market ko acchi Tarah se identify Karke ek acchi trading Le sakte hain to is bullish break away pattern mein aap logon ne kaise entry kasy ly basically two Way mein paya jata hai ek ek top candlestick pattern banta hai aur dusra bottom candlestick pattern banta hai agar market top trend mein chal rahi hoti hai to yah market ko high value ki taraf Leke lower value ki taraf niche Le aata hai aur yah pattern Jahan Bhi banta hai to yah market ko ek reversal pattern banata hai to ismein aapane agar market mein yah candlestick pattern top mein ban raha hai to aapane ismein sel ka signal apply karna hai aur upar stop loss ka function apply kar dena hai is Tarah se aap is samay acchi entry lekar achcha profit banaa sakte hain aur dusre number per hota hai bottom candle stick pattern bhi reversal pattern ka hota hai police break away candlestick pattern mein hamesha reversal pattern banati hai kyunki agar yah pattern market mein bottom mein banta hai usi time high value se lower value ki taraf badhana start ho jayegi aur ismein aap logon ne ka signal apply karna hai aur niche ki taraf stop loss ka function apply kar dena jiski vajah se aapka account safe rahega isase aapko bahut kam loss ho sakta hai aap logon khud ka signal create Karen kyunki jitna jyada aap log khud ka signal create karenge utna hi jyada aap log acchi profit ya acchi arning hasil kar payenge


      Formation and important points


      My dear forex member maine aapko bataya hai ki yah market green candles ke upar mushkil hoti hai jo ki bahut sare hote hain Yahan to vah niche ki taraf hote hain ya to fir upar ki taraf hote Hain Jo niche ki taraf hote hain unko Ham bottom candlestick pattern kahate Hain aur jo upar ki taraf hote Ham unko top candle state pattern kahate Hain ab ismein samajhne ke bad yah hai ki yah Jahan Bhi bante Hain to vahan per market foreign revers hoti hai jisko Ham reversal candle state pattern kahate Hain yah Jahan Bhi candlestick bane aapane uske ulat hi Apne signal ko lagana hai apni trade ko lagana hai agar top per bane to aapane lower ki taraf train lagane agar bottom mein bane to apne aap per ki taraf ped lagani hai yah bahut hi important point hai aap logon ke liye aur sabse jyada hamare liye Jo important hota hai vah hota hai hamare liye stop loss kyunki agar aap identification galat hai to aapko bahut jyada loss ho sakta hai bachne ke liye aap stop loss ka istemal Karen thank


      • #4 Collapse

        Re: Bullish breakaway pattern in forex:

        BULLISH BREAKWAY PATTERN
        bullish breakway candlestick pattern important candlestick pattern hai jo mostly five candles per mushtamill Hota Hai bullish break candlestick pattern mostly market ke andar bearish rally ke bad appear Hota Hai yah candlestick pattern reversal candlestick pattern ko represent karta hai aur is pattern ke end Hamein strong bullish pattern Nazar Aata Hai. Bullish break candlestick pattern mostly oversold condition ke dauran market ke andar grow Hota Hai. Yah pattern mostly five bars per mushtamil hota hai is pattern ki first three long bearish candle hoti hain Jisko small three bearish candle follow kar rahi hoti hain aur is pattern ki last candle Ek reversal candle hoti hai jo opposite pattern ko represent karti hai. es break candle ki vajah se is pattern ko breakway pattern Kaha jata hai.

        TRADING PSYCHOLOGY
        yeh pattern bearish trend ke sath start hota hai aur Market ke andar strong bearish candle maujud hoti hai jo Hamen market ke andar bearish trend movement ki confirmation Deti Hai es pattern ki second candle Bhi Ek reducing price candle hoti hai jo downward movement ko represent Karti Hai Lekin second candle Hamesha gap ke sath open Hoti Hai Aur Is Tarah second candle Bhi Ek red candle hoti hai es pattern ki third candle gap ke sath open hoti hai aur yah candle red bhi ho sakti hai aur white Bhi Is Tarah market ke andar reversal trend start Hota Hai es pattern ki 4th candle Dobara Ek red candle banti hai lekin yeh ek small candle hoti hai jo gap ke sath open hoti hai es pattern ki fourth candle losing Momentum candle kahlati hai aur mostly market ke andar bears Apna control loose Karte Dikhai Dete Hain Aur Is Tarah market ke andar bears ka control khatam ho jata hai aur Market per buyers control a jata hai es pattern ki fifth candle ek small bullish candle hoti hai jo upward trend ko represent karti hai aur Hamen market per buyers ki entry ke bare mein batati hai isliye Pattern ko bullish reversal candlestick pattern Kahate Hain.
        • #5 Collapse

          Re: Bullish breakaway pattern in forex:

          TRADING PSYCHOLOGY
          yeh pattern bearish trend ke sath start hota hai aur Market ke andar strong bearish candle maujud hoti hai jo Hamen market ke andar bearish trend movement ki confirmation Deti Hai es pattern ki second candle Bhi Ek reducing price candle hoti hai jo downward movement ko represent Karti Hai Lekin second candle Hamesha gap ke sath open Hoti Hai Aur Is Tarah second candle Bhi Ek red candle hoti hai es pattern ki third candle gap ke sath open hoti hai aur yah candle red bhi ho sakti hai aur white Bhi Is Tarah market ke andar reversal trend start Hota Hai es pattern ki 4th candle Dobara Ek red candle banti hai lekin yeh ek small candle hoti hai jo gap ke sath open hoti hai es pattern ki fourth candle losing Momentum candle kahlati hai aur mostly market ke andar bears Apna control loose Karte Dikhai Dete Hain Aur Is Tarah market ke andar bears ka control khatam ho jata hai aur Market per buyers control a jata hai es pattern ki fifth candle ek small bullish candle hoti hai jo upward trend ko represent karti hai aur Hamen market per buyers ki entry ke bare mein batati hai isliye Pattern ko bullish reversal candlestick pattern Kahate Hain
          Formation and important points
          My dear forex member maine aapko bataya hai ki yah market green candles ke upar mushkil hoti hai jo ki bahut sare hote hain Yahan to vah niche ki taraf hote hain ya to fir upar ki taraf hote Hain Jo niche ki taraf hote hain unko Ham bottom candlestick pattern kahate Hain aur jo upar ki taraf hote Ham unko top candle state pattern kahate Hain ab ismein samajhne ke bad yah hai ki yah Jahan Bhi bante Hain to vahan per market foreign revers hoti hai jisko Ham reversal candle state pattern kahate Hain yah Jahan Bhi candlestick bane aapane uske ulat hi Apne signal ko lagana hai apni trade ko lagana hai agar top per bane to aapane lower ki taraf train lagane agar bottom mein bane to apne aap per ki taraf ped lagani hai yah bahut hi important point hai aap logon ke liye aur sabse jyada hamare liye Jo important hota hai vah hota hai hamare liye stop loss kyunki agar aap identification galat hai to aapko bahut jyada loss ho sakta hai bachne ke liye aap stop loss ka istemal Karen thank.


          ullish breakaway PatternBullish Breakaway Canldle stick pattern ma apko green camdles ko moatly observed krna ho ga jub bhi marlet ka bullish trend strong hota hai to bullish candles apko nazar ati hain hai haia mostly news time hota hai waisy monday aor Friday market slow hoti hai lkn kabi kabar un dino ma market bahot fast ho jati hai jiski wajah sy hamen market ko complete smjhna chye aor understand krna chyeis ko bullish reversal pattern ki indication ke liye istemal karte Hain yah pattern dusre patterns ke mukabale mein kafi complex hota hai Jo ke panch candlesticks per Mustafa mil hota hai aur is main break away bearish candle se start hota hai aur isko follow karte hue teen inner bar honi chahie janme se har bar ka top aakhri khel aur top ke upar hota hai aur ISI tarah Bottom har bar ka dusre ki top pr hota hea


          Bullish Breakaway Canldle stick pattern ki explaination
          Bullish Breakaway candle stick pattern ek 5 candles pattern hai. Yeh candlestick pattern market mein rarely dekhny ko milta hai Jisko aap buying mein trade kar skty hain. Yeh ek short term trading ka pattern hai Jisko aap long term trading ky liye strategy ky tor par istemal nahin kar skty.​Dusry pattern ki​trha​yeh pattern bhi market mein good entry points hasil karny ky liye rk behtren pattern shumar kia jata hai.​Iski mukamal knowledge aur experience aap ko is se acha profit target de skta hai.Market ki First Candle Ek Long Bearish honi chahiye...​Yeh candle baqi tamam​candles se long hoti hai jiski body tall hoti hai..​Isky ilawa 2nd candle mein ek price gap hota hai. Is trha first and 2nd candle ky darmian ek price gap dekhny ko milta hai aur 2nd candle ki opening price first candle ki closing se lower hoti hai. 3rd candle ky bad banny wali 4th candle bhi short hoti hai aur 5th candle short hony ky stah sath iski closing Gap ky darmian mein hoti hai is trha yeh pattern complete ho jata hai.
          • #6 Collapse

            Re: Bullish breakaway pattern in forex:

            Bullish breakaway candlestick


            The bullish breakaway is a very intriguing five-bar Japanese candle design that proposes future bullish cost activity, as per broad verifiable backtesting.

            Click image for larger version

Name:	IMG_20230101_114828.jpg
Views:	1
Size:	40.4 کلوبائٹ
ID:	12438113

            The example happens too rarely in all business sectors on the day to day outlines to create measurably huge outcomes.

            The information indicates the bullish breakaway example being one of only a handful of exceptional candle designs that work as promoted.

            In any case, the way that the example the two produces benefits and functions as expected implies it would appear to be legit to realize this example so you can examine it on other time spans.

            Click image for larger version

Name:	IMG_20230101_114813.jpg
Views:	1
Size:	37.2 کلوبائٹ
ID:	12438114

            Example of Bullish breakaway:

            What Is a Bullish Breakaway Candle Example
            Bullish Breakaway Candle Example Representation © Examining Alpha
            Bullish Breakaway Candle Example Representation
            A bullish breakaway example is a bullish inversion design. It gets its name from the last flame splitting away from the earlier pattern.

            The example appears to allude to creating benefits in the securities exchange. And keeping in mind that this isn't is business as usual, as the securities exchange has a vertical predisposition, the example actually shows guarantee.

            Talking about candle outlines, we should figure out how to recognize this uncommon five-bar design.

            Instructions to Recognize the Bullish Breakaway Candle Example
            Bullish Breakaway Candle Example on the Concur Realty Enterprise (ADC) November second, 2020 day to day graph
            Bullish Breakaway Candle Example on the Concur Realty Partnership (ADC) November second, 2020 day to day graph
            Coming up next are the prerequisites for a substantial bullish breakaway example:

            The primary candle should be a long negative flame.
            The subsequent light is negative and holes down.
            The third light priority a lower low and lower high than the second.
            The fourth flame is negative and should have a lower low and lower high than the third.
            The fifth light should be negative and shuts the subsequent flame's hole.
            The bullish breakaway should happen in a downtrend.
            We can see the bullish breakaway on the Concur Realty Enterprise (ADC) everyday graph on November second, 2020.

            Cost is in a negative pattern and underneath the fifty-day moving normal. We see a huge negative flame pushing toward the downtrend on the primary bar — cost holes down on the subsequent day. The third bar is bullish yet with a lower high and lower low than the second. The fourth candle is negative with a lower high and lower low. Furthermore, the fifth day shuts the hole with a long bullish candle.

            Now that we can distinguish these five candle breakaway examples, how could we exchange them?

            Instructions to Exchange the Bullish Breakaway Candle Example
            The bullish breakaway examples ought not be exchanged because of deficient information.

            For the people who couldn't care less about factual importance, this information indicates that the example ought to be exchanged as planned utilizing a bullish inversion exchanging system expecting a more drawn out term pattern inversion.

            We should figure out how customary exchanging and speculation guidance suggests bringing in cash on this example.

            Bullish Breakaway Bullish Inversion Exchange Arrangement


            We can see the breakaway example on the Fiserv (FISV) everyday outline on October fourteenth, 2021.

            Market opinion is negative as we see that cost is beneath the fifty-day moving normal.

            The primary bar is a negative candle in the overarching pattern bearing. The subsequent candle is a huge dark flame with a hole between the initial two candles — the third and fourth days both print worse high points and worse low points. The fifth flame is an enormous bullish candle with a vertical hole.

            With the five candles and the descending pattern recognized, we should figure out how to exchange this example as a bullish inversion.

            Brokers enter long at a break of the fifth candle's high with a stop misfortune set beneath the low of the fourth bar.

            Click image for larger version

Name:	IMG_20230101_114758.jpg
Views:	1
Size:	94.6 کلوبائٹ
ID:	12438115
            • #7 Collapse

              Re: Bullish breakaway pattern in forex:

              The Bullish Breakaway

              A chart reversal pattern known as a bullish breakaway can happen in a bullish market or a negative one. This pattern is sometimes seen by traders as a sign of a bullish turnaround. However, under some circumstances, trading it on the sell side, or as a contrarian move, may also be beneficial.

              How to Detect a Bullish Breakaway

              Given that it consists of five candlesticks grouped together, this pattern is more intricate than many others. Starting with a bearish candle, the breakaway begins. Three inner bars should come next, each with a top that is equal to or lower than the previous one. Each bar's bottom should match or be lower than the previous one.The three middle candlesticks are generally bearish but may can be positive. The final candlestick in the pattern must close higher than the tops of the inner three bars in order to be bullish.When the initial candlestick in the pattern is tiny, when the pattern doesn't strike a recent bottom, or when the first inner candlestick doesn't "gap down" at the open, many stock traders will rule out bullish breakaways. Stronger patterns call for the last bar to "close the gap" by closing above the closure of the first. We often reduce these restrictions a little in continuous markets like FX.Bullish breakaways can occur in any market conditions, including flat markets and both bullish and bearish movements. When the pattern comes during a downward swing or an oversold bearish trend, we'll often give it more weight. At trend bottoms, clusters of breakaways patterns are frequently visible. Many of them ultimately out to be misleading signals that surface during the tumultuous sessions before to a market change.

              Market Sentiment

              A chart's appearance of the bullish breakout indicates that mood is steadily shifting from bearish to positive. We're seeking for signs that a surrender is approaching as we examine the chart. Those that are long the market give up at that point. This will manifest as a quick, abrupt decline in price. Remember that the breakaway pattern might either occur on either side of the major surrender or represent the capitulation itself.
              Click image for larger version

Name:	img_5e53b4abc8d12.png
Views:	6
Size:	12.2 کلوبائٹ
ID:	12438138

              Understanding the Market Dynamics

              When examining the pattern, the first bar is bearish and frequently denotes a significant price decline. The three inner bars signify a sluggish decline in price brought on by a shift in demand from sellers to buyers. As a result, the downward motion is slowing near the inner bars. The last bar begins to reverse the price decrease and is positive. The entire breakaway sequence will take place over the course of five trading days on a daily chart. This allows me plenty of time to examine the market both technically and fundamentally.Figure 2's chart provides a real-world illustration. The pattern that is developing in a bearish trend is highlighted by the shaded box. At the final trough of this specific downturn, a bearish, lengthy candlestick appears. The three inner bars show a shift from negative to positive attitude. Both the last inner bar and the third one are bullish.

              Trading the Bullish Breakaway

              The bullish breakaway is utilised with other strategies and tools, just like any other reversal pattern. By doing this, we may create a picture of the market's most likely course of action. The breakaway pattern's dependability fluctuates greatly from chart to chart and from moment to moment. Therefore, it's crucial to have data that shows the breakout's greatest likelihood movement direction available while trading. Use a charting tool to accomplish this. Since breakaways can occasionally be traded more effectively as a contrarian trade in the opposite direction, without this you are simply trading blind.

              Bullish Breakaways in Uptrends

              In a market that is heading upward, bullish breakaways frequently occur in the little swings or waves that form spontaneously. These breakaway setups are frequently the simplest and most lucrative to trade. Instead of taking a single big position risk, we may use a grid strategy to trade into the increasing trend with smaller position sizes.Because we are constantly trading in the trend's direction rather than attempting to predict the precise reversal moment, this is typically a less hazardous strategy. In order to reduce risk on each one trade, we also break the entire position down into smaller parts. In a market that is sharply rising, the chart in Figure 4 depicts a series of bullish breakaway patterns emerging. This is a fantastic risk-to-reward opportunity since towards the conclusion of the series, the likelihood of an upward breakout rises to over 80%.
              • <a href="https://www.instaforex.org/ru/?x=ruforum">InstaForex</a>
              • #8 Collapse

                Re: Bullish breakaway pattern in forex:

                WHAT IS BULLISH BRAKAWAY PATTEREN
                Fellows, Is patteren mein ap ko green candles ko mostly observe kr na ho ga jub bhi market ka bullish trend strong hota hai tou bullish candles ap ko nazar ati hain hai mostly news time hota hai waisy monday aur Friday market slow hoti hai lekin kabhi kabhar un dino ma market bohat fast ho jati hai jis ki wajah sy hamein market ko complete smjhna chaieya.
                Click image for larger version

Name:	1.jpg
Views:	4
Size:	5.7 کلوبائٹ
ID:	12438144

                TRADING IN BULLISH BREAKAWAY PATTEREN
                Bullish breakaway pattern mein ap ko short term ky liye a buying signals deta hai. Is mein ap last two candles par buying kar ky acha profit gain kar skty hain. Is trha agar iski complete knowledge le kar market mein signals gain karty hain to ap ko yeh ek amazing entry point de skta hai.
                Click image for larger version

Name:	2.png
Views:	10
Size:	4.8 کلوبائٹ
ID:	12438145

                [SIZE=3]IMPORTANCE[/SIZE
                Friends,Trading members hamein pta hona chahiye ky market mein aek direction mein analysis kam nahi hata hai bohat sary factors ko study krein gay tou market ko asa ni sy samjha ja saky ga agr market ko smjh ny mein ham sentiment bhi ignore krein tou perfect trader entry nhi bn pati hai is ky leay he hamen mehnat krna hon gi ta ky ham unko market mein achi trahan sy understand kren jo bhi kam query ho us ko discuss kren senior guide kren to follow kren aur candle breakaway strategy bnain back up plan hona chahiye tab he market ko kabu kia ja skta hai agr market mein confidence ky sath kam kren gay tb he ham achy perfect tarder bn paein gay market ko smjhna hai tou mehnat hi krna ho gi warna kamyab nhi ho pao gay kamyabi ky liye efforts krna prti hain jin ma ap ko extra source use krna hoty hain.......
                Click image for larger version

Name:	3.png
Views:	8
Size:	3.5 کلوبائٹ
ID:	12438146

                اب آن لائن

                Working...
                X