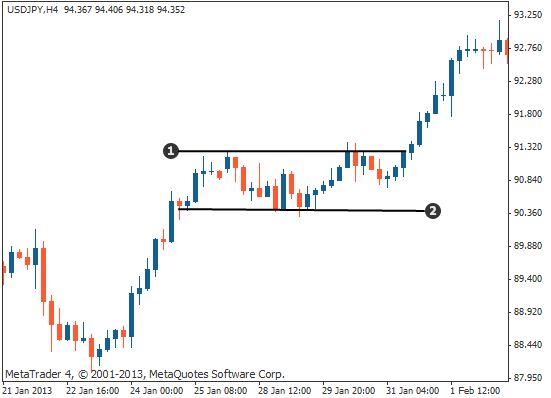
bullish rectangle pattern

No announcement yet.
`
X
  • وقت
  • دکھائیں
Clear All
new posts
  • #1 Collapse

    bullish rectangle pattern
    what is bullish rectangle pattern?


    bullish rectangle pattern aik kesam ka chart pattern hey jes mein pice aik bullish breakout kay bad candle stick cart pattern par aik kesam ke limit hote hey yeh chart pattern forex market mein trend kay reversal or continue rehnay ko indicate karta hey tahum etail trader frex market mein winning ke ratio kay lahaz say es ko continuation chart pattern kay tor par estamal kar saktay hein
    Click image for larger version

Name:	bullish-rectangle-pattern-1.png
Views:	1
Size:	10.5 کلوبائٹ
ID:	12576663


    identification rectangle chart pattern


    rectangle chart pattern forex market ke halat ke nomaindge karte hey mesal kay tor par aik es chart pattern kay doran price aik he side mein chale jate hey forex market time kay sath price kay andar open ho jate hey forex chart par rectangle noma shape ban jate hey
    forex chart pattern 2 higher or 2 lower level ke shape mein hona chihay forex market mein resistance zone par 2 kesam kay touches hotay hein
    Click image for larger version

Name:	highs-and-lows-of-rectangle-pattern-1.png
Views:	1
Size:	14.4 کلوبائٹ
ID:	12576665


    breakout with a bullish rectangle pattern


    forex market mein sab say important step yeh hey ap ko forex market ko care say check karna chihay kunkeh forex market swing breakout say bhare hove hey
    forex market mein aik acha breakout bare bullish candle stick kay sath hoya hey bullish candle stick mein body to wick ke ratio zyada hona chihay kunkeh forex market mein yeh sahi breakout ko wazah kar sakta hey dosree taraf ager Doji candle stick ya chote candle stick to breakout candle stick bante hey chonkeh forex market mein small candle stick ke raftar slow hote jate hey or basic key level ka breakout high momentum mein he hota hey jo keh candle stick kay sath he hota hey
    Click image for larger version

Name:	big-bullish-candlestick-breakout-1.png
Views:	1
Size:	10.2 کلوبائٹ
ID:	12576664
    دیتے جائیںThanksحوصلہ افزائی کے لیے
  • <a href="https://www.instaforex.org/ru/?x=ruforum">InstaForex</a>
  • #2 Collapse

    جواب: bullish rectangle pattern

    Asslam o alaikum dear Friends
    Friends Umeed krta hon Ap sab khariat se hon gey,
    Forex Ek bht best plat form ha, agar es k Rule Regulations pe reh kr agar kam kiya jay to bht achi earning ki ja Sakti ha.,
    Introduction:-
    Candles different types ki hamary pass majood hoti hain. Jin ki madad sa ham markeet ki movment etc ko madu nazar rakh skty hain. And kuch candles hamain loss aor kuch candles hamain proffits ka bhi btati hain.
    Click image for larger version

Name:	SH11.gif
Views:	1
Size:	6.1 کلوبائٹ
ID:	12436600

    Types of Candles

    1_*bullish.
    2_bearish.
    Ya bahot hi ahem anf importent hain. Ager traders ki in ki samjh a jati hy to yakeeni tradder ko loss hony k bahot kam imkaanat hoty hain. And*bullish*and bearish rectangular is so importent for tradders. Hamain in ki respect karni chaheye,

    Rectangular patterns:-
    *Friends market waves ki shakal ma move krti hai na to seda up jati hai na seda down ati hai yeh different type ky*pattern*bnati hai aor aisy ma move hoti hai is ma apko knowledge hina cbye ky triangles bnti hai market ma rectangular patterns bbty hain bearish*bullish*stairs etc bnti hain aisy he jesa ap ny discuss ko*rectangle*ka to yeh bhi aik best indicator*pattern*hai jo apko firther market ki strategy btata hai
    Click image for larger version

Name:	28823b03d2a445b687ad2465c632da8f.jpeg
Views:	3
Size:	33.6 کلوبائٹ
ID:	12436596
    market ma butterfly*pattern*etc bhi bnty hain jin sy apko market ma trade entry aor exit ka planning set krny ma bahot asani hoti hai is ky elawa apko market ma stoploss aor take profit aor pending orders ki setting ma nhi asani hoti ha market kis support aor resistance ky sath firther apna rasta bna rahi hai yeh bhi humen indicate hota ha.
    Click image for larger version

Name:	bullish-rectangle-pattern-trading-strategy-1-1024x568.png
Views:	1
Size:	88.2 کلوبائٹ
ID:	12436599
    • #3 Collapse

      Re: جواب: bullish rectangle pattern

      Assalamualaikum Kise ho ap sab log me bilkul thek or khariyat se ho or umeed karta ho ke ap sab log bhi bilkul thek or khariyat se ho ge aj is thread me apko mePakistan forex trading ke ak bhot he important topic rectangle pattren ki importance ke bare me btao ga or me umeed karta ho ke jo information me apse share
      Karo ga wo apke knowledge or experience me zaror izafa kare ge or agar ap mere is thread pe amal karte he to ap ak kamyab trader ban sakte he or bhot sare
      Paise bhi kama sakte he isliye hme Pakistan forex forum pe apni pori mhenat or himmat se Kam karna chahye .

      What is Rectangle pattren?
      Rectangle aik klasiki takneeki tajzia ka namona hai jisay ufuqi lakiron ke zareya bayan kya gaya hai jo numaya madad aur muzahmat ko zahir karti hai. support par khareed kar aur muzahmat par beech kar ya farmission se break out ka intzaar karkay aur pemaiesh ke usool ko istemaal karkay kamyabi se tijarat ki ja sakti hai .

      Key Takeaway
      Aik rectangle is waqt hota hai jab qeemat ufuqi support aur muzahmati sthon ke darmiyan muntaqil hoti hai. patteren ishara karta hai ke koi rujhan nahi hai, kyunkay qeemat himayat aur muzahmat ke darmiyan oopar aur neechay jati hai. break out honay par mustateel khatam ho jata hai, aur qeemat mustateel se bahar ho jati hai. kuch tajir rectangle ki tijarat karna, neechay ke qareeb khareedna aur oopar ke qareeb bechna ya mukhtasir karna pasand karte hain, jabkay dosray break out ka intzaar karna pasand karte hain .

      Explanation
      Rectangle ki tashkeel takneeki tajzia mein" qeemat ke patteren" ki aik misaal hai. qeemat ke namoonay richard ke kaam se akhaz kiye gaye hain, jinhein takneeki tajzia ka baap samjha jata hai, aur adwerds aur meggi , jinhon ne likha hai ke bohat se log is mauzo par bible ko samajte hain. takneeki tajzia ka yeh daur is waqt se akhaz hota hai jab graph paper par chart haath se rakhay jatay thay aur yahan tak ke saada moving average ( sma ) ko haath se ya barri, dhaki chhupi adding machine ke istemaal se barqarar rakhna parta tha. jadeed takneeki tajziye ke bajaye, jo isharay par inhisaar karta hai, jaisay moving average knorjns divergence ( macd ), takneeki tajzia karon ne yeh farz kya ke qeemat ke patteren –apne aap ko waqt bhar mein dohratay hain. patteren ki shanakht ka matlab patteren ki passion goi aur is terhan munafe ki tijarat hai .
      Click image for larger version

Name:	download - 2022-12-20T191157.065.png
Views:	16
Size:	3.4 کلوبائٹ
ID:	12436624
      • #4 Collapse

        Re: bullish rectangle pattern

        Introduction

        A common technical analysis pattern is the rectangle, which is represented by horizontal lines indicating considerable support and resistance. It may be traded effectively by waiting for a breakout from the pattern and applying the measuring concept, or by buying at support and selling at resistance. When the price oscillates between horizontal support and resistance levels, a rectangle is formed. As the price oscillates between support and resistance, the pattern suggests there is no trend.

        The Rectangle in Classical Technical Analysis

        In technical analysis, the rectangle formation is an illustration of a "price pattern." Price patterns are derived from the works of Edwards and Magee, who are widely regarded as the authors of the technical analysis canon, and Richard Schabaker, who is known as the founder of technical analysis. Technical analysis today has its roots in a time when graph paper was used for charts and simple moving averages (SMA) had to be updated manually or with the aid of a massive, cumbersome addition machine.Technical analysts presupposed that price patterns repeat themselves again throughout the course of time, contrary to current technical analysis, which focuses on indicators like moving average convergence divergence (MACD). Recognition of patterns enabled pattern prediction, which led to trading gains. Numerous pricing patterns are built around geometrical shapes. Triangles, pennants, and wedges come in ascending, descending, and symmetrical forms. On rare occasions, stranger forms like the head-and-shoulders configuration might be observed.

        The Rectangle: Supply and Demand in Balance

        You may imagine a pricing graph or chart as an X-ray of supply and demand. Supply and demand are roughly balanced for a long time in a rectangular pattern, as seen in Figure 1. The shares move in a constrained range, encountering resistance at the top of the rectangle and encountering support at its base. The rectangle can form swiftly among a somewhat wide-ranging sequence of limited variations or over a long period of time. Schabaker observes that in terms of proportions, it might resemble a square.In any case, it is a pattern which shows trader indecision, one in which the bulls and bears are approximately equally powerful.
        Click image for larger version

Name:	supply-and-demand-trading_body_USDSGDsettingstopsatsuppldordemandzones.png.full.png
Views:	22
Size:	14.0 کلوبائٹ
ID:	12436657
        The rectangle may be used as a continuation or reversal formation, most experts agree. As a reversal pattern, it brings an upward or downward trend to an end. It represents a break in the current trend as a continuation pattern, with the assumption that the previous trend would ultimately return. The rectangle depicts a struggle between buyers and sellers in any scenario. In the end, the shares breakout or collapse depending on whether accumulation or distribution prevailed.

        Significant" Support and Resistance

        Understanding the rectangle formation requires an understanding of support and resistance. Support is defined as any price level below the going market price where purchasing should materialise to halt a decline, at least momentarily. Contrarily, resistance is any price above the present market price when selling should start to occur in order to halt an advance, even only momentarily.What is sometimes referred to be "substantial" support or resistance, or a price level that has been visited repeatedly, appears as a rectangle. The diagramming of support and resistance calls for horizontal trendlines, but trendlines in technical analysis are often drawn on a diagonal.

        An Example of a Rectangle Formation

        Instead of using candlesticks, Figure 2 of ImClone Systems (IMCL) uses open-high-low-close bars. MACD and other indicators are not there. Only a 30-week moving average (MA), which may have been computed during the classical era, has been included.
        Click image for larger version

Name:	rectangle1-5c05846c46e0fb00012ef353.gif
Views:	1
Size:	2.8 کلوبائٹ
ID:	12436658
        On this graph, there are a few things to note. First, take notice of the breaking of an intermediate uptrend line that has been in place for around a year. The break indicates that the upswing is over. Therefore, the extended rectangle can either be a consolidation formation or a reversal formation. The pattern's interpretation is undetermined until there is a breakdown or breakout from the rectangle's boundaries, which are about $37.50 to $47.50. Second, the chart's horizontal lines indicate strong support and resistance. First created in September, significant support was tested twice in the early part of the year, and then again in June. There was enough buying activity at each support test to raise the stock.
        • #5 Collapse

          Re: bullish rectangle pattern

          Introduction of Bullish Rectangle pattern


          My dear forex member Apne akshar market mein is police rectangle pattern ko bante dekhta honge Jo ke zigzag ke pattern ki Tarah sem hota hai police rectangle pattern ek type ka chart pattern hota hai jismein ek police break out ke bad candlestick chart pattern per ek type ki limit hoti hai yah pattern forex market mein trend ke reversal aur continue rahane ko indicate karta hai to trader forex market mein jab inter karte Hain to usse unko continuation chart pattern ke taur per use kar sakte hain yah ek bhulesh rectangle pattern hota hai jo ki green candles ke upar muft Mel hota hai yah Bhi ek kism ka chart pattern Nahin hota hai jo ki bahut jyada important pattern mana jata hai iske liye hamen jyada se jyada acchi mehnat Karni chahie


          Explanation and identification of Bullish Rectangle pattern


          My dear forex member sabse hamare liye Jo jyada important baat Hoti hai vah Hoti hai identification ki kyunki jitna jyada aap log easily identify karenge utna hi jyada aap log isiliye market mein aasani ke sath entry kar payenge jab aapki aasani ke sath entry kar payenge to aap easily profit take kar sakte hain kyunki aap logon ke liye jyada important hota hai profit ka hasil karna profit aap use time hasil karenge jab aap Kisi bhi chij ko ya Kisi bhi chart pattern ko aasani ke sath identify kar lenge aur dantify karne ke liye aapke pass good information ka hona lajmi hai rectangle chart pattern forex market ke halat ko dekhte hue 1 se chart pattern ke dauran price ek hi side mein Chali jaati hai aur forex market use time ke sath price ke andar open ho jata hai level Nahin honge to is Tarah se Ham isko identify nahin kar payenge to yah use time police rectangle pattern Nahin kahlayega aur forex market mein resistance room per tu type ke touch hona lajmi hai


          What is breakout of Bullish Rectangle pattern


          My dear forex member aksar aap dekhte honge ki jab Bhi Koi Bhi char pattern banta hai to usmein market breakout lajmi Hoti hai jaisa ki hamare pass resistance level ho gaya ya support level ho Gaya ismein jab Bhi market break out hoti hai to market usi taraf jaati hai jis taraf market pahle move kar rahi hoti hai ab agar far se Karen ki ismein market forex market mein sabse important step yah hai aapko forex market ki carefully se check karna chahie Taki forex market ke break aur se bache rahen usse mahfuj rahe hain forex market mein ek achcha break out ware bulls candle stick se ke sath hota hai jo ki bullish scandalistic per maujud hota hai jismein police candlestick ki ratio bahut jyada hoti hai aur hamen is chij ko acchi Tarah se identify karya ke market mein entry leni chahie agar market ka break out ho jaaye to jis taraf market move ment kar rahi hoti hai to market hamesha use side per hi move karte rahti hai aur uski Jo movement uski speed hoti hai bahut tej hoti hai


          Treading with this pattern


          My dear forex member hamare liye Jo important baat Hoti hai vah Hoti hai trading UK heart trader acchi trade Nahin Laga sakta ya FIR Koi aise trader hote hain jinko identification ka pata nahin hota vah ya FIR acchi Tarah se final hi kar paate kyunki identify karna bahut jyada mushkil kam hota hai jab aap market mein yah pattern banta dekhte hain to ismein aapke Jahan mein ek chij aati hai kyunki yah bahut jyada risky chart pattern hota hai kyunki ismein market mein jo zigzag movement hota hai iske rectangular pattern hota hai yah bilkul resistance aur support level ka pattern hota hai kabhi reservations level ko touch karte Hain to kabhi support level ko touch karte hain FIR dobara resistance level ki Tarah Chali jaati hai to fir dobara niche ki taraf a jaati hai to usi time ek rectangular bullish chart pattern banta hai jo ke bil ko lekar rectangular shape ka hota hai aur ismein market Tut bhi sakti hai aur market use time break out Hogi jab market kabhi speed mein jyada Hogi jab aap ismein trade lagate Hain to ismein aapko bahut jyada achcha entry point Lena chahie kyunki jitna jyada aap logon ka entry point achcha Hoga utna hi jyada aap log ismein se achcha profit hasil kar payenge ab ismein market jab agar break out mein aane lagte to usmein police canistic pattern ki tadad jyada hoti hai to iska matlab hai market mein upward jana hai to isase yah jahar hota hai ki aap aapane Bank ka signal apply karna hai aur stop loss bilkul niche lagana hai iske stop loss lagana lajmi hai stop loss aapke account ko sev rakhta hai aapki equity balance ko sev rakhta hai aur risk ke chances ko kam karta hai


          • #6 Collapse

            Re: bullish rectangle pattern

            bullish rectangle pattern
            Introduction of Bullish Rectangle pattern

            forex member Apne akshar market mein is police rectangle pattern ko bante dekhta honge Jo ke zigzag ke pattern ki Tarah sem hota hai police rectangle pattern ek type ka chart pattern hota hai jismein ek police break out ke bad candlestick chart pattern per ek type ki limit hoti hai yah pattern forex market mein trend ke reversal aur continue rahane ko indicate karta hai to trader forex market mein jab inter karte Hain to usse unko continuation chart pattern ke taur per use kar sakte hain yah ek bhulesh rectangle pattern hota hai jo ki green candles ke upar muft Mel hota hai yah Bhi ek kism ka chart pattern Nahin hota hai jo ki bahut jyada important pattern mana jata hai iske liye hamen jyada se jyada acchi mehnat Karni chahie

            The Rectangle in Classical Technical Analysis

            In technical analysis, the rectangle formation is an illustration of a "price pattern." Price patterns are derived from the works of Edwards and Magee, who are widely regarded as the authors of the technical analysis canon, and Richard Schabaker, who is known as the founder of technical analysis. Technical analysis today has its roots in a time when graph paper was used for charts and simple moving averages (SMA) had to be updated manually or with the aid of a massive, cumbersome addition machine.Technical analysts presupposed that price patterns repeat themselves again throughout the course of time, contrary to current technical analysis, which focuses on indicators like moving average convergence divergence (MACD). Recognition of patterns enabled pattern prediction, which led to trading gains. Numerous pricing patterns are built around geometrical shapes. Triangles, pennants, and wedges come in ascending, descending, and symmetrical forms. On rare occasions, stranger forms like the head-and-shoulders configuration might be observed.

            The Rectangle: Supply and Demand in Balance


            You may imagine a pricing graph or chart as an X-ray of supply and demand. Supply and demand are roughly balanced for a long time in a rectangular pattern, as seen in Figure 1. The shares move in a constrained range, encountering resistance at the top of the rectangle and encountering support at its base. The rectangle can form swiftly among a somewhat wide-ranging sequence of limited variations or over a long period of time. Schabaker observes that in terms of proportions, it might resemble a square.In any case, it is a pattern which shows trader indecision, one in which the bulls and bears are approximately equally powerful

            Treading with this pattern

            forex member hamare liye Jo important baat Hoti hai vah Hoti hai trading UK heart trader acchi trade Nahin Laga sakta ya FIR Koi aise trader hote hain jinko identification ka pata nahin hota vah ya FIR acchi Tarah se final hi kar paate kyunki identify karna bahut jyada mushkil kam hota hai jab aap market mein yah pattern banta dekhte hain to ismein aapke Jahan mein ek chij aati hai kyunki yah bahut jyada risky chart pattern hota hai kyunki ismein market mein jo zigzag movement hota hai iske rectangular pattern hota hai yah bilkul resistance aur support level ka pattern hota hai kabhi reservations level ko touch karte Hain to kabhi support level ko touch karte hain FIR dobara resistance level ki Tarah Chali jaati hai to fir dobara niche ki taraf a jaati hai to usi time ek rectangular bullish chart pattern banta hai jo ke bil ko lekar rectangular shape ka hota hai aur ismein market Tut bhi sakti hai aur market use time break out Hogi jab market kabhi speed mein jyada Hogi jab aap ismein trade lagate Hain to ismein aapko bahut jyada achcha entry point Lena chahie kyunki jitna jyada aap logon ka entry point achcha Hoga utna hi jyada aap log ismein se achcha profit hasil kar payenge ab ismein market jab agar break out mein aane lagte to usmein police canistic pattern ki tadad jyada hoti hai to iska matlab hai market mein upward jana hai to isase yah jahar hota hai ki aap aapane Bank ka signal apply karna hai aur stop loss bilkul niche lagana hai iske stop loss lagana lajmi hai stop loss aapke account ko sev rakhta hai aapki equity balance ko sev rakhta hai aur risk ke chances ko kam karta hai

            What is Rectangle pattren?
            Rectangle aik klasiki takneeki tajzia ka namona hai jisay ufuqi lakiron ke zareya bayan kya gaya hai jo numaya madad aur muzahmat ko zahir karti hai. support par khareed kar aur muzahmat par beech kar ya farmission se break out ka intzaar karkay aur pemaiesh ke usool ko istemaal karkay kamyabi se tijarat ki ja sakti hai .

            Key Takeaway
            Aik rectangle is waqt hota hai jab qeemat ufuqi support aur muzahmati sthon ke darmiyan muntaqil hoti hai. patteren ishara karta hai ke koi rujhan nahi hai, kyunkay qeemat himayat aur muzahmat ke darmiyan oopar aur neechay jati hai. break out honay par mustateel khatam ho jata hai, aur qeemat mustateel se bahar ho jati hai. kuch tajir rectangle ki tijarat karna, neechay ke qareeb khareedna aur oopar ke qareeb bechna ya mukhtasir karna pasand karte hain, jabkay dosray break out ka intzaar karna pasand karte hain .

            Explanation
            Rectangle ki tashkeel takneeki tajzia mein" qeemat ke patteren" ki aik misaal hai. qeemat ke namoonay richard ke kaam se akhaz kiye gaye hain, jinhein takneeki tajzia ka baap samjha jata hai, aur adwerds aur meggi , jinhon ne likha hai ke bohat se log is mauzo par bible ko samajte hain. takneeki tajzia ka yeh daur is waqt se akhaz hota hai jab graph paper par chart haath se rakhay jatay thay aur yahan tak ke saada moving average ( sma ) ko haath se ya barri, dhaki chhupi adding machine ke istemaal se barqarar rakhna parta tha. jadeed takneeki tajziye ke bajaye, jo isharay par inhisaar karta hai, jaisay moving average knorjns divergence ( macd ), takneeki tajzia karon ne yeh farz kya ke qeemat ke patteren –apne aap ko waqt bhar mein dohratay hain
             
            • #7 Collapse

              Re: bullish rectangle pattern

              what is bluish rectangle My dear forex member hamare liye Jo important baat Hoti hai vah Hoti hai trading UK heart trader acchi different type ky*pattern*bnati hai aor that price patterns repeat themselves again throughout the course Nahin Laga sakta ya FIR Koi aise trader hote hain jinko identification ka pata nahin hota vah ya FIR acchi Tarah se final hi kar paate kyunki identify karna bahut jyada mushkil kam hota hai jab aap market mein yah pattern banta dekhte hain to ismein aapke Jahan mein ek chij aati hai kyunki yah bahut jyada risky chart pattern hota hai kyunki ismein market mein jo zigzag movement hota hai iske rectangular pattern hota hai halt an advance, even only momentarily.What is sometimes referred to be "substantial" support or resistance, or a price level that has been visited repeatedly, appears as a rectangle yah bilkul resistance a
              ur support level ka pattern hota hai kabhi reservations level ko touch karte Hain to kabhi support level ko touch karte jyada achcha entry point Lena chahie kyunki jitna jyada aap logon ka entry point achcha Hoga utna hi jyada aap log ismein se achcha profit hasil kar payenge ab ismein market jab agar break out mein aane lagte to usmein police canistic pattern ki tadad jyada hoti hai to iska matlab hai market mein upward jana hai to isase yah jahar hota hai ki aap aapane Bank ka signal apply karna hai aur stop loss bilkul niche lagana hai iske stop loss lagana lajmi hai stop loss aapke account ko sev rakhta hai aapki equity balance ko sev rakhta hai aur risk ke chances ko kam karta . overviewUnderstanding the rectangle formation requires an understanding of support and resistance. Support is defined as any price level below the going market price where purchasing should time break out Hogi jab market kabhi speed mein jyada Hogi jab aap ismein trade lagate Hain to ismein aapko bahut jyada achcha entry point Lena chahie kyunki jitna jyada aap logon ka entry point achcha Hoga utna hi jyada aap log ismein se achcha profit hasil kar payenge ab ismein market jab agar break out mein aane lagte to usmein police canistic pattern ki tadad jyada hoti hai to iska matlab hai market mein upward jana hai to isase hain FIR dobara resistance level ki Tarah Chali jaati hai to fir dobara niche ki taraf a jaati hai to usi time ek rectangular bullish chart pattern banta hai jo ke bil ko lekar rectangular shape ka hota hai aur ismein market Tut bhi sakti hai aur market use time break out Hogi jab market kabhi speed mein jyada Hogi jab aap ismein trade lagate Hain to ismein aapko bahut jahar hota hai ki aap aapane Bank ka signal apply karna hai aur stop loss bilkul niche lagana hai iske stop loss lagana lajmi hai stop loss aapke account ko sev rakhta hai aapki equity balance ko sev materialise to halt a decline, at least momentarily. Contrarily, resistance is any price above the present market price when selling should start to occur in order to halt an advance, even only momentarily.What is sometimes referred to be "substantial" support or resistance, or a price level that has been visited repeatedly, appears as a rectangle. The diagramming of support and resistance calls for horizontal trendlines, but trendlines in technical analysis are often drawn on a diagonal.
              Role in trading .the rectangle formation is an illustration of a "price pattern." Price patterns are derived from the different type ky*pattern*bnati hai aor that price patterns repeat themselves again throughout the course of time, contrary to technical analysis, which focuses on indicators like moving of Edwards and Magee, who are widely regarded as the authors of the technical analysis canon, and Richard Schabaker, who is known as the founder of technical analysis. Technical analysis today has its roots in a time when graph paper was used for charts and simple moving averages (SMA) had to be updated manually or with the aid of a massive, cumbersome addition machine.Technical analysts presupposed that price patterns repeat themselves again throughout the course of time, contrary to technical analysis, which focuses on indicators like moving average convergence divergence (MACD). Recognition of patterns enabled pattern prediction, which led to trading gains. current Numerous pricing patterns are built around geometrical shapes. Triangles, pennants, and wedges come in ascending, descending, and symmetrical forms. On rare occas
              Helpful for traders
              *Friends market waves ki shakal ma move krti hai na to seda up jati hai na seda down ati hai yeh different type ky*pattern*bnati hai aor that price patterns repeat themselves again throughout the course of time nahin hota vah ya FIR acchi Tarah se final hi kar paate kyunki identify karna bahut jyada mushkil kam hota hai jab aap market mein yah pattern banta dekhte hain to ismein aapke Jahan mein ek chij aati hai kyunki yah bahut jyada risky chart pattern hota hai kyunki ismein market mein jo zigzag movement hota hai iske rectangular pattern hota hai halt contrary to technical analysis, which focuses on indicators like moving average convergence divergence (MACD). Recognition of patterns enabled pattern prediction, which led to trading gains. current ma move hoti hai is ma apko knowledge hina cbye ky triangles bnti hai market ma rectangular patterns bbty hain bearish*bullish*stairs etc bnti hain aisy he jesa ap ny discuss ko*rectangle*ka to yeh bhi aik best indicator*pattern*hai jo apko firther market ki strategy btata hai
              • <a href="https://www.instaforex.org/ru/?x=ruforum">InstaForex</a>
              • #8 Collapse

                Re: bullish rectangle pattern

                INTRODUCTION
                Dear buddies asalamo alykum kesay hain ap sab umeed hay ap sab tek hon gay aur aap ka trading week bhi acha ja rha ho ga.yeh pattern*aur indicator humari trading main bht important role play karty hain.yeh humain profit delany main bht madad karty hain. Hum agr in ki learning nai krain gy or in ko fazool samjyn gy to kbi b kamyabi humary kadam ni choomy gi aaj hum jis topic per bat krain gay wo hai bullish rectangle pattern.rectangle aik classical technical analysis pattern hai jisay horizontal lines kay zariye biyaan kiya geya hai jo bhut zarori support aur resistance ko zahir karta hai support par kharid kar aur resistance par sell kar k ya formation say breakout ka wait kar kay aur pemaish kay asoolo ko use kar kay kamyabi say trading ki ja sakti hai.Aik rectangle us waqt hota hai jab keemat horizontal support aur resistance level kay darmiyan muntaqil hoti hai.
                Pattern ishara karta hai kay koi trend nai hai kyun kay keemat support aur resistance kay darmiyan oper nichay jati hai.breakout honay par rectangle khatam ho jata hai.aur keemat rectangle say bahir ho jati hai.kch trader rectangle ki trading krna lower kay qareeb khardina aur oper kay kareeb bechna ya mukhtasar krna pasand krtay hain jab kay dusray breakout ka intezar krna pasand krtay hain.


                Click image for larger version

Name:	images (5).png
Views:	3
Size:	4.8 کلوبائٹ
ID:	12436698


                BULLISH RECTANGLE PATTERN IN FOREX
                Bullish rectangle continuation kay pattern hotay hain jo us waqt hotay hain jab keemat kisi operi trend doraan arzi tor par ruk jati hai.wo ap ko buying ka moqa farham krtay hain ap rectangle ki operi resisitance level kay toot janay kay bad apni taweel trading main dakhil hotay hain yah traiqa 2 kay mamlay me is kay toot janay kay bad aur pir dobara test krnay kay bad.sab say phelay support par kharidna aur resistance par sell karna hai.koi resistance par mukhtasir sell bhi kar sakta hai aur support par mukhtasir sell ka ehata bhi kar skta hai.rectangle ki trading ka dusra traiqa breakout ka wait karna hai.kch trader rectangle ki trading krna lower kay qareeb khardina aur oper kay kareeb bechna ya mukhtasar krna pasand krtay hain jab kay dusray breakout ka intezar krna pasand krtay hain.


                Click image for larger version

Name:	images (6).png
Views:	2
Size:	16.0 کلوبائٹ
ID:	12436699

                اب آن لائن

                Working...
                X