Aslam u alaikum,
Dear forex member umeed karta hun aap sab khairiyat se honge aur apka trading week bahut acha jaa raha ho ga.
Dear forex member umeed karta hun aap sab khairiyat se honge aur apka trading week bahut acha jaa raha ho ga.
dear members trading karty hovy aksr hum indicators use karty hain jo k trading main helpful hoty hain or in main se aik relative strength index ha jsko aj hum tafseel se study karen gy.
Relative strength index Kia h??
Dear members relative strength index aik momentum indicator ha jo k hamen market k trend or eski strength k bary main btata ha.
esko shortly RSI kaha jata ha. Or es main 3 levels hoty hain jo k market main trend ki strength ko indicate karty hain.
Aik level 80-100 ka hota ha jo k bullish trend ki peak hota ha.
Dosra level 0-20 ka hota ha jo k bearish trend ki peak hota ha.
or in dono k darmyan 50 ka level hota ha jo k neutral level smjha jata ha.
market buy trend main ho or RSI 50 se opr ho to ye strong bullish trend ki nishani hota ha.
or jb market downtrend main ho or RSI 50 se nechy ho to ye strong bearish trend ki nishani hota ha.
es k ilawa RSI hamen sell or buy k signals bhi deta ha.
Overbought RSI Kia h??
Dear members jb market uptrend main kafi opr ja chUki ho Or RSI 80 ya es se opr ki values show kar raha ho to esko overbought kaha jata ha or es k bad market main reversal expect kia jata ha k buyers ab market se exit hn gy or sellers in hn gy.
es wqt hm market main price action se confirmation k bad sell ki trade le skty hain.
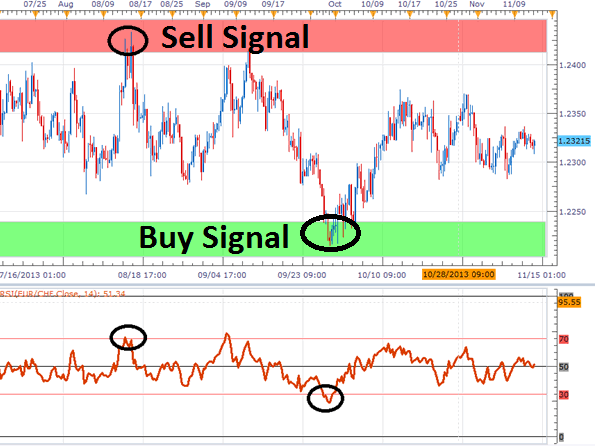
Oversold RSI Kia h??
Dear members jb market downtrend main kafi nechy ja chuki ho or RSI 20 ya es se km values show kar raha ho to esko oversold RSI kaha jata ha or es k bad market main trend reversal expect kia hata ha or sellers ki strength km
hoti ha markey main buyers in hoty hain.
es time py hum price action se confirmation k bad buy ki trade le skty hain.
RSI divergence Kia h??
Dear members divergence us situation ko khty hain jb price action or RSI ki direction different ho jy.
for example RSI higher lows or higher highs bnay jb k market lower lows or lower highs bnay esko divergence kaha jata ha or ye bhi market main trend reversel ki bishani hoti ha.
Eski 2 types hoti hain.
Bullish Divergence
Bearish Divergence
Bullish divergence k bad market buy main jati ha.
jb k bearish divergence k bad market sell main jati ha.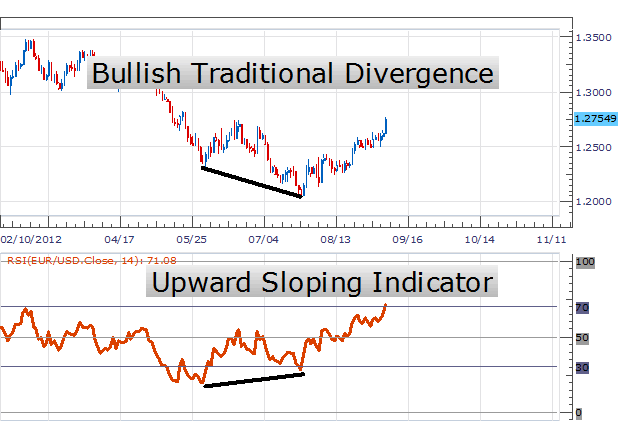
Relative strength index Kia h??
Dear members relative strength index aik momentum indicator ha jo k hamen market k trend or eski strength k bary main btata ha.
esko shortly RSI kaha jata ha. Or es main 3 levels hoty hain jo k market main trend ki strength ko indicate karty hain.
Aik level 80-100 ka hota ha jo k bullish trend ki peak hota ha.
Dosra level 0-20 ka hota ha jo k bearish trend ki peak hota ha.
or in dono k darmyan 50 ka level hota ha jo k neutral level smjha jata ha.
market buy trend main ho or RSI 50 se opr ho to ye strong bullish trend ki nishani hota ha.
or jb market downtrend main ho or RSI 50 se nechy ho to ye strong bearish trend ki nishani hota ha.
es k ilawa RSI hamen sell or buy k signals bhi deta ha.
Overbought RSI Kia h??
Dear members jb market uptrend main kafi opr ja chUki ho Or RSI 80 ya es se opr ki values show kar raha ho to esko overbought kaha jata ha or es k bad market main reversal expect kia jata ha k buyers ab market se exit hn gy or sellers in hn gy.
es wqt hm market main price action se confirmation k bad sell ki trade le skty hain.
Oversold RSI Kia h??
Dear members jb market downtrend main kafi nechy ja chuki ho or RSI 20 ya es se km values show kar raha ho to esko oversold RSI kaha jata ha or es k bad market main trend reversal expect kia hata ha or sellers ki strength km
hoti ha markey main buyers in hoty hain.
es time py hum price action se confirmation k bad buy ki trade le skty hain.
RSI divergence Kia h??
Dear members divergence us situation ko khty hain jb price action or RSI ki direction different ho jy.
for example RSI higher lows or higher highs bnay jb k market lower lows or lower highs bnay esko divergence kaha jata ha or ye bhi market main trend reversel ki bishani hoti ha.
Eski 2 types hoti hain.
Bullish Divergence
Bearish Divergence
Bullish divergence k bad market buy main jati ha.
jb k bearish divergence k bad market sell main jati ha.
تبصرہ
Расширенный режим Обычный режим