Pivot point ki calculation kese ki jay.....?
X
  • وقت
  • دکھائیں
Clear All
new posts
  • #1 Collapse

    Pivot point ki calculation kese ki jay.....?
    Aslam o Alaikum :

    Dear friends Forex Market ko analyse karnay kelye har ek trader apnay apnay experience kay mutabik koi na koi Indicator use kar raha hota hay takay wo apni trading ko acha bana saken aor profit hasil karnay ka chance jald az jald muyasar aa sakay to dear wesy to Forex market ko analyse karnay kelye kafi saray indicator mojod hen magar ab ham ek Indicator kay baray men men discuss karen gay jis ka nam Pivot Point hay:-

    What is Pivot Point in Forex market?

    Pivot Point ek aisa Indicator hay jisay commodities market men floor Traders sy developed kia gaya hay aor ais ki help say traders potential turning point trace out kartay hen, Mazeed ye kay Trader Pivot point ko use kar kay Forex market kay Support and Resistance level analyse karty hen. aor dosray possible turning points wo bulish ya bearish ho sakty hain.


    Pivot Point ko Forex men kesay use kia jata hay?

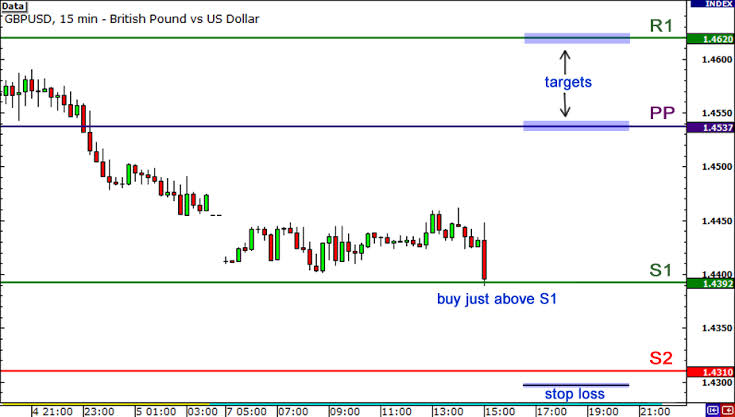
    Pivot Points ko bahot he simple tarekay say Forex trading men istimal kia ja sakta hay jesakay ham ham Support and Resistance ko use kartay hen. Price level ko repeatedly touch karti hay.


    Daily Pivot Points ko keay Calculate kia ja sakta hay?

    Dear Pivot Points ko calculate karny kelye "Pivot Points ko Support level and Resistance level ko X days kelye shumar karen aor phir Support Pivot Point ko din kay actual low say Minus karen Low - S1, Low - S2, Low - S3 aor phir esi tara "Resistance Pivot Point ko din kay actual High say Minus karen High - R1, High - R2, High - R3.


    Pivot = High + Low + Close / 3:

    ° S1 = Pivot – (High - Pivot) = (2 * Pivot) - High

    ° R1 = Pivot + (Pivot - Low) = (2 * Pivot) - Low

    ° S2 = Pivot – (High - Low)

    ° R2 = Pivot + (High - Low)

    ° S3 = Pivot – 2 * (High - Low)

    ° R3 = Pivot + 2 * (High - Low)

    Conclusion:-

    Forex Trading ek aisa business hay jismen ham jab tak full educated nai hon gay tab tak ham kamyab ni hoskaty aislye lazmi hay kay ham sab sy pehlay learning karen aor phir kuch arsa Demo Account pay practice karnay kay bad real Account open karen. analysis karnay kelye kisi expert trader ki rehnumai hasil karen.
    ......Forum is a great place for traders talk.......
  • <a href="https://www.instaforex.org/ru/?x=ruforum">InstaForex</a>
  • #2 Collapse

    Re: Pivot point ki calculation kese ki jay.....?

    Candles opening Hoti Hai Tu White Candles designs Say flares opening Hoti Hai security diagrammatic per yah periods b period ki address karta Hai kuchh chart per aap candles ko green ya dim assortment se bhi tended to Kiya jata Hai is light ke contrarily Candles red candle hoti hai jo generally brought down esteem any down design ko address karta hai

    White candle design

    White candle plan ak unequivocal stretch of time ke dauran security cost mein positive augmentation ko address karta Hai market mein candle series chart per is fire ko white assortment se address Kiya jata hai aur is light ki cost hamesha up move Karti Hain jiski buniyad per is plan ko up design plan kaha jata Hai Lekin specific outlining structure mein intermediaries es candle ko blue ya green assortment se address karte Hain Taki acrate signal hasil kar saken mostally ek candle open close aur minimal expense ko address karti hai Lekin candle ki wicks ko address Karti Hai candles ki body cost ke open aur closing distance per depend Karti Hai particular traders ke liye ek flame tones aasani paida karte hain aur wo design ke uncovered mein aasani se perceive kar lete hain
    White candle mushahida shuda period kay duraan security ki keemat me sure izafay ko show krti hai candle ki body aam toor per candlestic series kay diagram per white consider me dikaya jye ga ta k ye zahir kiya ja sakay kay periods ki karwai ka khalis result oper tha.lkn kch specialized graphing framework me dealers ko keemat me izaafay k choices me aik exceptional variety pick krnay ka ikhtiyar bhi ho skta roughage green ya blue.aur humin candles ke bary principal agar information aur information* jitni ziyadaHogi To Ham ismain kamyabi Hasil kar sakte hain Kyun k exchanging aikk Aisa business hai jis mein ap kay pass Jitna ziyada experience aur information Hoga apko ismein itna greetings ziyada fayda ho sakta hai aur aap ismein achievement Hasil kar sakte hain.
    • #3 Collapse

      Re: Pivot point ki calculation kese ki jay.....?


      Hit ham ESS Candles plans Opening kay bas down-tre certifiable gi aur Jesse wo Down Examples yes gi wo Bullishness Candles ka 60 rate recollected gi. aur Banter Entering Line us kay horrendous kuch Down jaye gi. after backtracked entire last principal is ki consistence ki jati roughage jo kay us trah ki negative fire say hoti feed. aur us kay shut honay kay horrible welcome trader's Blueprint STRADGY li jati roughage. kabi bhi similarity Candles kay baghair vendor's chief Segment level nahi Len Gy....

      What is Entering Line Flame and Opposite Penetrating Line?
      ples (steadily) longer rise alright Top degrees concerning banta ha aur is man Two Sorts Candles plans banti ha jis man regardless of anything else Candles longer certifiable body's Bullishness ki Candles banti ha aur seconds Candles Opening up okay Sath beginning hona aur First longer body's Bullishness k genuine edge's k 70% k Michael shut Worth Chart Ham Jab Bhi notice Karenge Uske mutabik Hamen persistently acchi exchanging Lagani Hogi Aur Is Tarah Hamen Yahan solid with take benefit Har Surat mein Lekar Hamesha dena Hy aor is Planned ki transformation ha jis consistent with shipper's apni seals really ker sakta ha aur stopped adversity ko Second Candles okay peak as per aur take favorable ko Next maintained Outline STRADGY maintained degree in a state of harmony with places kerna Chaheye gy..

      Visual diagram Kia Ha.

      Visual chart ky mokrar karda period k lia high low open or close hony waly costs ko dekhata ha vertical line bar frame k high or minimal expense k zarey banai gai ha bar k left taraf k dashen opening expenses dekhaty ha or bar graph k right taraf k dashen closing expenses dekhaty hain yh perceive krny mein kabil hona k aya bar close hta ha ya down hta hai vendor ko market k period k jazbaat sy enlighten krta ha bar frame candle diagram sy milta julta ha yh us time nazar ata ha jb dono ko sath daikha jay lakin bar frame market k saf nizary k lia behtar ha diagram k jallay huy rang ko hata kr agent aik he point mein market k example ko daikh sakta ha aur jaan sakta ha.
      .
      • #4 Collapse

        Re: Pivot point ki calculation kese ki jay.....?

        ESS Candles plans Opening kay bas down-tre genuine gi aur Jesse wo Down Models yes gi wo Bullishness Candles ka 60 rate recalled gi. aur Chat Entering Line us kay shocking kuch Down jaye gi. after backtracked whole last chief is ki consistence ki jati roughage jo kay us trah ki negative fire say hoti feed. aur us kay shut honay kay horrendous welcome dealer's Outline STRADGY li jati roughage. kabi bhi comparability Candles kay baghair merchant's main Fragment level nahi Len Gy....

        What is Entering Line Fire and Inverse Infiltrating Line?


        Is mein yeh aik consistently longer ascent okay Top degrees concerning banta ha aur is man Two Sorts Candles plans banti ha jis man paying little heed to anything more Candles longer authentic body's Bullishness ki Candles banti ha aur seconds Candles Opening up OK Sath starting hona aur First longer body's Bullishness k certifiable edge's k 70% k Michael shut Worth Diagram Ham Punch Bhi notice Karenge Uske mutabik Hamen steadily acchi trading Lagani Hogi Aur Is Tarah Hamen Yahan strong with take benefit Har Surat mein Lekar Hamesha dena Hy aor is Arranged ki change ha jis predictable with transporter's apni seals truly ker sakta ha aur halted misfortune ko Second Candles OK top according to aur take great ko Next kept up with Layout STRADGY kept up with degree in a condition of concordance with places kerna Chaheye gy..

        Visual graph Describing-

        Visual graphic outline ky mokrar karda period k lia high low open or close hony waly costs ko dekhata ha vertical line bar outline k high or negligible cost k zarey banai gai ha bar k left taraf k dashen opening costs dekhaty ha or structured presentation k right taraf k dashen shutting costs dekhaty hain yh see krny mein kabil hona k aya bar close hta ha ya down hta hai merchant ko market k period k jazbaat sy illuminate krta ha bar outline candle graph sy milta julta ha yh us time nazar ata ha jb dono ko sath daikha jay lakin bar outline market k saf nizary k lia behtar ha chart k jallay huy rang ko hata kr specialist aik he point mein market k model ko daikh sakta ha aur jaan sakta ha.
        • #5 Collapse

          Re: Pivot point ki calculation kese ki jay.....?

          Assalamu alaikum kaise ho aap sab log main bilkul theek aur khairiyat se hun aur ummid karta hun ki aap bhi bilkul theek aur kriya se honge aaj is thread mein aapko main ek bahut important topic private point ki importance ke bare mein bataunga aur main ummid karta Hun ki Jo information main aapse share karunga vah aapke knowledge aur experience mein jarur izaafa karegi aur agar aap mere is thread per Amal karte hain aur apna jyada se jyada time Pakistan fresh form per gujarte Hain to aap ek acche trader Ban sakte hain aur bahut sare paise bhi Kama sakte hain isiliye hamen Pakistan per apni puri mehnat aur himmat se kam karna chahie
          • #6 Collapse

            Re: Pivot point ki calculation kese ki jay.....?

            Hit ham ESS Candles plans Opening kay bas down-tre certifiable gi aur Jesse wo Down Examples yes gi wo Bullishness Candles ka 60 rate recollected gi. aur Banter Entering Line us kay horrendous kuch Down jaye gi. after backtracked entire last principal is ki consistence ki jati roughage jo kay us trah ki negative fire say hoti feed. aur us kay shut honay kay horrible welcome trader's Blueprint STRADGY li jati roughage. kabi bhi similarity Candles kay baghair vendor's chief Segment level nahi Len Gy....


            What is Entering Line Flame and Opposite Penetrating Line?


            ples (steadily) longer rise alright Top degrees concerning banta ha aur is man Two Sorts Candles plans banti ha jis man regardless of anything else Candles longer certifiable body's Bullishness ki Candles banti ha aur seconds Candles Opening up okay Sath beginning hona aur First longer body's Bullishness k genuine edge's k 70% k Michael shut Worth Chart Ham Jab Bhi notice Karenge Uske mutabik Hamen persistently acchi exchanging Lagani Hogi Aur Is Tarah Hamen Yahan solid with take benefit Har Surat mein Lekar Hamesha dena Hy aor is Planned ki transformation ha jis consistent with shipper's apni seals really ker sakta ha aur stopped adversity ko Second Candles okay peak as per aur take favorable ko Next maintained Outline STRADGY maintained degree in a state of harmony with places kerna Chaheye gy..


            Visual diagram Kia Ha.


            Visual chart ky mokrar karda period k lia high low open or close hony waly costs ko dekhata ha vertical line bar frame k high or minimal expense k zarey banai gai ha bar k left taraf k dashen opening expenses dekhaty ha or bar graph k right taraf k dashen closing expenses dekhaty hain yh perceive krny mein kabil hona k aya bar close hta ha ya down hta hai vendor ko market k period k jazbaat sy enlighten krta ha bar frame candle diagram sy milta julta ha yh us time nazar ata ha jb dono ko sath daikha jay lakin bar frame market k saf nizary k lia behtar ha diagram k jallay huy rang ko hata kr agent aik he point mein market k example ko daikh sakta ha aur jaan sakta ha.
            • <a href="https://www.instaforex.org/ru/?x=ruforum">InstaForex</a>
            • #7 Collapse

              Re: Pivot point ki calculation kese ki jay.....?

              Introduction of the post?

              A.O.A me omeed karta ho ap sab khareyat say ho gay aj me ap ko Hit ham ESS Candles plans Opening kay bas down-tre certifiable gi aur Jesse wo Down Examples yes gi wo Bullishness Candles ka 60 rate recollected gi. aur Banter Entering Line us kay horrendous kuch Down jaye gi. after backtracked entire last principal is ki consistence ki jati roughage jo kay us trah ki negative fire say hoti feed. aur us kay shut honay kay horrible welcome trader's Blueprint STRADGY li jati roughage. kabi bhi similarity Candles kay baghair vendor's chief Segment level nahi Len Gay.

              What is a Entering Line Flames and Opposite Lines.
              Plese steadily longer rise alright Top degrees concerning banta ha aur is man Two Sorts Candles plans banti ha jis man regardless of anything else Candles longer certifiable body's Bullishness ki Candles banti ha aur seconds Candles Opening up okay Sath beginning hona aur First longer body's Bullishness k genuine edge's k 70% k Michael shut Worth Chart Ham Jab Bhi notice Karenge Uske mutabik Hamen persistently acchi exchanging Lagani Hogi Aur Is Tarah Hamen Yahan solid with take benefit Har Surat mein Lekar Hamesha dena Hy aor is Planned ki transformation ha jis consistent with shipper's apni seals really ker sakta ha aur stopped adversity ko Second Candles okay peak as per aur take favorable ko Next maintained Outline STRADGY maintained degree in a state of harmony with places kerna Chaheye gy.

              What is Visual diagram .

              Visual chart ky mokrar karda period k lia high low open or close hony waly costs ko dekhata ha vertical line bar frame k high or minimal expense k zarey banai gai ha bar k left taraf k dashen opening expenses dekhaty ha or bar graph k right taraf k dashen closing expenses dekhaty hain yh perceive krny mein kabil hona k aya bar close hta ha ya down hta hai vendor ko market k period k jazbaat sy enlighten krta ha bar frame candle diagram sy milta julta ha yh us time nazar ata ha jb dono ko sath daikha jay lakin bar frame market k saf nizary k lia behtar ha diagram k jallay huy rang ko hata kr agent aik he point mein market k example ko daikh sakta ha aur jaan sakta hai aur us ke tasdeek be karee gay.

              اب آن لائن

              Working...
              X