average directional index indicator (ADX indicator)
X
  • وقت
  • دکھائیں
Clear All
new posts
  • #1 Collapse

    average directional index indicator (ADX indicator)
    ADX indicator ka tauraf
    Respected members forex me different kiss of indicator istemal jismein average directional index indicator hai jo hamen trend ki accurate identification mein helpful hota hai s indicator ko istemal karke ham bole aur bear stand ka ho andaza Laga sakte hain. indicators Hai bus unhen sahi tarike ke sath use karna chahie aur acchi tarah planning banaa karke hi uske tahat kam karna chahie jitni acchi aur strong Ham future ke liye planning banayenge utna hi achcha Ham kam kar payenge aur hamen uthan he achcha result dekhne ko milega bus proper focus ke sath kam karna chahie aur acche tarike ke sath kam karna chahie aur kabhi bhi 4x ke kam mein jyada rishta nahin Lena chahie acchi tarah kam Karenge aur acchi tarah plan banaa karke kam KarenClick image for larger version

Name:	download.png
Views:	16
Size:	7.8 کلوبائٹ
ID:	12568610
    ADX indicator ka istimal
    Average Directional Index ko market ky trend maloom krny ky leay bnaya gia hai. Waisy is ka main purpose jub is ko welles wilder wy bnaya to,Is ko commodity market ky daily chart ky analysis ky leay bnaya gia lkn Ganesh indicator ko istemal karne ke liye hamesha aapse kah de iska istemal Janna bahut jaruri hai yah indicator bahut achcha trend identification integrated ke taur per samjha jata hai isko istemal karte hue Ham bahut achcha profit gen kar sakte hain MT4 trading terminal mein is integrated ko aasani se istemal Kiya ja sakta hai
    Click image for larger version

Name:	images.png
Views:	11
Size:	19.5 کلوبائٹ
ID:	12568611
    Working of ADX indicator:
    Yah indicator previous session ki direction ko jaanch karte hue indicator kam karta hai indicator movie average ki phenomenon per Amal kar raha hota hai is indicator ko janne ke liye hamen moviece moving average ka istemal Janna bahut jaruri haiHamesha average basis per aapko calculation Deta Hai for example Agar ek car 95 kilometre per hours ki Raftar se ja rahi hai aur aap last 10 minutes Mein uski average dekhte hain to to jitni bhi Har minut Mein uski Raftaar Thi usko 10 per divide karte hain
  • <a href="https://www.instaforex.org/ru/?x=ruforum">InstaForex</a>
  • #2 Collapse

    Re: average directional index indicator (ADX indicator)

    What is Neck area.??
    Neck area asal Mn Better believe it dear people umeed krti ho sb khyrit se ho gy or forex trading me acha benefit hasil kr rhe ho gy. Mates hmare pas jitna data ho ga hm otna he kamyab ho ge. Jesa k hme step by step bonce melta he to agr hm achi poste kre ge to hme utna he acha benefit mely ga. Aj hm bt kre neck region k uncovered.
    Introduction..!!!
    Neck area Greetings Yahan Say part punch ham aik plan ki takmeel per fori section na lain to terrible head mazeed candles is plan ko modify kar daiti hain ya phir jald he yeh aik new model crucial adherent ho jata feed. Jab neck line per hamain proper area ka moqa nai mil saky to yeh jald he head and shoulder chief shift ho jata roughage. Iskay dreadful hit cost shoulder tak certifiable yani neck line ko break kar kay downside yes to he hamain neck region essential trading ka moqa milta criticism Ho Jaye Gii....

    what is neck area in forex exchanging

    Forex graph mama neck line ik support k zaryae act karti hai yet ik bar neck line break ho jaye to merchant ko invert ki exchange ko use karna chahe Yet jb tak neck line break out ni ho gi market k up jany k possibilities barh jayn gy Neck line completely flat ni ho sakti ye up ward slop or down ward slop mama happen ho sakti hai dealer ko ye bat zehan mama rakhni chahe k neck line jb break ho gi to showcase significant distance mama move kary gi Merchant zayada tar asy he focuses k intazar mama rehty hain Yet phr b broker ko apny experience ko use kar k he exchange ko open karna chaheb
    Neck area asal parts Mn agr ap market essential productive trading karna chahty hai to ap ko achi tara candle k related information leni ho gi or experience ko increase karna ho ga punch ap achi tara market key assessment kr k trading kar rahy hoty hain to ap ko bhot zyda benefits open hoty hain .ap ko humesa market head soch samjh k trading karna ho gi tak ap achi getting kar sakhy, or ap ko without experience k trading nahi karni chahy kun k es principal apko bhot zyda incident ho sakhta hai .
    • #3 Collapse

      Re: average directional index indicator (ADX indicator)

      Urgent Examination Kia Hein

      Dear pals agar tou market apni normal endpoints ky darmian hello there progression kerti rehti hai tou aesy time per Ham support sy purchase ki exchange enter ker lety hain aur block sy sell ki exchange enter kerty hain tou market bhi hamari assumptions ky mutabiq improvement kerty huey hamain acha benefit dy jati hai lekin hit same help ya opposition break hoti hai tou aesy fundamental hamain cost activity breakout stretigy ky sath exchange open kerni chahiay ky punch market support ki break ker leti hai tou wahan sy bhi sell ki exchange enter hoti hai isi terha poke market impediment ko break kerti hai tou wahan sy bhi Ham purchase ki exchange enter kerty hain kyun ky cost activity breakout hony per market same course head bahot bari progression ker sakti hai tou aesy time key visit bearing boss open ki jany wali exchange key bara mishap bhi ho sakta hai

      Cost movement Using Significant Examination

      aor reorslz ko phchannay aor a ke tshreh krnay ke apne slahet ko bhtr bnanay kay leay، tajr mkhtlf diagram kmpozeshn astamal krtay hen۔ aopr ya nechay kay seshn kay tnazr men khle، aale، km، aor qrebe qdren، js say yh dekhna aasan ho jata feed kh qemten kesay bdlte hen۔
      hrame kras، anglfng petrn، aor ten sfed spahe shma kay nmonon ke tmam msalen hen jn ko bsre zenith pr qemt ke karroae'e say taber kea ja skta hay۔ as bat ka andazh lganay kay leay kh aagay kea hoga، qemt ke karroae'e mtadd azafe kendl stk farmeshnz tear krte hay۔ degr qsm kay chart، jesay poae'nt aend fgr charts، baks charts، baks plat ogherh، anhe nmonon ko astamal kr sktay hen۔
      tkneke asharay ka hsab lgatay oqt، bht say tkneke tjzeh kar diagram pr bsre shklon kay bjae'ay prae's aekshn deta astamal krtay hen۔ as ka mqsd qemt ke baz aoqat bzahr inlet trteb hrkt men trteb ka pth lgana hay۔ qemt ka aml as bat ke nshandhe krta feed kh belon nay mtadd bar brek aaؤt ke koshsh ke roughage aor hr bar rftar hasl ke، lhza qemt kay aekshn frame pr design lae'nz ko lago krkay aek chrrhtay hoe'ay msls petrn ko mmknh brek aaؤt ka andazh lganay kay leay astamal kea ja skta feed
      • #4 Collapse

        Re: average directional index indicator (ADX indicator)

        Average Directional Index Indicator
        Average Directional movement index J. Wellies Wilder ne create kia tha. Average Directional movement Indicator 3 inductors ko combine krta hai to create a smooth moving average that is then shown on your charts.Average Directional Index Indicator Ek technical tour hai jo Hamen indication provide Karta Hai Ek accurate trend ki aur is train ke sath trading intehai Aasan Ho Jaati Hai yah friend positive bhi ho sakta hai aur negative bhi ho sakta hai yah volume aur trade ko average Karke Ek Hamen direction provide kar raha Hota Hai. average directional index ko trend ki strength ki ko jaanchnay ke liye istemal Kiya jata hai friends indicator negative directional index co bhi show karta hai aur positive directional Intex indicator ko bhi show karta hai average directional index indicator total three lines main composed Hota hai aur friends average directional index indicator Ek bahut hi important indicator hota hai Jisko trading ke liye use Kiya jata hai market Mein traders indicator ko technical analysis ki best per use kar sakte hain.

        Click image for larger version

Name:	images (3).jpeg
Views:	11
Size:	29.9 کلوبائٹ
ID:	12438224
        Average Directional Index Indicator ki wazahat
        Average Directional index Momentum based trading ñindicator hai jo trader ko market mein create hone wale friend ki power ke bare mein indicate karta hai aur trading mein bahut hi useful sabit hota hai aur dear trend continue kary gi market kab apna trend reverse kary gi is liye jin trader ko humesha apni trades open karny k liye achy time ki talash hoti hai ye indicator un k liye best hai ye indicator un k kaam karny mein bht help kar sakta hai ye trader ko market k trend k bary mein guide karta hai.


        Click image for larger version

Name:	images (4).jpeg
Views:	7
Size:	16.9 کلوبائٹ
ID:	12438225
        Average Directional Index Indicator ky sath trading strategy
        Average directional index ki range zero sa a hundred tk hoti ha, jis k zariay 25 sa above values trending market ko display karti hain jb okay 20 sa under values ye display karti hain ok trend ki in addition second bht km ya na honay okay barabar ha, zero fee charges ki kisi aik course ma second karnay ka indication daiti ha jo superb ya negative ho sakti ha, ADI ma 60 sa above bht km values hoti hain lakin in sa sturdy fashion ka pata chalta ha, jb k indicator ki fee 100 ho to ye extremely robust trend ka sign hota ha,Positive Average Directional Index traders ko market sey related best signals provide Karta Hai

        Click image for larger version

Name:	images (10).png
Views:	1
Size:	34.7 کلوبائٹ
ID:	12438226
        • #5 Collapse

          Re: average directional index indicator (ADX indicator)

          forex trading mein shaamil honay walay taajiron ki tadaad aur ziyada der tak rehne walay shurka ki tadaad ke darmiyan bohat bara farq hai. itnay barray farq ki chand wajohaat darj zail hain .


          forex trading field ki ghalat tasweer :


          yahi bunyadi wajah hai ke tajir zindagi ke dosray shobo par ghhor nahi karte jahan koi bhi kaam ya kaam karne ke liye bunyadi seekhnay ke tareeqay zaroori hain. aik ghalat fehmi hai ke trading account shuru karna, usay fund dena, aur kaarobar shuru karna, is shobay mein anay ke liye kaafi hai, aur yeh aap ko aglay chand ghanton ya dinon mein paisa kamanay ki taraf le jaye ga. forex market aalmi maeeshat ki tasweerai numaindagi hai, aur itnay wasee ilaqay mein kaam karne ke liye, hamein aap ki tarbiyat ke liye khusoosi ilm aur makhsoos mashq ki zaroorat hai .


          koi tijarti hikmat e amli nahi :


          nakami ki aik aur ahem wajah is waqt hoti hai jab kuch ibtidayi afraad thori der ke liye seekhnay ki koshish karte hain aur live trading khatam karte hain. taleem haasil karna aap ki haqeeqi zindagi mein is waqt tak madad nahi kar sakta jab tak ke aap is baat ka andaza nah lagayen ke aap ki taleem haqeeqi tijarti account par kaisay kaam karti hai. naye tajir demo account par mashq karkay is ki tasdeeq kar satke hain. forex demo account bilashuba ibtidayi afraad ke liye apna tijarti mansoobah tarteeb dainay ka aik ahem option hai, jo haqeeqi account ke sath tijarat karte waqt dhaal aur talwar ka kaam karta hai. hum is ke tijarti mansoobay ko aik sath rakh satke hain, jisay aam tor par tijarti hikmat e amli ke naam se jana jata hai, jab hamaray paas mutalea aur mashq ki aik khaas satah hoti hai. muaser hikmat e amli ke baghair forex trading batting ke mutradif hai, aur batting paisa kamanay ka sahih tareeqa nahi ho sakta .


          nateeja :

          mandarja baala behas se, hum yeh nateeja akhaz kar satke hain ke agar hum forex trading mein kamyaab hona chahtay hain, to hamein un cheezon par tawajah markooz karni chahiye jaisay

          tarbiyat
          mashq karen .
          tijarti hikmat e amli tayyar karen .
          trading sabr
          nafsiati awamil par control
          • #6 Collapse

            Re: average directional index indicator (ADX indicator)

            Dear buddies agar tou market apni typical endpoints ky darmian hi movement kerti rehti hai tou aesy time per Ham support sy buy ki trade enter ker lety hain aur block sy sell ki trade enter kerty hain tou market bhi hamari suppositions ky mutabiq improvement kerty huey hamain acha benefit dy jati hai lekin hit same assistance ya resistance break hoti hai tou aesy essential hamain cost action breakout stretigy ky sath trade open kerni chahiay ky punch market support ki break ker leti hai tou wahan sy bhi sell ki trade enter hoti hai isi terha jab market obstruction ko break kerti hai tou wahan sy bhi Ham buy ki trade enter kerty hain kyun ky cost action breakout hony per market same course head bahot bari movement ker sakti hai tou aesy time key visit bearing manager open ki jany wali trade key bara setback bhi ho sakta hai

            Cost development Utilizing Huge Assessment


            aor reorslz ko phchannay aor a ke tshreh krnay ke apne slahet ko bhtr bnanay kay leay، tajr mkhtlf chart kmpozeshn astamal krtay hen۔ aopr ya nechay kay seshn kay tnazr men khle، aale، km، aor qrebe qdren، js say yh dekhna aasan ho jata feed kh qemten kesay bdlte hen۔
            hrame kras، anglfng petrn، aor ten sfed spahe shma kay nmonon ke tmam msalen hen jn ko bsre apex pr qemt ke karroae'e say taber kea ja skta hay۔ as bat ka andazh lganay kay leay kh aagay kea hoga، qemt ke karroae'e mtadd azafe kendl stk farmeshnz tear krte hay۔ degr qsm kay chart، jesay poae'nt aend fgr charts، baks charts، baks plat ogherh، anhe nmonon ko astamal kr sktay hen۔
            tkneke asharay ka hsab lgatay oqt، bht say tkneke tjzeh kar outline pr bsre shklon kay bjae'ay prae's aekshn deta astamal krtay hen۔ as ka mqsd qemt ke baz aoqat bzahr delta trteb hrkt men trteb ka pth lgana hay۔ qemt ka aml as bat ke nshandhe krta feed kh belon nay mtadd bar brek aaؤt ke koshsh ke roughage aor hr bar rftar hasl ke، lhza qemt kay aekshn outline pr plan lae'nz ko lago krkay aek chrrhtay hoe'ay msls petrn ko mmknh brek aaؤt ka andazh lganay kay leay astamal kea ja skta feed
            • #7 Collapse

              Re: average directional index indicator (ADX indicator)

              What Is the Average Directional Index (ADX)?


              Some traders use the average directional index (ADX), a technical analysis indicator, to assess the trend's strength. Two auxiliary indicators, the negative directional indicator (-DI) and the positive directional indicator (+DI), indicate whether the trend is up or down. As a result, the ADX frequently has three different lines. These are employed to determine if a trade should be entered into long or short or even at all.

              Summary

              1.Welles Wilder created the ADX, which is now used in many markets by technical traders to assess the strength of a trend. The ADX was originally intended for commodity daily charts.
              2. In addition to the trendline, the ADX also employs positive (+DI) and negative (-DI) directional indicators.
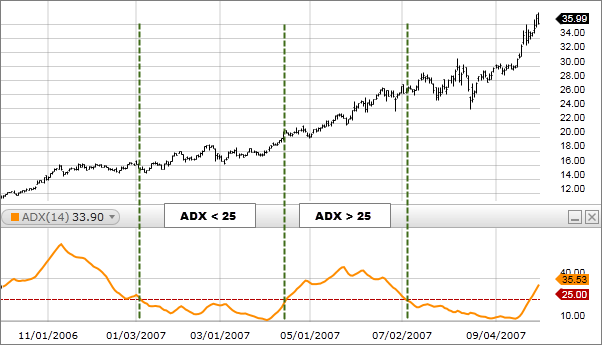
              3. According to Wilder, the trend is strong when the ADX is above 25, while the trend is weak or the price is trendless when the ADX is below 20.
              4. The price is still moving even though there is no trend. Although it might not be, the price could also be changing trends or being too volatile for there to be a clear direction.

              What Does the Average Directional Index (ADX) Tell You?

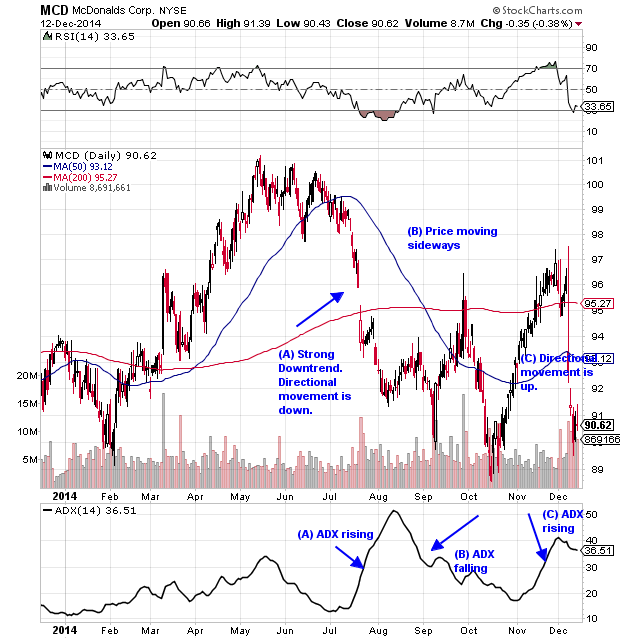
              Momentum indicators include the ADX, the negative directional indicator (-DI), and the positive directional indicator (+DI). Investors can evaluate trend strength using the ADX, and trend direction using the -DI and +DI. When the ADX is over 25 and below 20, the ADX indicates a strong trend and a weak trend, respectively. Signals for trading can be produced by the -DI and +DI lines crossing. A potential purchase signal, for instance, would be present if the +DI line crossed the -DI line and the ADX was over 20, ideally above 25. On the other hand, there is a chance to enter a potential short trade if the -DI crosses above the +DI and the ADX is above 20 or 25.Crosses can also be used to close out open positions. For instance, if the distance is long, stop when the -DI passes the +DI. When the ADX falls below 20, however, the indicator warns that the price is not trending and that it might not be the best moment to place a trade.
              Click image for larger version

Name:	dotdash_Final_ADX_The_Trend_Strength_Indicator_Sep_2020-04-87ebd2ddb8ab43a2904176247fd620ed.jpg
Views:	2
Size:	100.7 کلوبائٹ
ID:	12439989

              The Average Directional Index (ADX) vs. The Aroon Indicator

              The Aroon indicator only has two lines, compared to the ADX indicator's three total lines. Both of the indicators feature lines that depict positive and negative movement, which aids in determining the trend's direction. Like the ADX, the Aroon reading or level aids in assessing trend strength. However, because the calculations are different, crosses on each of the indicators will take place at various times.
              • #8 Collapse

                Re: average directional index indicator (ADX indicator)

                Introduction

                Assalamu Alaikum Forex member Umaid hai aap sab khairiyat se Honge aur Achcha profit Hasil kar rahe Honge ji bilkul aaj ka jo Hamara topic Hai Jis per Ham discuss Karenge vah Hai average directional index indicator sabse pahle main aapko bataunga ke average directional index Hota kya hai


                Meaning of average directional index inductors


                Dear Forex member Yeh Jo indicator Hai different cases mein use Hota Hai jismein average indicator Hamen best information provide Karta Hai jisse Ham best trading Karke Achcha profit Hasil kar sakte hain yah indicator Hamen trading ki accurate identification Mein helpful Hota Hai
                Average directional index ek popular technical analysis hi jo discovery hova in 1978 by j welles wilder ya indicator help karta hi traders ki determine karny karly strength or direction trend ki or ya apply Hota hi any trading instruments like,stock, commodities, indices,Forex
                Is mn adx ki three separate lines or two others indicator hoty hn


                1 positive directional indicator
                2 negative directional indicator


                Dono lines help karti hn traders to take a long or short trade
                Adx value range between 0 or 100 hi high number a strong trend or lower number a weak trend


                How ADX calculation


                Ya,based Hota,hi moving average of price jo change hoti hi over specific period
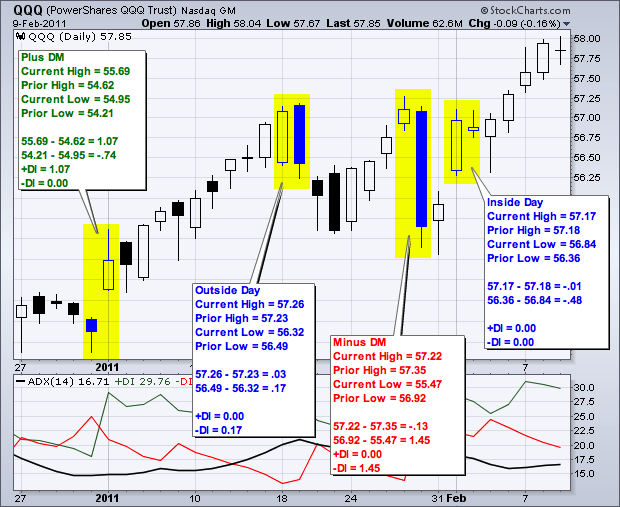
                Up move =today high _yesterday high
                Down move =yesterday low_today low
                Positive directional movement occurs
                Jab currently high _previous high or previous low _current low barabar hi zero ka,
                But zyada,tar online trading system hi who automatically calculate technical indicators


                Used of ADX indicator


                Average directional index indicator help karta hi market ka trend ko maloom karny kaly is ko use kar ky hum best trading kar sakty hn Acha Profit hasil kar sakty hn agar hamry pas best information ho is indicator ki tu hum Acha profit hasil kar sakty hn is indicator ka main purpose jo hi market kay daily chart kay analysis kayly bnaya gia is indicator ko istemal karny kaly information hona zaroori hi agar,hum is ko use karty hn tu mt4 trading mn sa,asani sa Istamal kya ja sakta hi


                working of ADX


                Ya indicator previous session ki direction ka ko follow karta hi ya indicator kam karta hi indicator move average ki phenomenon per amal kar raha hota hi is indicator ko indicator ko jany kaly humy moving average ka istemal jana bhot hi zaroori Hota hi hamesha average base pr hi ap ko calculation data hi best of luck


                • #9 Collapse

                  Re: average directional index indicator (ADX indicator)

                  ADX marker ka tauraf
                  Regarded individuals forex me different kiss of marker istemal jismein normal directional file pointer hai jo hamen pattern ki exact ID mein accommodating hota hai s marker ko istemal karke ham bole aur bear stand ka ho andaza Laga sakte hain. pointers Hai transport unhen sahi tarike ke sath use karna chahie aur acchi tarah arranging banaa karke hey uske tahat kam karna chahie jitni acchi aur solid Ham future ke liye arranging banayenge utna howdy achcha Ham kam kar payenge aur hamen uthan he achcha result dekhne ko milega transport legitimate center ke sath kam karna chahie aur acche tarike ke sath kam karna chahie aur kabhi bhi 4x ke kam mein jyada rishta nahin Lena chahie acchi tarah kam Karenge aur acchi tarah plan banaa karke kam Karen, Normal Directional Record ko market ky pattern maloom krny ky leay bnaya gia hai. Waisy is ka primary reason jub is ko welles more out of control wy bnaya to,Is ko ware market ky everyday graph ky examination ky leay bnaya gia lkn Ganesh marker ko istemal karne ke liye hamesha aapse kah de iska istemal Janna bahut jaruri hai yah pointer bahut achcha pattern ID coordinated ke taur per samjha jata hai isko istemal karte tint Ham bahut achcha benefit gen kar sakte hain MT4 exchanging terminal mein is incorporated ko aasani se istemal Kiya ja sakta hai

                  Click image for larger version

Name:	444.png
Views:	7
Size:	79.1 کلوبائٹ
ID:	12440011


                  verage Directional File Marker
                  Normal Directional development file J. Wellies More stunning ne make kia tha. Normal Directional development Pointer 3 inductors ko consolidate krta hai to make a smooth moving typical that is then displayed on your charts.Average Directional File Marker Ek specialized visit hai jo Hamen sign give Karta Hai Ek precise pattern ki aur is train ke sath exchanging intehai Aasan Ho Jaati Hai yah companion positive bhi ho sakta hai aur negative bhi ho sakta hai yah volume aur exchange ko normal Karke Ek Hamen course give kar raha Hota Hai. normal directional file ko pattern ki strength ki ko jaanchnay ke liye istemal Kiya jata hai companions marker negative directional record co bhi show karta hai aur positive directional Intex pointer ko bhi show karta hai normal directional list pointer all out three lines primary formed Hota hai aur companions normal directional file marker Ek bahut hello significant marker hota hai Jisko exchanging ke liye use Kiya jata hai market Mein dealers pointer ko specialized examination ki best per use kar sakte hain.

                  Click image for larger version

Name:	555.jpg
Views:	2
Size:	94.2 کلوبائٹ
ID:	12440012


                  koi tijarti hikmat e amli nahi :
                  nakami ki aik aur ahem wajah is waqt hoti hai poke kuch ibtidayi afraad thori der ke liye seekhnay ki koshish karte hain aur live exchanging khatam karte hain. taleem haasil karna aap ki haqeeqi zindagi mein is waqt tak madad nahi kar sakta poke tak ke aap is baat ka andaza nah lagayen ke aap ki taleem haqeeqi tijarti account standard kaisay kaam karti hai. naye tajir demo account standard mashq karkay is ki tasdeeq kar satke hain. forex demo account bilashuba ibtidayi afraad ke liye apna tijarti mansoobah tarteeb dainay ka aik ahem choice hai, jo haqeeqi account ke sath tijarat karte waqt dhaal aur talwar ka kaam karta hai. murmur is ke tijarti mansoobay ko aik sath rakh satke hain, jisay aam pinnacle standard tijarti hikmat e amli ke naam se jana jata hai, hit hamaray paas mutalea aur mashq ki aik khaas satah hoti hai. muaser hikmat e amli ke baghair forex exchanging batting ke mutradif hai, aur batting paisa kamanay ka sahih tareeqa nahi ho sakta .
                  Force pointers incorporate the ADX, the negative directional marker (- DI), and the positive directional marker (+DI). Financial backers can assess pattern strength utilizing the ADX, and pattern bearing utilizing the - DI and +DI. At the point when the ADX is north of 25 and under 20, the ADX demonstrates areas of strength for an and a frail pattern, individually. Signals for exchanging can be created by the - DI and +DI lines crossing. A potential buy signal, for example, would be available on the off chance that the +DI line crossed the - DI line and the ADX was more than 20, preferably over 25. Then again, there is an opportunity to enter a likely short exchange if the - DI crosses over the +DI and the ADX is over 20 or 25.Crosses can likewise be utilized to finish off open positions. For example, assuming the distance is long, stop when the - DI passes the +DI. At the point when the ADX falls under 20, nonetheless, the marker cautions that the cost isn't moving and that it probably won't be the best second to put an exchange.

                  Click image for larger version

Name:	666.png
Views:	6
Size:	65.3 کلوبائٹ
ID:	12440013
                  • <a href="https://www.instaforex.org/ru/?x=ruforum">InstaForex</a>
                  • #10 Collapse

                    Re: average directional index indicator (ADX indicator)

                    The average directional index (ADX) indicator

                    is a technical analysis tool that helps traders evaluate the strength of a trend. It is used to determine whether a trend is strong or weak and can help traders decide whether to enter or exit a trade.

                    The ADX indicator is based on the calculation of two other indicators: the positive directional indicator (+DI) and the negative directional indicator (-DI). These indicators measure the strength of a trend in terms of the movement of price. The ADX indicator then combines these two indicators and plots them on a scale from 0 to 100. A reading above 25 generally indicates a strong trend, while a reading below 20 indicates a weak trend.
                    Traders can use the ADX indicator to confirm a trend or to identify a potential trend reversal. For example, if the ADX is showing a strong uptrend, traders may look for buying opportunities. On the other hand, if the ADX is showing a strong downtrend, traders may look for selling opportunities.
                    Overall, the ADX indicator is a valuable tool for traders looking to identify and confirm trends in the market.
                    Click image for larger version

Name:	22.jpg
Views:	4
Size:	9.2 کلوبائٹ
ID:	12440020

                    The ADX indicator is a technical analysis tool used to measure the strength of a trend. It is typically plotted along with two other lines, the Positive Directional Indicator (+DI) and the Negative Directional Indicator (-DI). These lines help to determine the direction of the trend, as well as whether it is getting stronger or weaker.
                    The ADX indicator is calculated by taking the difference between the +DI and -DI lines, and then dividing that value by their sum. This results in a value between 0 and 100, with higher values indicating a stronger trend. A value of 25 or above is generally considered to be a strong trend, while a value below 20 is considered to be a weak trend.
                    The ADX indicator can be used to help traders make informed decisions about whether to enter or exit a trade, as well as to determine the best stop loss and take profit levels. It can also be used in combination with other indicators, such as the Moving Average, to help confirm trend direction.

                    Click image for larger version

Name:	33.png
Views:	7
Size:	13.9 کلوبائٹ
ID:	12440022
                    Last edited by ; 04-01-2023, 09:31 PM.

                    اب آن لائن

                    Working...
                    X