Aslam u alaikum,
Dear forex member umeed karta hun aap sab khairiyat se honge dear members Bullish meeting lines candlestick pattern main two candles involve hoti hain, jin main sa aik bearish aur dusri bullish hoti hay, ye dono candles apnay close points par aik dusray sa meet karti hain matlab aik candle ka closing point dusri kay closing point kay similar hota hay,
Formation of Bullish meeting lines pattern:
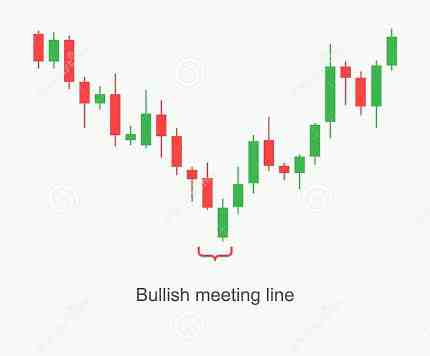
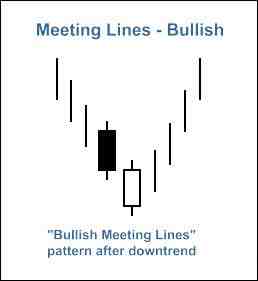
is pattern main two candles hoti hain, jis ka matlab ye nhi kay isay easily spot kar lia jay, iskay liay hmain kuch conditions confirm karni hoti hain, jin main pehli condition ye hoti hay kay market clear downtrend main move kar rahi ho, pehli candle long bearish hoti hay us kay baad long bullish candle appear hoti hay jis ki closing price first candle ki price kay same hoti hay, ye pattern innect, on neck, thrusting pattern aur bullish piercing pattern kay kafi similar hota hay,
Interpretation of meeting lines pattern:
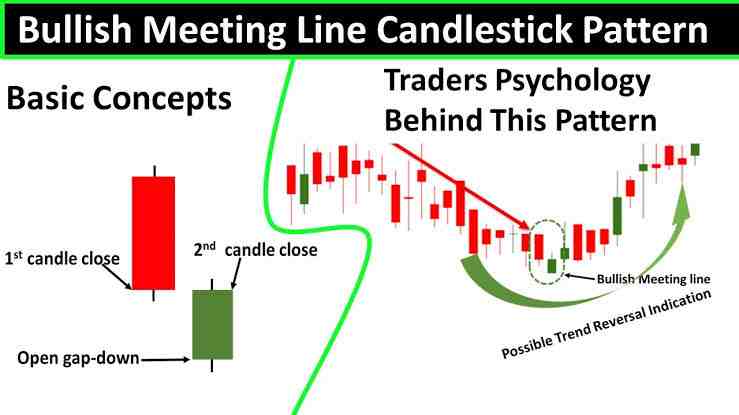
Bullish meeting lines pattern main pairs ki prices downtrend sa reverse honay ko indicate karta hay, perticular pair aik cheap situation sa expensive situation main move krta hay, pattern main pehli candle prices kay panic ki waja sa low close karti hay jab kay second candle low par open ho kay buyers sentiments ko show to karti hay lakin in main itni power nhi hoti kay prices ko previous candle ki high ya open tak reverse kar sakain, lihaza ye previous candles kay low tak hi mehdood rehti hain,
Trading tactics:
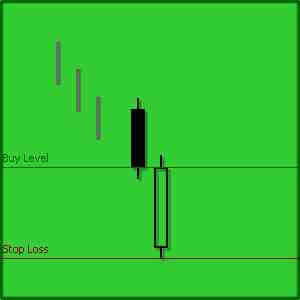
is pattern ki occurence bulls aur bears kay darmian settlement ko show karti hay, bearish candle ki appearence market main downtrend ko zahir karti hay jab kay bullish candleis moment ko counter karti hay aur prices ko dobara up push karti hay, is main stoploss ko last low level par set karna chaiay aur last candle kay above buy level consider kia jata hay
Dear forex member umeed karta hun aap sab khairiyat se honge dear members Bullish meeting lines candlestick pattern main two candles involve hoti hain, jin main sa aik bearish aur dusri bullish hoti hay, ye dono candles apnay close points par aik dusray sa meet karti hain matlab aik candle ka closing point dusri kay closing point kay similar hota hay,
Formation of Bullish meeting lines pattern:
is pattern main two candles hoti hain, jis ka matlab ye nhi kay isay easily spot kar lia jay, iskay liay hmain kuch conditions confirm karni hoti hain, jin main pehli condition ye hoti hay kay market clear downtrend main move kar rahi ho, pehli candle long bearish hoti hay us kay baad long bullish candle appear hoti hay jis ki closing price first candle ki price kay same hoti hay, ye pattern innect, on neck, thrusting pattern aur bullish piercing pattern kay kafi similar hota hay,
Interpretation of meeting lines pattern:
Bullish meeting lines pattern main pairs ki prices downtrend sa reverse honay ko indicate karta hay, perticular pair aik cheap situation sa expensive situation main move krta hay, pattern main pehli candle prices kay panic ki waja sa low close karti hay jab kay second candle low par open ho kay buyers sentiments ko show to karti hay lakin in main itni power nhi hoti kay prices ko previous candle ki high ya open tak reverse kar sakain, lihaza ye previous candles kay low tak hi mehdood rehti hain,
Trading tactics:
is pattern ki occurence bulls aur bears kay darmian settlement ko show karti hay, bearish candle ki appearence market main downtrend ko zahir karti hay jab kay bullish candleis moment ko counter karti hay aur prices ko dobara up push karti hay, is main stoploss ko last low level par set karna chaiay aur last candle kay above buy level consider kia jata hay
تبصرہ
Расширенный режим Обычный режим