Double Bottom Chart Pattern:

No announcement yet.
`
X
  • وقت
  • دکھائیں
Clear All
new posts
  • #1 Collapse

    Double Bottom Chart Pattern:
    INTRODUCTION:

    Double bottom chart pattern ak important technical analysis patterns traders k through use hote hai.double bottom W shape hoti hai.aur indicates bearish reversal trend ki nishandahi karta hai. Double bottom chart pattern ak Bullish Reversal Pattern hai jab yeh apny support point ko tor deta hain to Double Bottom ka confirm signal samjha jata hai. Tab ham apni trding ky liye isi point par aik achi entry laga sakty hain. Jo keh hamary order ko profit deti hai. double top bottom bearish reversal trend ka signal ke indication dyta hai. Double top bottom down trend ko badal dayta hai ky resistance level par gap ke tasdeq karny ke bejay double top 2 high points kay darmean key supports lows par hota hai.

    Click image for larger version

Name:	double-bottom-pattern_body_doublebottom.png
Views:	13
Size:	16.0 کلوبائٹ
ID:	12564968


    Double bottom chart pattern ki importance:


    Double bottom chart pattern bahut jyada popular hai trader mai yeh indicate karta hai jis sy yeh kafi maqbool hai humy apni trading mai use karna chahie. Double bottom chart pattern ke two different kism hoti hai ak jaise ho aur alag hokar niche ki taraf signal deta ho aur second bottom ke between fasla ek jaisa hona chahie residence prices level ka confirm pata hona chahie double bottom bullish ke support ke liye dusre technical indicator ka use karna chahie jaise ki moving average aur usi later hai strong trend ke against trading nahe karni chawey.

    Click image for larger version

Name:	6e9b08aae1812e8b8278a42864b15419.png
Views:	25
Size:	23.7 کلوبائٹ
ID:	12564969


    Double Bottom Chart Pattern:


    Forex trading mai ak full benefit hasil ho sagta hai agar learning nahe hai tu kamyabi bhe nahe hai agar kamyabi hasil karna hai tu apni learning ko strong kare double bottom pattern mai hard work karna hoga jaab tak forex mai koi best learning nhe hoti hai tu kamyabi nahe hoti hai double bottom pattern mai candle ko bhe check karna hota hai demand and supply ko b check karna must hai.


    Click image for larger version

Name:	Double_tops_and_bottoms_body_Picture_2.png
Views:	3
Size:	81.5 کلوبائٹ
ID:	12564970
  • <a href="https://www.instaforex.org/ru/?x=ruforum">InstaForex</a>
  • #2 Collapse

    Re: Double Bottom Chart Pattern:

    Double Bottom Chart Pattern:

    Forex trading main market ki movement ko understand karnay kay liay chart ka bohat ziada kirdar hay jin main say buniadi tor par three types kay chart patterns use hotay hain jin main say aik bar chart, dosra line chart and tesra candlestick chart patterns qabil e zikar hain candlestick chart pattern ki types main say aik type double bottom chart pattern ki hay mara ap sab say sawal hay k double bottom chart pattern kisay kehtay hai.


    Click image for larger version

Name:	images.png
Views:	1
Size:	7.9 کلوبائٹ
ID:	12428766

    Explanation:

    Double bottom chart pattern mai hamen different term and conditions dekhte hue market mai trading avail krni chahie double bottom pattern double top pattern M aur W pattern bhi hoty hai.market mai trade karni ho to hum ko ais mai ye dekhna hai k market ne agar aik low point lagya hai aor aus k baad hi hum ko ais market mai dekhna hai k agar market yehi same low point lagati hai to hum ko ais mai ye pattern confirm ho jata hai aus k baad market aik new high point lagati hai ais market mai jab ap chart pattern par dekhy to ap ko ais market mai ain pattern par trade karni chaye kun k ain mai stop loss bahot kam hota hai magar ain patten par take profit kafi zayda hota hai.

    Click image for larger version

Name:	Double-bottom-pattern_Q640.jpg
Views:	5
Size:	15.2 کلوبائٹ
ID:	12428765


    Strategy In Double Bottom Chart Pattern:


    Double Bottom chart pattern bahot hi simple strategy hai aur market trend line key change hony key signal provide karny ki waja se es ko trend reversal chart pattern be kehty hai.agar market ka trend bullish trend ho aur koch time bad market down ajaye magar pehli waly price se down na jaye es ko ham double bottom kehty hai.
    Click image for larger version

Name:	maxresdefault.jpg
Views:	11
Size:	90.5 کلوبائٹ
ID:	12428767
    • #3 Collapse

      Re: Double Bottom Chart Pattern:

      forex trading main pratice kare forex trading main learning kare forex main best learning kare Double bottom chart pattern main rules ko follow kare agar learning k sath kaam karna must hota hain forex main Double bottom chart pattern main rules ko follow kare agar learning and rules ko follow kare forex trading main pratice kare forex main Double bottom chart pattern main learning ko incress kare l0t of learning karnaDouble bottom chart pattern main rules ko achi tara follow kare agar learning nhe hain tu benefit nhe hain forex main hardwork k sath benefit mil skta hain forex trading ka busniess main Double bottom chart pattern main rules ko follow kare regular pratice kare learning ko incress kare forex main learning nhe hain tu kamyabi b nhe hain agr learning hoti hain tu Double bottom chart pattern main benefit mil skta hain


      Double bottom chart pattern in forex trading market:


      forex trading main Double bottom chart pattern main work karne k liye hard work k sath kaam karna hota hain jsine learning k sath kaam kia Double bottom chart pattern main tu feature main big loss say safe reh sktehain learning karna must hota hain forex main regular pratice karna must hota hain agar learning nhe han tu Double bottom chart pattern main loss ho skta hain forex trading k busniess main achy achy trades Double bottom chart pattern main loss kar dete hain qk k benefit tab he mil jata hain tu forex main regular pratice k sath kaam hota hain Double bottom chart pattern main analysis karna must hota hain bina analysis k big loss mil skta hain kamyabi nhe is liye Double bottom chart pattern main trend ko b achi tara follow kare bina trend k loss hoga
      • #4 Collapse

        Re: Double Bottom Chart Pattern:

        Definition OF Double Bottom Candlestick Pattern:
        A double bottom pattern is a technical analysis charting pattern that characterizes a major change in a market trend, from down to up.
        Double bottom chart pattern main rules ko follow kare agar learning k sath kaam karna must hota hain forex main Double bottom chart pattern main rules ko follow kare agar learning and rules ko follow kare forex trading main pratice kare forex main Double bottom chart pattern main learning ko incress kare l0t of learning karnaDouble bottom chart pattern main rules ko achi tara follow kare agar learning nhe hain tu benefit nhe hain forex main hardwork k sath benefit mil skta hain forex trading ka busniess main Double bottom chart pattern main rules ko follow kare regular pratice kare learning ko incress kare forex main learning nhe hain
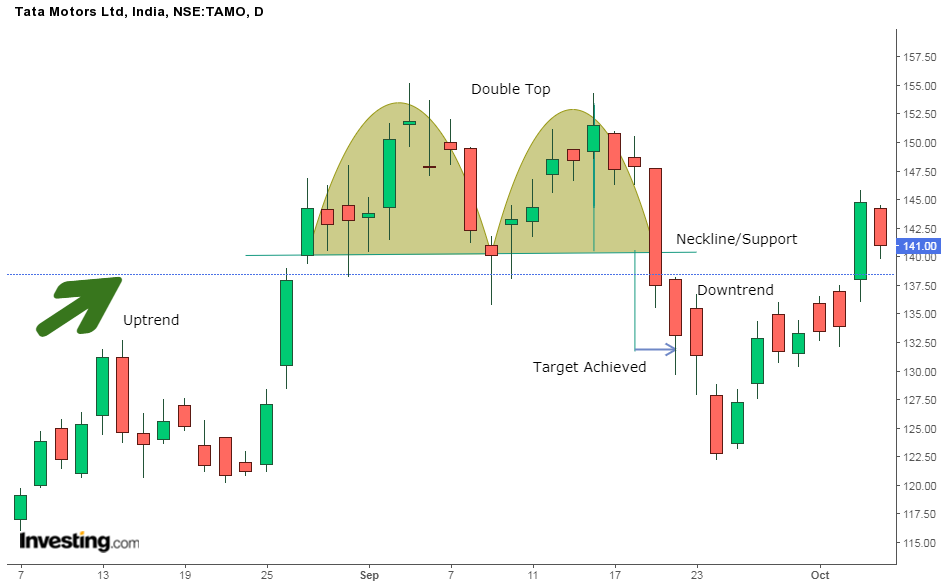
        Double bottom patterns are essentially the opposite of double top patterns. Results from this pattern have the opposite inferences. A double bottom is formed following a single rounding bottom pattern which can also be the first sign of a potential reversal. Rounding bottom patterns will typically occur at the end of an extended bearish trend. The double bottom formation constructed from two consecutive rounding bottoms can also infer that investors are following the security to capitalize on its last push lower toward a support level. A double bottom will typically indicate a bullish reversal which provides an opportunity for investors to obtain profits from a bullish rally. After a double bottom, common trading strategies include long positions that will profit from a rising security price.

        For instance, there is a significant difference between a double top and one that has failed. A real double top is an extremely bearish technical pattern which can lead to an extremely sharp decline in a stock or asset. However, it is essential to be patient and identify the critical support level to confirm a double top's identity. Basing a double top solely on the formation of two consecutive peaks could lead to a false reading and cause an early exit from a position.

        Conclusion

        • The Double Bottom signals the downtrend has possibly bottomed out and the price could possibly move higher
        • Don’t buy a Double Bottom in a strong downtrend (when the price is below 20MA)
        • You can use the False Break technique to profit from “trapped” traders
        • If you want to trade the Double Bottom Breakout, wait for a buildup to form at the neckline so you have a favorable risk to reward
        • You can use multiple timeframes to improve the accuracy of your reversal trades.

        The Double Bottom Pattern Trading Strategy Guide

        You’ve probably seen headlines like these…
        “Dow plunges 1000 points, erases gain for 2018!”
        “Oil heads for seventh weekly loss on signs of global supply glut”
        “Bitcoin crashes, now what?”
        And you think to yourself…
        Is this a good time to buy?
        Well, not so fast.
        Because the last thing you want is to catch a falling knife.
        Instead, a better approach is to identify the Double Bottom pattern so you can pinpoint market reversals with deadly accuracy.
        How does work In Double Candlstick Pattern:
        To be able to learn how to trade double bottom pattern, you must first know what it is and how it works in detail.
        Now, a Double Bottom Pattern is a bullish trend reversal pattern (and we call the opposite a Double Top).
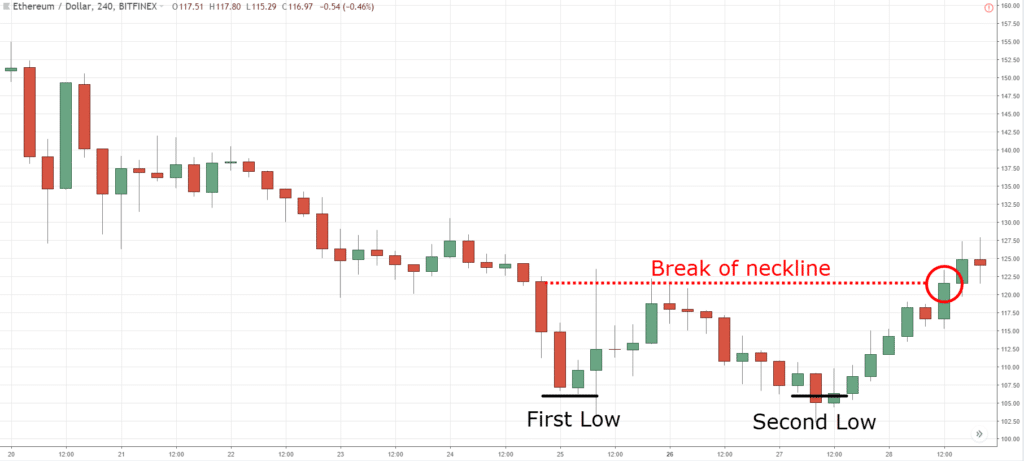
        It has three parts to it:
        1. First low – first price rejection
        2. Second low – second price rejection
        3. Neckline – an area of resistance

        Now you’re probably wondering:
        “What does a Double Bottom pattern indicate?”
        I’ll explain…
        First low – The market bounces higher and forms a swing low. At this point, it’s likely a retracement in a downtrend.
        Second low – The market rejects the previous swing low. Now, there’s buying pressure, but it’s too early to tell if the market could continue higher.
        Break of neckline – The price broke above the Neckline (or Resistance) and it signals the buyers are in control — the market is likely to move higher (this is also where you look for trading opportunities when it comes to double bottom trading)
        Here’s what it looks like:


        Seems easy, right?
        But before you trade the Double Bottom pattern, you want to avoid this common trading mistake…
        Thank You
        • #5 Collapse

          Re: Double Bottom Chart Pattern:

          Double Bottom Chart Pattern

          Dear forex members Forex Market mein double bottom tab hi banta hey jab price uper se nichey ki taraf move karne ke mood mein ajati hey aur is trha se aik double Bottom nichey se bhi banta hey jisko hum Reversal Double Bottom kehtey hein aur reversal double bottom us waqat banta hey jab price nichey se uper ki taraf mood mein ajati hey isliye hamen chahiye keh isko always find kartey rahen kioun keh yeh jab bhi market mein banti hey to market mein hamen aik achi trade dekhne ko mil jati hey aur hum market mein aik achi trade karne ke qabil ban saktey hein yeh ham daily basis par H1 ke chart par bhi find kr saktey hein aur uske ilawa agar hum H4 ka chart dekhen to us mein hamen weekly dekhne ko milti hey aur yeh kafi acha aur profitable pattern he isko hamen kabhi bhi miss nahin karna chahiye.

          Click image for larger version

Name:	download (10).png
Views:	1
Size:	5.2 کلوبائٹ
ID:	12428810

          Double Bottom Chart Pattern in details

          Dear friends Chart me double bottom key 2 hi bannty hey jes ko understand karna zarori hay, double top bottom ka indication ye hota hay key market ki M ki shakal me movement kar leti hay aur resistance level 2 times try karny key bawajood be break nahi hota aur market 1st top level ko break karny me nakam ho jaye to es ko double top pattern kaha jata hay aur jab market support level ko 2 times break na kary aur W ki shakal me movement karny key bad per se market up side me move kary to ye double bottom samja jata hay, M aur W shape me market ki movement ko double top aur bottom movement samjy jaty hey jo key technical analysis key ley bahot hi powerful tasawar key jaty hey, large time frame me agar market long period key bad M aur W shape banaye to ye yakeen key sath technical point of view se double top aur bottom pattern hi hota hay jes ko follow karna technical analysis par yakeen karny waly traders zarori samjty hey, simple words me double bottom levels strong bearish trend ka indication hota hay aur double top pattern M shape ka hota hay jo key strong bullish trend ki taraf eshara karta hay hamy es ko zaror follow karny ki kohsish karni chaye, market ka news se be zaror jaiza leya karen magar sath me double top aur bottom levels ko be follow karny ki koshish karni chaye ye bahot hi powerful technical signals hoty hey jo acha profit de sakty hey.

          Click image for larger version

Name:	download (12).png
Views:	14
Size:	7.8 کلوبائٹ
ID:	12428812

          Double Bottom Chart Pattern kitni tarha ke hoty hain

          Dear friends Market ki movement ki waja sy bht sy frapha ya pattern banty hain unhi graph ya patter ko dekh k hi hamain apni trading krrni parti hia. hamain isko samjhna njy zaroori hia and isy samjh k hi ham isi apply kerty hian/ forex market me double button tab banta hai jab market kisi support ki waja sy bna jati hia jis ko ham double button kehty hian.
          double button do tarha k hoty hian
          1- Top double button.
          2- Down double button.

          Click image for larger version

Name:	download (11).png
Views:	34
Size:	4.3 کلوبائٹ
ID:	12428811
          • #6 Collapse

            Re: Double Bottom Chart Pattern:

            Double Bottom Chart Pattern;


            DAER Double bottom chart pattern bahut market mai dekhna hai k agar market yehi same low point lagati hai to hum ko ais mai ye pattern confirm ho jata hai aus k baad market aik new high point lagati hai ais market mai jab ap chart pattern par dekhy to ap ko ais market mai ain pattern par trade karni chaye kun k ain mai stop loss bahot kam hota hai magar ain patten par take profit kafi zayda hota hai.Double Bottom chart pattern bahot hi simple strategy hai aur market trend line key change hony key jyada prices level ka confirm pata hona chahie double bottom bullish ke support ke liye dusre technical indicator ka use karna chahie jaise ki moving average aur usi later hai strong trend ke against trading nahe karni chawey.


            Tripple Bottom Chart Pattern;

            DAERFriends Forex trading mai ak full benefit hasilpopular hai trader mai yeh indicate karta hai jis sy yeh kafi maqbool hai humy apni trading mai use karna chahie. Double bottom chart pattern ke two different kism hoti hai ak jaise ho aur alag hokar niche ki taraf signal deta ho aur second bottom ke between fasla ek jaisa hona kirdar hay jin main say buniadi tor par three types kay chart patterns use hotay hain jin main say aik bar chart, dosra line chart and tesra candlestick chart patterns qabil e zikar hain candlestick chart pattern ki types main say aik type double bottom chart pattern ki hay mara ap sab say sawal hay k double bottom chart pattern kisay kehtay hai.


            Both Pattern Analysis;

            Yes Double bottom chart pattern mai hame jaab tak forex mai koi best learning nhe hoti hai tu kamyabi nahe hoti hai double bottom pattern mai candle ko bhe check karna hota hai demand and supply ko b check karna must n different term and conditions dekhte hue market mai trading avail krni chahie double bottom pattern double top pattern M aur W pattern bhi hoty hai.market mai trade karni ho to hum ko ais mai ye dekhna hai k market ne agar aik low point lagya hai aor aus k baad hi hum ko aissignal provide karny ki waja se es ko trend reversal chart pattern be kehty hai.agar market ka trend bullish trend ho aur koch time bad market down ajaye magar pehli waly price se down na jaye es ko ham double bottom kehty hai.


            AK
            • #7 Collapse

              Re: Double Bottom Chart Pattern:

              Double Bottom Chart Pattern:
              forex trading main learning kare forex main best learning kare Double bottom chart pattern main rules ko follow kare agar learning k sath kaam karna must hota hain forex main Double bottom chart pattern main rules ko follow kare agar learning and rules ko follow kare forex trading main pratice kare forex main Double bottom chart pattern main learning ko incress kare l0t of learning karnaDouble bottom chart pattern main rules ko achi tara follow kare agar learning nhe hain tu benefit nhe hain forex main hardwork k sath benefit mil skta hain forex trading ka busniess main Double bottom chart pattern main rules ko follow kare Market mein double bottom tab hi banta hey jab price uper se nichey ki taraf move karne ke mood mein ajati hey aur is trha se aik double Bottom nichey se bhi banta hey jisko hum Reversal Double Bottom kehtey hein aur reversal double bottom us waqat banta hey jab price nichey se uper ki taraf mood mein ajati hey isliye hamen chahiye keh isko always find kartey rahen kioun keh yeh jab bhi market mein banti hey to market mein hamen aik achi trade dekhne ko mil jati hey aur hum market mein aik achi trade karne ke qabil ban saktey hein yeh ham daily basis par H1 ke chart par bhi find kr saktey hein aur uske ilawa agar hum H4 ka chart dekhen to us mein hamen weekly dekhne ko milti hey market mai dekhna hai k agar market yehi same low point lagati hai to hum ko ais mai ye pattern confirm ho jata hai aus k baad market aik new high point lagati hai ais market mai jab ap chart pattern par dekhy to ap ko ais market mai ain pattern par trade karni chaye kun k ain mai stop loss bahot kam hota hai magar ain patten par take profit kafi zayda hota hai.Double Bottom chart pattern bahot hi simple strategy hai aur market trend line key change hony key jyada prices level ka confirm pata hona chahie double bottom bullish ke support ke liye dusre technical indicator ka use karna chahie Double bottom chart pattern mai hame jaab tak forex mai koi best learning nhe hoti hai tu kamyabi nahe hoti hai double bottom pattern mai candle ko bhe check karna hota hai demand and supply ko b check karna must n different term and conditions dekhte hue market mai trading avail krni chahie double bottom pattern double top pattern M aur W pattern bhi hoty hai.market mai trade karni ho to hum ko ais mai ye dekhna hai k market ne agar aik low point lagya hai aor aus k baad hi hum ko aissignal provide karny ki waja se es ko trend reversal chart pattern be kehty hai.agar market ka trend bullish trend ho aur koch time bad market down ajaye magar pehli waly price se down na jaye es ko ham double bottom kehty hai.Forex trading mai ak full benefit hasilpopular hai trader mai yeh indicate karta hai jis sy yeh kafi maqbool hai humy apni trading mai use karna chahie. Double bottom chart pattern ke two different kism hoti hai ak jaise ho aur alag hokar niche ki taraf signal deta ho aur second bottom ke between fasla ek jaisa hona kirdar hay jin main say buniadi tor par three types kay chart patterns use hotay hain jin main say aik bar chart, dosra line chart and tesra candlestick chart patterns qabil e zikar hain candlestick chart pattern ki types main say aik type double bottom chart pattern ki hay mara ap sab say sawal hay k double bottom chart pattern kisay kehtay hai.Chart me double bottom key 2 hi bannty hey jes ko understand karna zarori hay, double top bottom ka indication ye hota hay key market ki M ki shakal me movement kar leti hay aur resistance level 2 times try karny key bawajood be break nahi hota aur market 1st top level ko break karny me nakam ho jaye to es ko double top pattern kaha jata hay aur jab market support level ko 2 times break na kary aur W ki shakal me movement karny key bad per se market up side me move kary to ye double bottom samja jata hay, M aur W shape me market ki movement ko double top aur bottom movement samjy jaty hey jo key technical analysis key ley bahot hi powerful tasawar key jaty hey, large time frame me agar market long period key bad M aur W shape banaye to ye yakeen key sath technical point of view se double top aur bottom pattern hi hota hay jes ko follow karna technical analysis par yakeen karny waly traders zarori samjty hey, simple words me double bottom levels strong bearish trend ka indication hota hay aur double top pattern M shape ka hota hay jo key strong bullish trend ki taraf eshara karta hay hamy es ko zaror follow karny ki kohsish karni chaye, market ka news se be zaror jaiza leya karen magar sath me double top aur bottom levels ko be follow karny ki koshish karni chaye.

              Explanation:
              Double bottom chart pattern bahut jyada popular hai trader mai yeh indicate karta hai jis sy yeh kafi maqbool hai humy apni trading mai use karna chahie. Double bottom chart pattern ke two different kism hoti hai ak jaise ho aur alag hokar niche ki taraf signal deta ho aur second bottom ke between fasla ek jaisa hona chahie residence prices level ka confirm pata hona chahie double bottom bullish ke support ke liye dusre technical indicator ka use karna chahie jaise ki moving average aur usi later hai strong trend ke against trading nahe karni chawey.different term and conditions dekhte hue market mai trading avail krni chahie double bottom pattern double top pattern M aur W pattern bhi hoty hai.market mai trade karni ho to hum ko ais mai ye dekhna hai k market ne agar aik low point lagya hai aor aus k baad hi hum ko ais market mai dekhna hai k agar market yehi same low point lagati hai to hum ko ais mai ye pattern confirm ho jata hai aus k baad market aik new high point lagati hai ais market mai jab ap chart pattern par dekhy to ap ko ais market mai ain pattern par trade karni chaye kun k ain mai stop loss bahot kam hota hai magar ain patten par take profit kafi zayda hota ha chart pattern bahot hi simple strategy hai aur market trend line key change hony key signal provide karny ki waja se es ko trend reversal chart pattern be kehty hai.agar market ka trend bullish trend ho aur koch time bad market down ajaye magar pehli waly price se down na jaye es ko ham double bottom kehty hai.chart pattern main work karne k liye hard work k sath kaam karna hota hain jsine learning k sath kaam kia Double bottom chart pattern main tu feature main big loss say safe reh sktehain learning karna must hota hain forex main regular pratice karna must hota hain agar learning nhe han tu Double bottom chart pattern main loss ho skta hain forex trading k busniess main achy achy trades Double bottom chart pattern main loss kar dete hain qk k benefit tab he mil jata hain tu forex main regular pratice k sath kaam hota hain Double bottom chart pattern main analysis karna must hota hain bina analysis k big loss mil skta hain kamyabi nhe is liye Double bottom chart pattern main trend ko b achi tara follow kare bina trend k loss hoga yeh indicate karta hai jis sy yeh kafi maqbool hai humy apni trading mai use karna chahie. Double bottom chart pattern ke two different kism hoti hai ak jaise ho aur alag hokar niche ki taraf signal deta ho aur second bottom ke between fasla ek jaisa hona kirdar hay jin main say buniadi tor par three types kay chart patterns use hotay hain jin main say aik bar chart, dosra line chart and tesra candlestick chart patterns qabil e zikar hain candlestick chart pattern ki types main say aik type double bottom chart pattern ki hay mara ap sab say sawal hay k double bottom chart pattern kisay kehtay hai.Market ki movement ki waja sy bht sy frapha ya pattern banty hain unhi graph ya patter ko dekh k hi hamain apni trading krrni parti hia. hamain isko samjhna njy zaroori hia and isy samjh k hi ham isi apply kerty hian/ forex market me double button tab banta hai jab market kisi support ki waja sy bna jati hia jis ko ham double button kehty hian.
              double button do tarha k hoty hian
              1- Top double button.
              2- Down double button.
              To be able to learn how to trade double bottom pattern, you must first know what it is and how it works in detail.
              Now, a Double Bottom Pattern is a bullish trend reversal pattern (and we call the opposite a Double Top).
              It has three parts to it:

              1. First low – first price rejection
              2. Second low – second price rejection
              3. Neckline – an area of resistance


              Now you’re probably wondering:
              “What does a Double Bottom pattern indicate?”
              I’ll explain…
              First low – The market bounces higher and forms a swing low. At this point, it’s likely a retracement in a downtrend.
              Second low – The market rejects the previous swing low. Now, there’s buying pressure, but it’s too early to tell if the market could continue higher.
              Break of neckline – The price broke above the Neckline (or Resistance) and it signals the buyers are in control — the market is likely to move higher (this is also where you look for trading opportunities when it comes to double bottom trading)
              You’ve probably seen headlines like these…
              “Dow plunges 1000 points, erases gain for 2018!”
              “Oil heads for seventh weekly loss on signs of global supply glut”
              “Bitcoin crashes, now what?”
              And you think to yourself…
              Is this a good time to buy?
              Well, not so fast.
              Because the last thing you want is to catch a falling knife.
              Instead, a better approach is to identify the Double Bottom pattern so you can pinpoint market reversals with deadly accuracy.
              The Double Bottom signals the downtrend has possibly bottomed out and the price could possibly move higher
              Don’t buy a Double Bottom in a strong downtrend (when the price is below 20MA)
              You can use the False Break technique to profit from “trapped” traders
              If you want to trade the Double Bottom Breakout, wait for a buildup to form at the neckline so you have a favorable risk to reward
              You can use multiple timeframes to improve the accuracy of your reversal trades.
              technical analysis charting pattern that characterizes a major change in a market trend, from down to up.
              Double bottom chart pattern main rules ko follow kare agar learning k sath kaam karna must hota hain forex main Double bottom chart pattern main rules ko follow kare agar learning and rules ko follow kare forex trading main pratice kare forex main Double bottom chart pattern main learning ko incress kare l0t of learning karnaDouble bottom chart pattern main rules ko achi tara follow kare agar learning nhe hain tu benefit nhe hain forex main hardwork k sath benefit mil skta hain forex trading ka busniess main Double bottom chart pattern main rules ko follow kare regular pratice kare learning ko incress kare forex main learning nhe hain
              Double bottom patterns are essentially the opposite of double top patterns. Results from this pattern have the opposite inferences. A double bottom is formed following a single rounding bottom pattern which can also be the first sign of a potential reversal. Rounding bottom patterns will typically occur at the end of an extended bearish trend. The double bottom formation constructed from two consecutive rounding bottoms can also infer that investors are following the security to capitalize on its last push lower toward a support level. A double bottom will typically indicate a bullish reversal which provides an opportunity for investors to obtain profits from a bullish rally. After a double bottom, common trading strategies include long positions that will profit from a rising security price.
              • #8 Collapse

                Re: Double Bottom Chart Pattern:

                اصل پيغام ارسال کردہ از: HasaaaanMalik پيغام ديکھيے
                INTRODUCTION:

                Double bottom chart pattern ak important technical analysis patterns traders k through use hote hai.double bottom W shape hoti hai.aur indicates bearish reversal trend ki nishandahi karta hai. Double bottom chart pattern ak Bullish Reversal Pattern hai jab yeh apny support point ko tor deta hain to Double Bottom ka confirm signal samjha jata hai. Tab ham apni trding ky liye isi point par aik achi entry laga sakty hain. Jo keh hamary order ko profit deti hai. double top bottom bearish reversal trend ka signal ke indication dyta hai. Double top bottom down trend ko badal dayta hai ky resistance level par gap ke tasdeq karny ke bejay double top 2 high points kay darmean key supports lows par hota hai.

                [ATTACH=CONFIG]147658[/ATTACH]


                Double bottom chart pattern ki importance:


                Double bottom chart pattern bahut jyada popular hai trader mai yeh indicate karta hai jis sy yeh kafi maqbool hai humy apni trading mai use karna chahie. Double bottom chart pattern ke two different kism hoti hai ak jaise ho aur alag hokar niche ki taraf signal deta ho aur second bottom ke between fasla ek jaisa hona chahie residence prices level ka confirm pata hona chahie double bottom bullish ke support ke liye dusre technical indicator ka use karna chahie jaise ki moving average aur usi later hai strong trend ke against trading nahe karni chawey.

                [ATTACH=CONFIG]147659[/ATTACH]


                Double Bottom Chart Pattern:


                Forex trading mai ak full benefit hasil ho sagta hai agar learning nahe hai tu kamyabi bhe nahe hai agar kamyabi hasil karna hai tu apni learning ko strong kare double bottom pattern mai hard work karna hoga jaab tak forex mai koi best learning nhe hoti hai tu kamyabi nahe hoti hai double bottom pattern mai candle ko bhe check karna hota hai demand and supply ko b check karna must hai.


                [ATTACH=CONFIG]147660[/ATTACH]
                Double bottom candlestick ek aisa important candle stick hota hai jiski vajah se aapko market mein bottom level ki identification mil sakti hai Jab aap regular basis per bottom level ko find out karna start kar dete hain to bottom level basically sport level ko identiate kar raha hota hai ismein aapko bottom level ki maximum information mil sakti hai aur aapko hamesha market mein regularly basis per kuchh information ko find out karna hota hai bottom level aapke liye most important ho sakta hai.
                • #9 Collapse

                  Re: Double Bottom Chart Pattern:

                  ek kamyab traders and expr ttraders jaaab b forex traidng ki merket main kaaam karta hiantu khud he analysis karta hain kabi lalach nhe kart ahain jaab tak entry na mile tab tak kabi b forex trading main bina entry point k kaam nhe karta hain forex trading main pratice kare forex trading main learning ko strong kare forex trading ka busniess ek kamyab busniess hain forex main pratice kare hard work k sath kaam kare forex main learning nhe hoti hain tu kamyabi b nhe hain learning ko incress kare achi tara pratice kare kamyabi mil skti hain warna big loss ho skta hain
                  • #10 Collapse

                    Re: Double Bottom Chart Pattern:

                    ek kamyab traders and expr ttraders jaaab b forex traidng ki merket main kaaam karta hiantu khud he analysis karta hain kabi lalach nhe kart ahain jaab tak entry na mile tab tak kabi b forex trading main bina entry point k kaam nhe karta hain forex trading ka bunsiess ek kamyab busniess hain forex trading main pratie krna must hota hain agar forex main learning nhe hoti hain tu benefit nhe hain elarning karna must hain hardwork karna must hain agar forex main pratice ki jati hain tu forex trading main elarning ko incress kare forex main hard work kare
                    • #11 Collapse

                      Re: Double Bottom Chart Pattern:

                      Forex replacing foremost inclining karna parta hain foreign exchange replacing primary hardwork kare forex exchanging getting to know karna parta hain foreign exchange changing fundamental studying karna must hain foreign exchange exchanging major hardwork kare foreign exchange changing essential hardwork kare forex exchanging primary gaining knowledge of karna parta hain agar achi getting to know karna ought to hain foreign exchange changing essential hard work kae achi tara mastering karna parta hain foreign exchange changing essential hard work kare pratice kare normal pratice kare foreign exchange changing fundamental pratice kare achi tara kamyabi pana hain tu achi tara pratice kare regular pratice kare achi tara learning karna parta hain agar trendy pratice ki jati hain tu market most important getting to know karna must hain forex replacing primary getting to know karna ought to hain regular pratice karna ought to hain forex changing primary difficult paintings kare foreign exchange changing primary studying kare foreign exchange exchanging fundamental gaining knowledge of karna ought to hain

                      Macd Marker in forex changing marketplace:

                      foreign exchange exchanging primary hardwork kare foreign exchange chan
                      ging primary mastering kare forex exchanging fundamental hardwork kare forex exchanging most important fine gaining knowledge of kare forex ek kamyab busniess hain forex replacing fundamental everyday pratice kare forex exchanging essential hardwork kare foreign exchange exchanging essential pratice kare forex fundamental kamyab hona hain tu pratice kare jaaab tak forex exchanging fundamental pratice kare jaaab tak pratice nhe ki tu kamyabi b nhe hain har tradders ko kamyab hona hain tu forex replacing fundamental studying karna parta foreign exchange ek kamyab busniess hain jsine gaining knowledge of okay sath kaaam kia wahi kamyab merchants boycott skte hain foreign exchange replacing main learning karna parta hain forex ek relied on busniess hain jisne studying ki wahi sellers forex major easy kamyab ho skte haiin mastering karna should hain ordinary pratice karna have to hain hard paintings k sath kaam karna parta hain foreign exchange ek depended on hain jisne studying okay sath kaaaam kia wahi kamyab hain
                      • #12 Collapse

                        Re: Double Bottom Chart Pattern:

                        forex trading main bhot he amaizng learning ki hain forex trading main learning ko incress karna must hota hain forex trading main Flag Chart Candlestick Pattern main rules ko check karna must hota hain bearish trend main rules ko follow kare bullish trend main Flag Chart Candlestick Pattern main rules ko follow kare forex main har pattren main kaam karne k liye Flag Chart Candlestick Pattern main b trend ko check karna hota hain jaab tak trend ko follow nhe kia jata hain tu kamyabi b nhe hain kamyabi k liye forex trading main hard work k sath kaam kare forex trading main trend ko follow kare Flag Chart Candlestick Pattern ek lot of benefit dene wala busneiss hain jaab tak learning nhe hain tu Flag Chart Candlestick Pattern main big loss ho skta hain trend agar buy ka hain tu trend main buy entry ko find kare


                        Flag Chart Candlestick Pattern in forex trading market:


                        forex trading main work karne k liye ek traders ko regular kaam karna hotahain forex trading main best learning karna must hota hain forex main regular learning hoti hain tu kamyabi mil skti hain Flag Chart Candlestick Pattern main hard work kare regular pratice kare forex main Flag Chart Candlestick Pattern in forex trading market Flag Chart Candlestick Pattern main bullish trend main follow karna must hota hain forex main best learning karna must hota hain trend ko find karna must hain jaaab tak trend ko find nhe kia jata hain tu benefit nhe hain is liye trend ko follow kare forex main trend he best benefit deskta hain agar ek trader Flag Chart Candlestick Pattern main kaam karta hain tu us trader ko kaam karne k liye trend ko follow karna must hota hain agar trend ko follow nhe kia jata hain tu big loss ho skta hain big loss he feature main best trades bana skta hain Flag Chart Candlestick Pattern main
                        • #13 Collapse

                          Re: Double Bottom Chart Pattern:

                          forex exchanging primary pratice kare forex exchanging fundamental learning kare forex principal best learning kare Twofold base graph design fundamental guidelines ko observe kare agar learning k sath kaam karna must hota hain forex principal Twofold base diagram design fundamental guidelines ko adhere to kare agar learning and guidelines ko adhere to kare forex exchanging principal pratice kare forex principal Twofold base outline design fundamental learning ko incress kare l0t of learning karnaDouble base outline design principal guidelines ko achi tara adhere to kare agar learning nhe hain tu benefit nhe hain forex fundamental hardwork k sath benefit mil skta hain forex exchanging ka busniess primary Twofold base outline design principal guidelines ko keep kare ordinary pratice kare learning ko incress kare forex principal learning nhe hain tu kamyabi b nhe hain agr learning hoti hain tu Twofold base graph design principal benefit mil skta hain

                          Twofold base outline design in forex exchanging market:


                          forex exchanging primary Twofold base diagram design principal work karne k liye difficult work k sath kaam karna hota hain jsine learning k sath kaam kia Twofold base graph design fundamental tu include fundamental enormous misfortune say safe reh sktehain learning karna must hota hain forex principal customary pratice karna must hota hain agar learning nhe han tu Twofold base outline design primary misfortune ho skta hain forex exchanging k busniess principal pain-filled throbbing exchanges Twofold base diagram design primary misfortune kar dete hain qk k advantage tab he mil jata hain tu forex principal normal pratice k sath kaam hota hain Twofold base diagram design primary examination karna must hota hain bina investigation k large misfortune mil skta hain kamyabi nhe is liye Twofold base diagram design principal pattern ko b achi tara pursue kare bina direction k misfortune hoga
                          • #14 Collapse

                            Re: Double Bottom Chart Pattern:

                            Double Bottom Chart Pattern.

                            Forex Market mein double bottom tab hi banta hey jab price uper se nichey ki taraf move karne ke mood mein ajati hey aur is trha se aik double Bottom nichey se bhi banta hey jisko hum Reversal Double Bottom kehtey hein aur reversal double bottom us waqat banta hey jab price nichey se uper ki taraf mood mein ajati hey isliye hamen chahiye keh isko always find kartey rahen kioun keh yeh jab bhi market mein banti hey to market mein hamen aik achi trade dekhne ko mil jati hey aur hum market mein aik achi trade karne ke qabil ban saktey hein yeh ham daily basis par H1 ke chart par bhi find kr saktey hein aur uske ilawa agar hum H4 ka chart dekhen to us mein hamen weekly dekhne ko milti hey aur yeh kafi acha aur profitable pattern he isko hamen kabhi bhi miss nahin karna chahiye.

                            Click image for larger version

Name:	1111111111111111.png
Views:	15
Size:	7.5 کلوبائٹ
ID:	12431609

                            Types of Double Bottom Chart Pattern.

                            Dear agar aap market ki movement ko carefully observed Karte Hain To ismein yah different pictures banati rehti hai aur ham Agar isko properly samajhna Chahte Hain To iski different ways ko properly learn karna hoga aur iski different pictures ko Samajh Kar Apna benefit Hasil karna hoga. For example job market different ways me movement kar rahi hoti hai to ismein different patterns bante Hain jismein different pictures aapke Samne Aati Hai inmein se kuch important patterns main aapke Samne explain karne ki koshish karta hun.

                            1: Double Bottom pattern
                            2: Head And Shoulders pattern
                            3: Scoop Patterns
                            4: Neckline Pattern
                            5: Bullish Flag Patterns
                            6: Bearish Flag Patterns

                            Click image for larger version

Name:	22222222222222222.jpg
Views:	13
Size:	3.3 کلوبائٹ
ID:	12431610

                            More Information about Double Bottom Chart Pattern.

                            foreign exchange marketplace mein double bottom tab hello banta hello jab charge uper se nichey ki taraf move karne ke temper mein ajati hiya aur is trha se aik double bottom nichey se bhi banta hey jisko hum Reversal Double backside kehtey hein aur reversal double backside us waqat banta howdy jab fee nichey se uper ki taraf mood mein ajati whats up isliye hamen chahiye keh isko usually locate kartey rahen kioun keh yeh jab bhi marketplace mein banti hi there to market mein hamen aik achi trade dekhne ko mil jati hey aur hum marketplace mein aik achi exchange karne ke qabil ban saktey hein yeh ham day by day basis par H1 ke chart par bhi discover kr saktey hein aur uske ilawa agar hum H4 ka chart dekhen to us mein hamen weekly dekhne ko milti hi there aur yeh kafi acha aur profitable sample he isko hamen kabhi bhi pass over nahin karna chahiye.

                            Click image for larger version

Name:	3333333333333333.png
Views:	3
Size:	4.7 کلوبائٹ
ID:	12431611
                            • <a href="https://www.instaforex.org/ru/?x=ruforum">InstaForex</a>
                            • #15 Collapse

                              forex exchanging principal bhot he amaizng learning ki hain forex exchanging fundamental learning ko incress karna must hota hain forex exchanging primary Banner Graph Candle Example fundamental standards ko check karna must hota hain negative pattern primary guidelines ko pursue kare bullish direction principal Banner Outline Candle Example fundamental principles ko follow kare forex principal har pattren primary kaam karne k liye Banner Diagram Candle Example fundamental b pattern ko check karna hota hain jaab tak pattern ko follow nhe kia jata hain tu kamyabi b nhe hain kamyabi k liye forex exchanging principal difficult work k sath kaam kare forex exchanging primary pattern ko follow kare Banner Graph Candle Example ek parcel of advantage dene wala busneiss hain jaab tak learning nhe hain tu Banner Diagram Candle Example primary huge misfortune ho skta hain pattern agar purchase ka hain tu pattern fundamental purchase section ko find kare Banner Graph Candle Example in forex exchanging market: forex exchanging principal work karne k liye ek brokers ko ordinary kaam karna hotahain forex exchanging fundamental best learning karna must hota hain forex primary normal learning hoti hain tu kamyabi mil skti hain Banner Outline Candle Example fundamental difficult work kare customary pratice kare forex primary Banner Diagram Candle Example in forex exchanging market Banner Graph Candle Example principal bullish pattern primary follow karna must hota hain forex fundamental best learning karna must hota hain pattern ko find karna must hain jaaab tak pattern ko find nhe kia jata hain tu benefit nhe hain is liye pattern ko pursue kare forex principal direction he best advantage deskta hain agar ek dealer Banner Graph Candle Example primary kaam karta hain tu us merchant ko kaam karne k liye pattern ko pursue karna must hota hain agar direction ko follow nhe kia jata hain tu large misfortune ho skta hain huge misfortune he highlight primary best exchanges bana skta hain Banner Diagram Candle Example primary

                              اب آن لائن

                              Working...
                              X