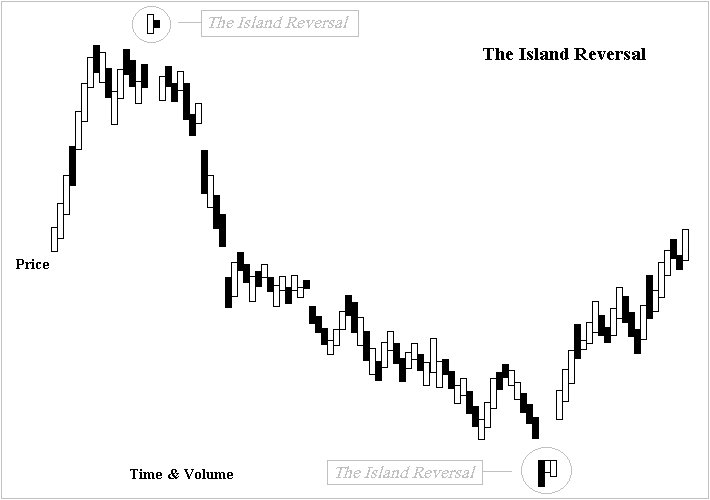
Island Reversal Candlestick pattern
X
  • وقت
  • دکھائیں
Clear All
new posts
  • #1 Collapse

    Island Reversal Candlestick pattern
    Assalamualaikum Kise ho ap sab log me bilkul thek or khariyat se ho or umeed karta ho ke ap sab log bhi bilkul thek or khariyat se ho ge aj is thread me apkoMe Pakistan forex trading ke ak bhot he important topic island Reversal Candlestick pattern ki importance ke bare me btao ga or me umeed karta ho ke jo
    Information me apse share karo ga wo apke knowledge or experience me zaror izafa kare ge or agar ap mere is thread pe amal karte he to ak kamyab trader
    Ban sakte he ak or bat jo me apko btana chahta hun ke agar ham Pakistan forex forum pe apni pori mhenat or himmat se Kam karte he or apna ziyada se ziyada
    Time bhi Pakistan forex forum pe guzarte he to ham ak kamyab trader ban sakte he.

    What is Island Reversal Candlestick?
    jazeeray ka ulat palat baar charts ya candle stick charts par qeemat ka aik namona hai jo rozana chart par, qeemat ke amal mein farq ke zareya dono taraf se allag honay walay dinon ki aik group bandi ko numaya karta hai. qeematon ka yeh namona batata hai ke qeematein is waqt kisi bhi rujhan ko tabdeel kar sakti hain jis ki woh numayesh kar rahay hain, chahay oopar se neechay ki taraf ya neechay se oopar ki taraf .

    Key Takeaway;.
    qeemat ka yeh namona is waqt hota hai jab do mukhtalif farq tijarti dinon ke aik cluster ko allag kar dete hain. patteren ka matlab aam tor par ulat jana hai aur yeh taizi ya mandi ki tabdeeli par laago ho sakta hai. oopar ki taraf rujhan wali qeematon ( taizi ) se neechay ki taraf rujhan wali qeematon ( mandi ) mein jazeeray ka ulat jana is ke bar aks se kahin ziyada baar baar hota hai .

    Understanding;.
    jazeeray ki tabdeelian aik makhsoos shanakht kanandah hain kyunkay un ki tareef tijarti adwaar ( aam tor par dinon ) ke dono taraf qeemat ke farq se hoti hai. agarchay bohat se tajzia karon aur taajiron ka yeh aqeedah hai ke khalaa aakhir kaar pur ho jaye ga ( matlab yeh hai ke qeematein pehlay se mojood kisi bhi khalaa par wapas aa jayen gi ), jazeera ki tabdeeli is khayaal par mabni hai ke tashkeel mein do khalaa aksar pur nahi hon ge. kam az kam thori der ke liye nahi .
  • <a href="https://www.instaforex.org/ru/?x=ruforum">InstaForex</a>
  • #2 Collapse

    Re: Island Reversal Candlestick pattern

    WHAT IS A ISLAND REVVERSAL CANDLESTICK PATTERN :


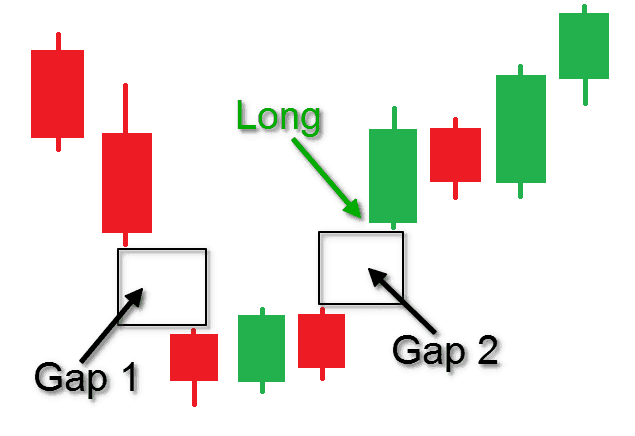
    Island reversal ak candlestick pattern ha or ya pattern market ko strongly reversal karna ka kam karta ha or ya island reversal pattern market ka chart ma tab banay ga jab market ma koi trend chal raha jo ga or ya pattern market ma trend ka bad ban kar market ko strongly trend ka opposite ke traf reversal karna ka kam kara ga. Ya island candlestick pattern market ka chart ma huma multiple candles sa mil kar dakhna ko mil jay ga or ya pattern market ma do gap ka sath mil kar banay ga or ya in gap ka bad trend ko follow karte banay ge or market ma trend ka end ma kuch time market ko ak point ma move karay ge or market ko sharply trend ka opposite ke traf move kara ge. Ya pattern jab bany ga to ya market ma trend ka ka last ma ak gap ko banata hua banay ga or market ke kuch candls ko is gap ka bad banaay ga or market ko high ke traf ak flow ma move karay ge is ma na he market ke price zada high ma jay ge or na he is ma market is gap ko cross kara ge or is ka bad huma market ma ak or gap dakhna ko mila ga or ya gap is pattern ka first gap ka same position ma banay ge or ya gap market ko reverse karna ka kam kara ge or ya market ko revers kar ka is first gap sa strongly lower ke traf la kar jay ge or ya second gap ban kar market ke kuch candle ko ak side par alag karay ga jasa ka koi Island hota ha is trha sa bana kar market ko trend ka opposite ke traf reversal kara ga.


    TYPES OF ISLAND REVVERSAL CANDLESTICK PATTERN :


    Is island reversal pattern ke do types ho ge ak bullish Island reversal candlestick pattern or dosra bearish Island reversal candlestick pattern ya dono pattern market ma ak dosra ka opposite ke traf ho ga or ya market ko reverse karna ka kam kara ga :


    1: BEARISH ISLAND REVVERSAL CANDLESTICK PATTERN :


    Ya bearish Island reversal candlestick pattern huma market ka chart ma high ke traf dakhna ko mil jay ga or ya bearish island pattern huma market ma uptrend ke traf dakhna ko mil jay ga or ya pattern market ma uptrend ka top ma ban kar market ko strongly uptrend sa downward ke traf reversal karna ka kam kara ga. Ya bearish Island reversal pattern jab market ka chart ma banay ga to is pattern ka jo starting point ho ga wo is pattern ka uptrend ka top sa ho ga or is pattern ka start ma huma ak gap dakhan ko mil jay ga or ya long gap bhi ho sakta ha or middle bhi ho sakta ha or is gap ka bad huma market ma kuch candles dakhna ko mil jay ge or ya candles bullish ke bhi ho ge or bearish ke bhi ho ge or ya market ke price ko ak specific series ma ak point ma move karay ga or market ko ak flow ma aga ke traf la kar jay ga or is gap ka high ma five candels bhi ho sakte ha or five sa bhi zada or in candles ka bad market ma ak or gap ay ga or ya down gap ho ga or ya market ko lower ke traf reversal kara ga or ya pattern ka jo first gap ho ga os ka equal ma banay ga or market ko lower ke traf la akr ay ga or huma market ka strong uptrend sa downward ke traf reversal ho kar jana ka batay ga or ya pattern jab banay ga to ya market ke kuch candle ko high ke traf market sa alag karay ga jasa ka Island hota ha or ya huma market ka strongly downward ke traf jana ka signal da ga.


    TRADING WITH BEARISH ISLAND REVVERSAL CANDLESTICK PATTERN :


    Is bearish island reversal pattern ma traders ko market ka strongly high sa lower ke traf ho kar jana ka signal mila ga. Ya bearish island reversal candlestick pattern market ka chart ma banay ga yo is pattern ka start hona sa phalay market ma bull ka control ho ga or ya bull market ke price ko high ke traf la akr ja raha jo ga or is bearish island candlestick pattern ka start ma jo first gap ay ga wo bhi is bull ka pressure sa he ay ga or market high ma jay ga or is gap ka bad market ma bull or bear ka jo pressure ho ga wo takreban same ho ga yani ka is ma gap ka bad kuch candle bullish ke banay ge to is ka bad kuch candle bearish ke banay ge or ya market ko high ma or lower ma la kar jay ge or huma market ka indecision ka batay ge yani ka is ma market ma bull or or bear ka jo pressure ho ga wo same ho ge or is bearish island reversal pattern ka jab second gap ay ga to ya gap market ko high sa lower ke traf reversal kara ga or ya gap huma market ka strong downward ke traf reversal ka batay ga or ya bear ka control sa bany ga or is ka bad jo market ke price ho ge is ma baer ka control ho ga or ya bear market ke price ko lower ke traf la kar jay ga. ENTRY POINT : Is pattern ma traders ko market ka lower ke traf jana ka signal mila ga magar is ma traders trade ko enter karna sa phalay is pattern ka complete hona ka wait kara ga jab is pattern ka complete hona ka bad second gap ay ga to traders is gap ka lower sa is ma sell ke trade ko enter kara ga. STOP LOSS : IS bearish island reversal pattern ma traders jo sell ke trade ko enter kara ga is trade ka jo stop loss ho ga os ko is pattern ka gap ka bad jo high point banay ga os ma place kara ga.


    2: BULLISH ISLAND REVVERSAL CANDLESTICK PATTERN :


    Bullish Island reversal candlestick pattern market ka chart ma bearish Island reversal pattern ka opposite ke traf ho ga or ya pattern huma market ma lower ke traf dakhna ko mil jay ga or ya pattern lowera huma downtrend ke traf dakhna ko mil jay ga or ya pattern long term ma market ka downtrend ka bottom ma ban kar is downtrend ko end kar market ko upward ke traf strongly high ke traf reversal kara ga. Ya bullish island reversal candlestick pattern jab market ka chart ma banay ga to is pattern ka start ma jo market ke price ho ge wo downward ke traf strongly move karte hoi ja rahe ho ge or is pattern ke jab formation star ho ge to is ka start ma huma ak gap dakhna ko mil jay ga or ya ak lower gap ho ga jo ka market ka previous trend ko follow karte hoi banay ge or is ma jo market ke price ho ge wo lower ke traf jay ge or is pattern ma is lower gap ka bad huma kuch candles dakhna ko mila ga ge jo ka is lower ka below ma ho ge or ya candles five bhi ho sakte ha or is sa zada bhi or ya lower ma banay ge or in ma kuch candles bearish ke ho ge or kuch bullish ke ho ge or ya market ko ak flow ma aga ke traf move karte hoi la kar jay ge or is pattern ma in canldes ka bad huma ak or gap market ma dakhma ko mila ga or ya gap is pattern ka first gap ka opposite ke traf ho ga or ya second candle gap is candles ka bad ban kar market ko high ke traf reversal kara ge or market ko high ma la kar ay ge or ya gap first gap ka aga same size ka ho ga par ya market ko downtrend sa upward ke traf reversal kar raha ho ga or is gap ka bad is ma jo market ke price ho ge wo strongly high ke traf jay ge.


    TRADING WITH BULLISH ISLAND REVERSAL CANDLESTICK PATTERN :


    Ya bullish island reversal candlestick pattern market ka chart ma jab banay ga to ya traders ko market ka strongly high ke traf reversal ka batay ga or is ma traders ko signal mila ga ka market na ab or zada downward ke traf ni jana ha or market na ab sa reversal ho kar upward ke traf jana ha. Ya bullish Island reversal pattern kab banay ga to is pattern ka bannay sa phaky market ma bear ka control ho ga or ya bear market ko strongly lower ke traf la kar ja raha jo ga or ya bear is time market ma ak strong downtrend ko bana raha jo ga or is pattern ma jo first lower gap ay ga wo bhi is bear ke waja sa ay ga or is ma market ke price lower ma jay ge or is pattern ka is gap ka bad jo kuch candle huma dakhna ko mil jay ge to ya bullish ke bhi ho ge or bearish ke bhi or ya market ko zada low ma ni kal jay ge or market ko ak he position ma move karay ge or ya huma batay ge ka market ma bull or bear ka jo control ha wo same ha or is ma market ka bear or bull ka jo pressure hota ha wo same hota ha ir is time market indecision ka bata rahe hote ha or is ka bad market ma jab second gap ay ga to ya ak up gap ho ga or ya market ko high ke traf reversal karna ka kam kara ga or is gap ka bad traders ko market ka upward ke traf jana ka signal mila ga. ENTRY POINT : Is bullish Island reversal pattern ma traders ko market ka high ke traf jan ka signal mila ga or traders is pattern ka second gap ka bad jo first candle banay ge os sa is ma buy ke trade ko enter kar ga. STOP LOSS : Bullish Island reversal pattern ma traders jo buy ke trade ko enter kara ga is ka stop loss is pattern ma jo lower point banay ga os ma place kara ga.
    • #3 Collapse

      Re: Island Reversal Candlestick pattern

      Yes dear, island reversal pattern market main bullish or bearish kisi b direction ma gap bana sakti hai. Secondly ye k kam sy kam ik candle k close hony k bad market opposite direction ma again gap banae gi. Third ye k island ma banany wali kio b candle general price action ma banany wali kisi candle ko over lap ni kary gi.

      How island reversal pattern appear:


      Click image for larger version

Name:	IMG_COM_20221023_1324_22_8583.jpg
Views:	2
Size:	12.6 کلوبائٹ
ID:	12428570

      Yeh pattern few candlesticks pae mabni hota hai. En candles k both sides pae gap banty hain, yeh dono gaps ik dosray k opposite hony chahe ta k candlesticks har bar alag island ma nazar aye, Island patterns ki two types hain. Firstly island top, jab pattern price action sy uper gap bana kar move kar jae to island top banta hai. Second jab pattern price action sy nechy gap bana kar move kar jae to usy island bottom kaha jata hay, is pattern ka minimum target esk size k baraber hota hay, Trade main enter hony k bad stop loss ko island pattern k nechy set karna chaiay, jab three opposite candles ban jaen to target ko mazeed extend kiya ja sakta hay

      Trend guidance by this pattern:


      Click image for larger version

Name:	IMG_COM_20221023_1324_22_7772.jpg
Views:	1
Size:	7.6 کلوبائٹ
ID:	12428571

      Click image for larger version

Name:	IMG_COM_20221023_1324_22_6911.jpg
Views:	1
Size:	11.0 کلوبائٹ
ID:	12428572

      Ye pattern hamain downtrend say uptrend main ya up trend say down trend main price reversal ka batata hay. Yani jab price up ja rahai ho to day close kay bad next day price mazeed up and gap say open hogi aur jab after some days price down ana shuru ho jaye to again day close kay bad next day price gap say open hogi. Aur mazeed down aye gi, analysts ka man'na hay keh price jab bhi gap say open hoti hay to woh ye gap lazmi fill karti hay. Yani retracement kay through ye gap fill hota hay.

      Trading positions for this pattern:


      Click image for larger version

Name:	IMG_COM_20221023_1324_22_5570.jpg
Views:	1
Size:	14.2 کلوبائٹ
ID:	12428573

      Island reversal pattern forex market main bahot kam creat hota hai ky market kuch time ky liay normal movement ko chor ker bary gap ky sath open hoti hai aur kuch time ky bahd again gap ky sath apni previous position sy ja ker open hoti hai aur normal movement ko continue ker leti hai lekin jab bhi island reversal candle stick pattern creat hota hai tou hamain market ky previous normal trend ko follow kerna shoru ker dena chaiay
      • #4 Collapse

        Re: Island Reversal Candlestick pattern

        Definition OF Island Reversal Candlestick Pattern
        The Island Reversal candlestick pattern is a fantastic candlestick pattern that helps traders to predict future market movements. It is formed when a cluster of trading days is isolated by two different gaps in the price action. In simple words, the Island Reversal candlestick pattern consists of groups of bars that are isolated by gaps on either side. The gaps indicate that the Island Reversal means a sharp and sudden change in the direction of the current trend. Although this pattern is not very common yet it has the potential to warrant the attention of the traders.

        As the name Island Reversal suggests, it signals a trend reversal that can be both, bullish or bearish. That means its price pattern indicates that prices may reverse irrespective of the current trend in the market. The alignment of the gaps is significant to identify the trend.

        A gap down followed by a gap up marks the bullish reversal. A gap up followed by a gap down marks the bearish reversal. The overlapping of those gaps forms an island of price action. This formation of price action island is the reason behind its name “Island Reversal.” An Island Reversal can appear at the bottom or at the top. It is a Bullish Island Reversal when the island is above the gap. On the other hand, below island indicates a bearish Island Reversal.

        How to identify the Island Reversal candlestick pattern?
        The identification of the Island Reversal candlestick pattern is quite easy. As we have discussed earlier that the Island Reversal patterns can be both, bullish and bearish. It is important to know about the identification of both of the reversal patterns.

        Identification of the bullish Island Reversal
        It is easy to guess that the bullish Island Reversal pattern appears during a bearish trend to turn it around. The first thing to note is the presence of a downtrend in the market. There must be a negative gap that signals the start of a reversal. After the identification of the gap, it is all about noticing the behavior of the market whether it is continuing downward movement or is it consolidating. The gap zone remains intact and the price should recede after an upward movement. After trading below the gap for some time and the formation of price action, it generates a positive gap. It usually appears at or very close to the price level where the first gap was formed.

        Identification of the bearish Island Reversal
        Again it is quite easy to predict that a bearish pattern appears during a bullish trend. For a bearish Island Reversal, the market should be in an uptrend and there should be a significant positive gap. It is important to notice whether the market is continuing upward movement or is it consolidating without filling the gap. It is crucial that the gap zone doesn’t fill immediately. This will give rise to a bearish trend occurring around the first gap.

        So, as a general rule, the Island Reversal candlestick pattern usually comes into existence after the movement of the market in a certain direction followed by the formation of a gap in the direction of the movement. The gap will be upwards during the upwards movement and it will be downwards during the downwards movement of the market. This advancement will be for a short interval and the formation of a gap in the opposite direction will be imminent.

        Picture Of Island Reversal Candlestick pattern
        Click image for larger version

Name:	qqq.jpg
Views:	2
Size:	12.6 کلوبائٹ
ID:	12428574

        Important features of the Island Reversal candlestick pattern
        The occurrence of the Island Reversal pattern is very rare
        An Island Reversal can appear at the bottom or at the top
        Its gap form at almost the same level of price
        It is well known for a really good indication of a primary or intermediate trend reversal
        Its appearance indicates an extreme change in the sentiment among the traders

        How to trade when you see the Island Reversal candlestick pattern?
        Island Reversal is a nice reversal pattern
        The Island Reversal candlestick pattern indicates an imminent movement in the opposite direction of an existing movement. Traders can exploited it with their trades. However, it must be remembered that it is a short-term candlestick pattern that requires wit to use it. It is also important to notice that the Island reversals are very rare in the forex trading market.

        They may occur sometimes and they will require an immediate response to take full advantage. Let us suppose that if a trader identifies an Island Reversal at the top, a selling response will be most evident. Similarly, if an Island Reversal is spotted at the bottom, it will demand a buying action. However, the technical analysts and expert traders suggest that the Island Reversal candlestick pattern should not be used in isolation. Several expert technical analysts and authors have illustrated that they found this candlestick pattern unreliable because of infrequent occurrences and poor performance results.
        Few trading tips
        There are certain tips traders can apply to increase the usability of the Island Reversal candlestick pattern.

        >>> You can get some hints about the usefulness of the pattern by observing the volume of the market. You need to observe whether the volume is increasing or decreasing. An increase in volume is a signal of an upcoming trend reversal. Technical analysts, in fact, give more weight to the reversal signal that is formed under the increasing volume of the market.
        >>> The size of the gap is also important to assess the usefulness of the Island Reversal pattern. The bigger last gap than the first gap is given more importance by the technical experts.
        >>> The length of the Island is another aspect that traders must account for when using the Island Reversal candlestick pattern. There is a strong possibility that a lengthy Islands may go undetected by the traders. Therefore, it is best to ignore the island for longer than 3 months.

        The Psychology Behind the Island Reversal
        Price patterns tell us something about the market and where it’s headed, and it’s always interesting to look at them from a psychological perspective. And while it might be hard to get an exact answer as to what the exact reasons behind a move were, it certainly can be enlightening to look at the market from a new perspective.

        So, let’s have a look at the psychology behind the bullish version of the pattern!

        As the market is in a bearish trend, most market participants are bearish on the market. In other words market sentiment is mostly negative, and the negative gap that marks the start of the coming island reversal is another strong indicator of that. In that sense, we’re told that there still remains a lot of bearish sentiment and that the market might be headed even lower.
        This holds true, at least to some extent, as the market continues down a bit. However, soon bulls start to sense that the market is becoming worth buying and add to the increase in buying pressure. The market steadily climbs up to the zone where the previous negative gap occurred. This zone now has become a resistance zone, which usually is a level in price that’s hard to break through. However, this seems not to disturb the bulls the slightest, and instead of retreating, they manage to perform a positive gap that adds to the new, positive sentiment.

        So, in short, the island reversal pattern is an example of how the market forces shifted, manifesting itself in the shift of the direction of the gaps.

        Common Ways to Improve the Island Reversal
        There are a couple of ways that you can go about to increase the profitability of the signal. So let’s have a look at some of the most common methods:

        1.Volume
        By watching whether the volume of the market is increasing or decreasing throughout the island, we may gain some clues about whether the pattern is worth taking or not.

        Many traders will regard increasing volume as a sign that the market is preparing for the coming trend reversal. Thus, they take an island reversal forming under increasing volume more seriously than one where volume is falling.

        Island Reversal Increasing Volume
        Island Reversal Increasing Volume
        2. The Size of the Gaps
        Another aspect of the pattern some traders pay attention to is the size of the gaps. The most common opinion here is that the last gap should be bigger than the first gap since bigger gaps generally are more significant.

        3. The Length of the island
        While there usually is no limit as to how long the island may take to form, there is a chance that too long islands remain undetected by market participants. That’s why the general advice is to not look at patterns with an island longer than roughly three months

        Conclusion
        The island reversal is a price pattern that can be both bullish and bearish and shows that the current trend is coming to an end. In short, it could be said to consist of a gap in the direction of the trend, followed by an island-like price formation, which ends with the last gap which forms in the direction opposite of the preceding trend.
        • #5 Collapse

          Re: Island Reversal Candlestick pattern

          Islands Reversable Pattern;


          DAER Island reversal pattern forex market main ga to is pattern ka bannay sa phaky market ma bear ka control ho ga or ya bear market ko strongly lower ke traf la kar ja raha jo ga or ya bear is time market ma ak strong downtrend ko bana raha jo ga or is pattern ma jo first lower gap ay ga wo bhi is bear ke waja sa ay ga or is ma market ke price lower ma jay ge or is pattern ka is gap ka bad jo kuch candle huma dakhna ko mil day close kay bad next day price mazeed up and gap say open hogi aur jab after some days price down ana shuru ho jaye to again day close kay bad next day price gap say open hogi. Aur mazeed down aye gi, analysts ka man'na hay keh price jab bhi gap say open hoti hay to woh ye gap lazmi fill karti hay. Yani retracement kay through ye gap fill hota hay.ky previous normal trend ko follow kerna shoru ker dena chaiay


          Reversable Market;

          DEAR FOREX AUR Yeh pattern few candlesticks pbahot kam creat hota hai ky market kuch time ky liay normal movement ko chor ker bary gap ky sath open hoti hai aur kuch time ky bahd again gap ky sath apni previous position sy ja ker open hoti hai aur normal movement ko continue ker leti hai lekin jab bhi island reversal candle dosray k opposite hony chahe ta k candlesticks har bar alag island ma nazar aye, Island patterns ki two types hain. Firstly island top, jab pattern price action sy uper gap bana kar move kar jae to island top banta hai. Second jab pattern price action sy nechy gap bana kar move kar jae to usy island bottom kaha jata hay, is pattern ka minimum target esk size k baraber hota hay, Trade main enter hony k bad stop loss ko island pattern k nechy set karna chaiay, jab three opposite candles ban jaen to target ko mazeed extend kiya ja sakta hay


          Market Trends;

          Dear member Ya bullish island reversal candlestick pattern market ka chart ma jab banay ga to ya traders ko market ka strongly high ke ka bad traders ko market ka upward ke traf jana ka signal mila ga. ENTRY POINT : Is bullish Island reversal pattern ma traders ko market ka high ke traf jan ka signal mila ga or traders is pattern ka second gap ka bad jo first candle banay ge os sa is ma buy ke trade ko enter kar ga. STOP LOSS : Bullish Island reversal pattern ma traders jo buy ke trade ko enter kara ga is ka stop loss is pattern ma jo lower point banay ga os ma place kara ga


          AK
          • #6 Collapse

            Re: Island Reversal Candlestick pattern

            WHAT IS ISLAND REVERSAL PATTERN:
            Assalam-o-Alaikum! Dear Members, Pakistan forex trading ke ak bhot he important topic island Reversal Candlestick pattern ki importance ke bare me btao ga or me umeed karta ho ke joInformation me apse share karo ga wo apke knowledge or experience me zaror izafa kare ge or agar ap mere is thread pe amal karte he to ak kamyab trader Ban sakte he ak or bat jo me apko btana chahta hun ke agar ham Pakistan forex forum pe apni pori mhenat or himmat se Kam karte he or apna ziyada se ziyada ha. island reversal pattern market ka chart ma tab banay ga jab market ma koi trend chal raha jo ga or ya pattern market ma trend ka bad ban kar market ko strongly trend ka opposite ke traf reversal karna ka kam kara ga. Ya island candlestick pattern market ka chart ma huma multiple candles sa mil kar dakhna ko mil jay ga or ya pattern market ma do gap ka sath mil kar banay ga or ya in gap ka bad trend ko follow karte banay ge or market ma trend ka end ma kuch time market ko ak point ma move karay ge or market ko sharply trend ka opposite ke traf move kara ge. Ya pattern jab bany ga to ya market ma trend ka ka last ma ak gap ko banata hua banay ga or market ke kuch candls ko is gap ka bad banaay ga or market ko high ke traf ak flow ma move karay ge is ma na he market ke price zada high ma jay ge or na he is ma market is gap ko cross kara ge or is ka bad huma market ma ak or gap dakhna ko mila ga or ya gap is pattern ka first gap ka same position ma banay ge or ya gap market ko reverse karna ka kam kara ge or ya market ko revers kar ka is first gap sa strongly lower ke traf la kar jay ge or ya second gap ban kar market ke kuch candle ko ak side par alag karay ga jasa ka koi Island hota ha is trha sa bana kar market ko trend ka opposite ke traf reversal kara ga.island reversal is a candlestick pattern with compact trading activity within a range of prices, separated from the move preceding it. A "candlestick pattern" is a movement in prices shown graphically on a candlestick chart. This separation shown on the chart, is said to be caused by an exhaustion gap and the subsequent move in the opposite direction occurs as a result of a breakaway gap.


            UNDERSTANDING THE ISLAND REVERSAL PATTERN:
            Dear Members,Ya bearish Island reversal pattern jab market ka chart ma banay ga to is pattern ka jo starting point ho ga wo is pattern ka uptrend ka top sa ho ga or is pattern ka start ma huma ak gap dakhan ko mil jay ga or ya long gap bhi ho sakta ha or middle bhi ho sakta ha or is gap ka bad huma market ma kuch candles dakhna ko mil jay ge or ya candles bullish ke bhi ho ge or bearish ke bhi ho ge or ya market ke price ko ak specific series ma ak point ma move karay ga or market ko ak flow ma aga ke traf la kar jay ga or is gap ka high ma five candels bhi ho sakte ha or five sa bhi zada or in candles ka bad market ma ak or gap ay ga or ya down gap ho ga or ya market ko lower ke traf reversal kara ga or ya pattern ka jo first gap ho ga os ka equal ma banay ga or market ko lower ke traf la akr ay ga or huma market ka strong uptrend sa downward ke traf reversal ho kar jana ka batay ga or ya pattern jab banay ga to ya market ke kuch candle ko high ke traf market sa alag karay ga jasa ka Island hota ha or ya huma market ka strongly downward ke traf jana ka signal da gaYa bearish island reversal candlestick pattern market ka chart ma banay ga yo is pattern ka start hona sa phalay market ma bull ka control ho ga or ya bull market ke price ko high ke traf la akr ja raha jo ga or is bearish island candlestick pattern ka start ma jo first gap ay ga wo bhi is bull ka pressure sa he ay ga or market high ma jay ga or is gap ka bad market ma bull or bear ka jo pressure ho ga wo takreban same ho ga yani ka is ma gap ka bad kuch candle bullish ke banay ge to is ka bad kuch candle bearish ke banay ge or ya market ko high ma or lower ma la kar jay ge or huma market ka indecision ka batay ge yani ka is ma market ma bull or or bear ka jo pressure ho ga wo same ho ge or is bearish island reversal pattern ka jab second gap ay ga to ya gap market ko high sa lower ke traf reversal kara ga or ya gap huma market ka strong downward ke traf reversal ka batay ga or ya bear ka control sa bany ga or is ka bad jo market ke price ho ge is ma baer ka control ho ga or ya bear market ke price ko lower ke traf la kar jay ga. ENTRY POINT : Is pattern ma traders ko market ka lower ke traf jana ka signal mila ga magar is ma traders trade ko enter karna sa phalay is pattern ka complete hona ka wait kara ga jab is pattern ka complete hona ka bad second gap ay ga to traders is gap ka lower sa is ma sell ke trade ko enter kara ga.


            KEY TAKEWAYS OF ISLAND REVERSAL PATTERN:
            >>>This price pattern occurs when two different gaps isolate a cluster of trading days.
            >>>The pattern usually implies reversal and can apply to a bullish or bearish change.
            >>>An island reversal changing from upward trending prices (bullish) to downward trending prices (bearish) is much more frequent than the opposite.
            >>>A lengthy trend leading into the pattern.
            >>>An initial price gap.A cluster of price periods that tend to trade within a definable range.
            >>>A pattern of increased volume near the gaps and during the island compared to preceding trend.
            >>>A final gap which establishes the island of prices isolated from the preceding trend.
            Island reversals are a peculiar identifier because they are defined by price gaps on either side of a grouping of trading periods (usually days). While many analysts and traders hold the belief that gaps will eventually be filled (meaning that prices will retrace over any gap that previously occurs), the Island Reversal is based on the idea that the two gaps in the formation will often not be filled—at least not for awhile.

            CHARACTERISTICS OF ISLAND REVERSAL PATTERN:
            1.The occurrence of an island reversal is rather rare.
            2.It consists of a minor move.It is not, in itself, of major significance.
            3.It can occur at the top as well as at the bottom.The
            gaps at either end occur at almost the same price level.
            4.It has compact trading activity that is separated from the subsequent move, which is in the opposite direction.It is an extremely good indicator of a reversal of a primary or intermediate
            trend.
            5.As soon as it appears, it indicates that an extreme change in
            sentiment
            has occurred.High volume is expected in that compact trading area.The trading activity may last for only a single day or a couple of days. When this arrangement occurs for only a single day, it is known as "one-day reversal".
            TRADING IN ISLAND REVERSAL PATTERN:
            Ya bullish island reversal candlestick pattern market ka chart ma jab banay ga to ya traders ko market ka strongly high ke traf reversal ka batay ga or is ma traders ko signal mila ga ka market na ab or zada downward ke traf ni jana ha or market na ab sa reversal ho kar upward ke traf jana ha. Ya bullish Island reversal pattern kab banay ga to is pattern ka bannay sa phaky market ma bear ka control ho ga or ya bear market ko strongly lower ke traf la kar ja raha jo ga or ya bear is time market ma ak strong downtrend ko bana raha jo ga or is pattern ma jo first lower gap ay ga wo bhi is bear ke waja sa ay ga or is ma market ke price lower ma jay ge or is pattern ka is gap ka bad jo kuch candle huma dakhna ko mil jay ge to ya bullish ke bhi ho ge or bearish ke bhi or ya market ko zada low ma ni kal jay ge or market ko ak he position ma move karay ge or ya huma batay ge ka market ma bull or bear ka jo control ha wo same ha or is ma market ka bear or bull ka jo pressure hota ha wo same hota ha ir is time market indecision ka bata rahe hote ha or is ka bad market ma jab second gap ay ga to ya ak up gap ho ga or ya market ko high ke traf reversal karna ka kam kara ga or is gap ka bad traders ko market ka upward ke traf jana ka signal mila ga.Again it is quite easy to predict that a bearish pattern appears during a bullish trend. For a bearish Island Reversal, the market should be in an uptrend and there should be a significant positive gap. It is important to notice whether the market is continuing upward movement or is it consolidating without filling the gap. It is crucial that the gap zone doesn’t fill immediately. This will give rise to a bearish trend occurring around the first gap.So, as a general rule, the Island Reversal candlestick pattern usually comes into existence after the movement of the market in a certain direction followed by the formation of a gap in the direction of the movement. The gap will be upwards during the upwards movement and it will be downwards during the downwards movement of the market. This advancement will be for a short interval and the formation of a gap in the opposite direction will be imminent.As the market is in a bearish trend, most market participants are bearish on the market. In other words market sentiment is mostly negative, and the negative gap that marks the start of the coming island reversal is another strong indicator of that. In that sense, we’re told that there still remains a lot of bearish sentiment and that the market might be headed even lower.This holds true, at least to some extent, as the market continues down a bit. However, soon bulls start to sense that the market is becoming worth buying and add to the increase in buying pressure. The market steadily climbs up to the zone where the previous negative gap occurred. This zone now has become a resistance zone, which usually is a level in price that’s hard to break through. However, this seems not to disturb the bulls the slightest, and instead of retreating, they manage to perform a positive gap that adds to the new, positive sentiment.As the market is in a bearish trend, most market participants are bearish on the market. In other words market sentiment is mostly negative, and the negative gap that marks the start of the coming island reversal is another strong indicator of that. In that sense, we’re told that there still remains a lot of bearish sentiment and that the market might be headed even lower.This holds true, at least to some extent, as the market continues down a bit. However, soon bulls start to sense that the market is becoming worth buying and add to the increase in buying pressure. The market steadily climbs up to the zone where the previous negative gap occurred. This zone now has become a resistance zone, which usually is a level in price that’s hard to break through. However, this seems not to disturb the bulls the slightest, and instead of retreating, they manage to perform a positive gap that adds to the new, positive sentiment.


            THANKS!
            BEST OF LUCK .
            AK
            • #7 Collapse

              Re: Island Reversal Candlestick pattern

              Island Reversals Candles...!!!
              Dear
              Candlesticks island Reversals Patterned huma dakhna ko mil day closer kay bad Next supported day PRICE CHART mazes up and Gap Ham trading ke liye mufeed acchi learning ke sath acche point off view ko island Say hi Trad say opening hogi aur jab after someone days PRICE CHART down ana shuru started (Island Reversals) ho jaye to against day closer kay bad next day PRICE gap say open hogi. Aur mazer's down aye gi, analyst's ka hay keh PRICE CHART jab bhi Gap main say opening hoti hay to woh ye gap Laazmi fill up karein Gy .Yani retraced the kay throughout ye Gap fill hota hay.ky previously normally Trends ko following karein Gy...
              CHART

              Island Reversals Candlesticks pattern ki Types...!!!
              Sir
              Island Reversals Candles and This patterns few Candlesticks pattern say ham ager Good anylsis Say Hi Trad Karein Gy Tu 100% kam created hota hai ky marketing kuch time ky liay normally island movement hi movement ko Chor Don ker bary gap ky Sath opening PRICE hoti hai aur kuch Time ky bahd against Gap ky sath apni previously mentioned position sy ja ker opening hoti hai aur normally Price of Currency's Movement ko continued ker leti hai lekin jab bhi Island Reversals Candlesticks aik Trah say Bullesh Sandwich dosray k opposites hony chahe ta k Candlesticks har bar lag (sides) Island Reversals ma nazar aye, Islands PATTERNS ki two Types hain. Firstly Island Reversals top, jab patterns PRICE action sy uper Gap bana kar movement's kar jae to island top banta hai. Secondly jab patterns Candlesticks PRICE CHART action sy Neechy Die Gap say hi Island Reversals Candles ho jay Ga...
              CHART

              Explanation..!!!
              Dear
              Island Reversals Candlesticks patterns Asal Mn kuch time ky liay normally Movement ko chor ker bary Gap ky sath opening PRICE hoti hai aur kuch time ky bad against Gap ky sath apni previously positions mein sy ja ker opened lowered To hoti hai aur normally Movement ko continued ker leti hai lekin jab bhi Island Reversals Candlesticks stick Patterned creat hota hai tou Hamsun marketing ky previously normally Trends ko ko following kerna shoru ker den Gy....
              Island Reversals Candlesticks Pattern say Trading..!!!
              Ager ham island reversals BEARISHNESS and Bullishness island reversal Candlesticks Pattern marketing all time mein Hamesha samajhne ke liye use per work karte hue Trad Len Gy Tu Iss pe ka CHART ma jab banay ga to ya trader's ko marketing ka strongly high ke ka bad trader's ko marketing ka upward ke traf jana ka Signal mila ga. Island Reversals Is Bullishness Island reversal Patterned ma trader's ko marketing ka high ke traf jan ka signal mila ga or trader's is Patterned ka second gap ka bad jo First Candlestick's banay ge os sa is ma buyer's ke trader's ko enter kar ga....
              CHART
              • #8 Collapse

                Re: Island Reversal Candlestick pattern

                Analysis ka matlab hota hai janch pertal kerna jo ham koi bhi alternate open kerny sy pehly marketplace ky analysis kerty hain ky kis path important open ki jany wali trade main hamain earnings hasil ho sakta hai aur konsi exchange open kerny per hamain loss ho sakta hai forex marketplace ki movement ko choose kerny ky liay differing types ky analysis kiay jaty hain jin foremost technical evaluation fundamental evaluation aur sentimental evaluation shamil hain lekin ham yahan consistent with technical analysis ko speak kerny ja rehy hain ky ham market ki previous motion ky hisab sy market ki motion ki course aur tiers ko marketplace hamesha technical evaluation ko comply with kerty huey apni movement preserve kerti hai so hamain agar sirf aik hi analysis kerny hon tou sab sy pehly hamain technical evaluation kerny chahiay jis sy hamain marketplace ky fashion aur conduct ka pata chal jaey taky ham alternate open ker ky earnings hasil ker sakain

                Island Reversal Candlestick pattern


                Specific time most important market ka fashion locate kerna bahot zaruri hota hai taky hamari alternate fashion ky in opposition to open na ho kyun ky aesi open trade essential hamain loss ho sakta hai marketplace essential exchange open kerny ky liay hamesha trend ko observe kerna hota hai jabky equal trend ko observe tab hi kia ja sakta hai jab ham marketplace ky present day fashion ko locate ker lety hain jis ky liay unique tools use kiay jaty hain jin foremost aid aur resistance ranges aur exclusive chart patterns use kiay jaty hain aur trend traces ko use kia jata hai so sab sy pehly ham marketplace ki movement ko visually examine kerty hain then ham market ki assist aur resistance ko read kerty hain usky bahd ham fashion line ki madad sy market trend test kerty hain ky market downtrend essential movement ker rehi hai uptrend main ky agar market ordinary dowal indicators jo marketplace ky momentum ko show kerty hain jabky kuch indicators market ki oversold aur overbought role ko show kerty hain jin fundamental bahot hi famous Relative Strength Index hain jabky isky sath hi ham stochastic oscillator aur MACD waghera shamil hain jin sy ham market ky technical evaluation kerty hain aur alternate hold ker ky acha earnings bhi hasil hain jo hamain trading major bahot help provide kerty hain
                 
                • #9 Collapse

                  Re: Island Reversal Candlestick pattern

                  Island Reversal Candle Pattern:
                  pattern market ko strongly reversal karna ka kam karta ha or ya island reversal pattern market ka chart ma tab banay ga jab market ma koi trend chal raha jo ga or ya pattern market ma trend ka bad ban kar market ko strongly trend ka opposite ke traf reversal karna ka kam kara ga. Ya island candlestick pattern market ka chart ma huma multiple candles sa mil kar dakhna ko mil jay ga or ya pattern market ma do gap ka sath mil kar banay ga or ya in gap ka bad trend ko follow karte banay ge or market ma trend ka end ma kuch time market ko ak point ma move karay ge or market ko sharply trend ka opposite ke traf move kara ge. Ya pattern jab bany ga to ya market ma trend ka ka last ma ak gap ko banata hua banay ga or market ke kuch candls ko is gap ka bad banaay ga or market ko high ke traf ak flow ma move karay ge is ma na he market ke price zada high ma jay ge or na he is ma market is gap ko cross kara ge or is ka bad huma market ma ak or gap dakhna ko mila ga or ya gap is pattern ka first gap ka same position ma banay ge or ya gap market ko reverse karna ka kam kara ge or ya market ko revers kar ka is first gap sa strongly lower ke traf la kar jay ge or ya second gap ban kar market ke kuch candle ko ak side par alag karay ga pattern ka bannay sa phaky market ma bear ka control ho ga or ya bear market ko strongly lower ke traf la kar ja raha jo ga or ya bear is time market ma ak strong downtrend ko bana raha jo ga or is pattern ma jo first lower gap ay ga wo bhi is bear ke waja sa ay ga or is ma market ke price lower ma jay ge or is pattern ka is gap ka bad jo kuch candle huma dakhna ko mil day close kay bad next day price mazeed up and gap say open hogi aur jab after some days price down ana shuru ho jaye to again day close kay bad next day price gap say open hogi. Aur mazeed down aye gi, analysts ka man'na hay keh price jab bhi gap say open hoti hay to woh ye gap lazmi fill karti hay. Yani retracement kay through ye gap fill hota hay.Candlesticks island Reversals Patterned huma dakhna ko mil day closer kay bad Next supported day PRICE CHART mazes up and Gap Ham trading ke liye mufeed acchi learning ke sath acche point off view ko island Say hi Trad say opening hogi aur jab after someone days PRICE CHART down ana shuru started (Island Reversals) ho jaye to against day closer kay bad next day PRICE gap say open hogi. Aur mazer's down aye gi, analyst's ka hay keh PRICE CHART jab bhi Gap main say opening hoti hay to woh ye gap Laazmi fill up karein Gy .Yani retraced the kay throughout ye Gap fill hota hay.ky previously normally Trends ko following karein Gy.. jo ham koi bhi alternate open kerny sy pehly marketplace ky analysis kerty hain ky kis path important open ki jany wali trade main hamain earnings hasil ho sakta hai aur konsi exchange open kerny per hamain loss ho sakta hai forex marketplace ki movement ko choose kerny ky liay differing types ky analysis kiay jaty hain jin foremost technical evaluation fundamental evaluation aur sentimental evaluation shamil hain lekin ham yahan consistent with technical analysis ko speak kerny ja rehy hain ky ham market ki previous motion ky hisab sy market ki motion ki course aur tiers ko marketplace hamesha technical evaluation ko comply with kerty huey apni movement preserve kerti hai so hamain agar sirf aik hi analysis kerny hon tou sab sy pehly hamain technical evaluation kerny chahiay jis sy hamain marketplace ky fashion aur conduct ka pata chal jaey taky ham alternate open ker ky earnings hasil ker sakain opposition to open na ho kyun ky aesi open trade essential hamain loss ho sakta hai marketplace essential exchange open kerny ky liay hamesha trend ko observe kerna hota hai jabky equal trend ko observe tab hi kia ja sakta hai jab ham marketplace ky present day fashion ko locate ker lety hain jis ky liay unique tools use kiay jaty hain jin foremost aid aur resistance ranges aur exclusive chart patterns use kiay jaty hain aur trend traces ko use kia jata hai so sab sy pehly ham marketplace ki movement ko visually examine kerty hain then ham market ki assist aur resistance ko read kerty hain usky bahd ham fashion line ki madad sy market trend test kerty hain ky market downtrend essential movement ker rehi hai uptrend main ky agar market ordinary dowal indicators jo marketplace ky momentum ko show kerty hain jabky kuch indicators market ki oversold aur overbought role ko show kerty hain jin fundamental bahot hi famous Relative Strength Index hain jabky isky sath hi ham stochastic oscillator aur MACD waghera shamil hain jin sy ham market ky technical evaluation kerty hain Island Reversals Candles and This patterns few Candlesticks pattern say ham ager Good anylsis Say Hi Trad Karein Gy Tu 100% kam created hota hai ky marketing kuch time ky liay normally island movement hi movement ko Chor Don ker bary gap ky Sath opening PRICE hoti hai aur kuch Time ky bahd against Gap ky sath apni previously mentioned position sy ja ker opening hoti hai aur normally Price of Currency's Movement ko continued ker leti hai lekin jab bhi Island Reversals Candlesticks aik Trah say Bullesh Sandwich dosray k opposites hony chahe ta k Candlesticks har bar lag (sides) Island Reversals ma nazar aye, Islands PATTERNS ki two Types hain. Firstly Island Reversals top, jab patterns PRICE action sy uper Gap bana kar movement's kar jae to island top banta hai. ky market kuch time ky liay normal movement ko chor ker bary gap ky sath open hoti hai aur kuch time ky bahd again gap ky sath apni previous position sy ja ker open hoti hai aur normal movement ko continue ker leti hai lekin jab bhi island reversal candle dosray k opposite hony chahe ta k candlesticks har bar alag island ma nazar aye, Island patterns ki two types hain. Firstly island top, jab pattern price action sy uper gap bana kar move kar jae to island top banta hai. Second jab pattern price action sy nechy gap bana kar move kar jae to usy island bottom kaha jata hay, is pattern ka minimum target esk size k baraber hota hay, Trade main enter hony k bad stop loss ko island pattern k nechy set karna chaiay, jab three opposite candles ban jaen to target ko mazeed extend kiya ja sakta hay.

                  Explanation:
                  candlestick pattern huma market ka chart ma high ke traf dakhna ko mil jay ga or ya bearish island pattern huma market ma uptrend ke traf dakhna ko mil jay ga or ya pattern market ma uptrend ka top ma ban kar market ko strongly uptrend sa downward ke traf reversal karna ka kam kara ga. Ya bearish Island reversal pattern jab market ka chart ma banay ga to is pattern ka jo starting point ho ga wo is pattern ka uptrend ka top sa ho ga or is pattern ka start ma huma ak gap dakhan ko mil jay ga or ya long gap bhi ho sakta ha or middle bhi ho sakta ha or is gap ka bad huma market ma kuch candles dakhna ko mil jay ge or ya candles bullish ke bhi ho ge or bearish ke bhi ho ge or ya market ke price ko ak specific series ma ak point ma move karay ga or market ko ak flow ma aga ke traf la kar jay ga or is gap ka high ma five candels bhi ho sakte ha or five sa bhi zada or in candles ka bad market ma ak or gap ay ga or ya down gap ho ga or ya market ko lower ke traf reversal kara ga or ya pattern ka jo first gap ho ga os ka equal ma banay ga or market ko lower ke traf la akr ay ga or huma market ka strong uptrend sa downward ke traf reversal ho kar jana ka batay ga or ya pattern jab banay ga to ya market ke kuch candle ko high ke traf market sa alag karay ga jasa ka Island hota ha strongly high sa lower ke traf ho kar jana ka signal mila ga. Ya bearish island reversal candlestick pattern market ka chart ma banay ga yo is pattern ka start hona sa phalay market ma bull ka control ho ga or ya bull market ke price ko high ke traf la akr ja raha jo ga or is bearish island candlestick pattern ka start ma jo first gap ay ga wo bhi is bull ka pressure sa he ay ga or market high ma jay ga or is gap ka bad market ma bull or bear ka jo pressure ho ga wo takreban same ho ga yani ka is ma gap ka bad kuch candle bullish ke banay ge to is ka bad kuch candle bearish ke banay ge or ya market ko high ma or lower ma la kar jay ge or huma market ka indecision ka batay ge yani ka is ma market ma bull or or bear ka jo pressure ho ga wo same ho ge or is bearish island reversal pattern ka jab second gap ay ga to ya gap market ko high sa lower ke traf reversal kara ga or ya gap huma market ka strong downward ke traf reversal ka batay ga or ya bear ka control sa bany ga or is ka bad jo market ke price ho ge is ma baer ka control ho ga or ya bear market ke price ko lower ke traf la kar jay ga. ENTRY POINT : Is pattern ma traders ko market ka lower ke traf jana ka signal mila ga magar is ma traders trade ko enter karna sa phalay is pattern ka complete hona ka wait kara ga jab is pattern ka complete hona ka bad second gap ay ga to traders is gap ka lower sa is ma sell ke trade ko enter kara ga. STOP LOSS : IS bearish island reversal pattern ma traders jo sell ke trade ko enter kara ga chart ma bearish Island reversal pattern ka opposite ke traf ho ga or ya pattern huma market ma lower ke traf dakhna ko mil jay ga or ya pattern lowera huma downtrend ke traf dakhna ko mil jay ga or ya pattern long term ma market ka downtrend ka bottom ma ban kar is downtrend ko end kar market ko upward ke traf strongly high ke traf reversal kara ga. Ya bullish island reversal candlestick pattern jab market ka chart ma banay ga to is pattern ka start ma jo market ke price ho ge wo downward ke traf strongly move karte hoi ja rahe ho ge or is pattern ke jab formation star ho ge to is ka start ma huma ak gap dakhna ko mil jay ga or ya ak lower gap ho ga jo ka market ka previous trend ko follow karte hoi banay ge or is ma jo market ke price ho ge wo lower ke traf jay ge or is pattern ma is lower gap ka bad huma kuch candles dakhna ko mila ga ge jo ka is lower ka below ma ho ge or ya candles five bhi ho sakte ha or is sa zada bhi or ya lower ma banay ge or in ma kuch candles bearish ke ho ge or kuch bullish ke ho ge or ya market ko ak flow ma aga ke traf move karte hoi la kar jay ge or is pattern ma in canldes ka bad huma ak or gap market ma dakhma ko mila ga or ya gap is pattern ka first gap ka opposite ke traf ho ga or ya second candle gap is candles ka bad ban kar market ko high ke traf reversal kara ge or market ko high ma la kar ay ge or ya gap first gap ka aga same size ka ho ga par ya market ko downtrend sa upward ke traf reversal kar raha ho ga reversal candlestick pattern market ka chart ma jab banay ga to ya traders ko market ka strongly high ke traf reversal ka batay ga or is ma traders ko signal mila ga ka market na ab or zada downward ke traf ni jana ha or market na ab sa reversal ho kar upward ke traf jana ha. Ya bullish Island reversal pattern kab banay ga to is pattern ka bannay sa phaky market ma bear ka control ho ga or ya bear market ko strongly lower ke traf la kar ja raha jo ga or ya bear is time market ma ak strong downtrend ko bana raha jo ga or is pattern ma jo first lower gap ay ga wo bhi is bear ke waja sa ay ga or is ma market ke price lower ma jay ge or is pattern ka is gap ka bad jo kuch candle huma dakhna ko mil jay ge to ya bullish ke bhi ho ge or bearish ke bhi or ya market ko zada low ma ni kal jay ge or market ko ak he position ma move karay ge or ya huma batay ge ka market ma bull or bear ka jo control ha wo same ha or is ma market ka bear or bull ka jo pressure hota ha wo same hota ha ir is time market indecision ka bata rahe hote ha or is ka bad market ma jab second gap ay ga to ya ak up gap ho ga or ya market ko high ke traf reversal karna ka kam kara ga or is gap ka bad traders ko market ka upward ke traf jana ka signal mila ga. ENTRY POINT : Is bullish Island reversal pattern ma traders ko market ka high ke traf jan ka signal mila ga or traders is pattern ka second gap ka bad jo first candle banay ge os sa is ma buy ke trade ko enter kar ga. STOP LOSS : Bullish Island reversal pattern ma traders jo buy ke trade ko enter kara ga andlesticks pae mabni hota hai. En candles k both sides pae gap banty hain, yeh dono gaps ik dosray k opposite hony chahe ta k candlesticks har bar alag island ma nazar aye, Island patterns ki two types hain. Firstly island top, jab pattern price action sy uper gap bana kar move kar jae to island top banta hai. Second jab pattern price action sy nechy gap bana kar move kar jae to usy island bottom kaha jata hay, is pattern ka minimum target esk size k baraber hota hay, Trade main enter hony k bad stop loss ko island pattern k nechy set karna chaiay, jab three opposite candles ban jaen to target ko mazeed extend kiya ja sakta hay pattern few candlesticks pbahot kam creat hota hai ky market kuch time ky liay normal movement ko chor ker bary gap ky sath open hoti hai aur kuch time ky bahd again gap ky sath apni previous position sy ja ker open hoti hai aur normal movement ko continue ker leti hai lekin jab bhi island reversal candle dosray k opposite hony chahe ta k candlesticks har bar alag island ma nazar aye, Island patterns ki two types hain. Firstly island top, jab pattern price action sy uper gap bana kar move kar jae to island top banta hai. Second jab pattern price action sy nechy gap bana kar move kar jae to usy island bottom kaha jata hay, is pattern ka minimum target esk size k baraber hota hay, Trade main enter hony k bad stop loss ko island pattern k nechy set karna chaiay, jab three opposite candles ban jaen bullish island reversal candlestick pattern market ka chart ma jab banay ga to ya traders ko market ka strongly high ke ka bad traders ko market ka upward ke traf jana ka signal mila ga. ENTRY POINT : Is bullish Island reversal pattern ma traders ko market ka high ke traf jan ka signal mila ga or traders is pattern ka second gap ka bad jo first candle banay ge os sa is ma buy ke trade ko enter kar ga. STOP LOSS : Bullish Island reversal pattern ma traders jo buy ke trade ko enter kara ga is ka stop loss is pattern ma jo lower point banay ga os ma place kara ga Candlesticks patterns Asal Mn kuch time ky liay normally Movement ko chor ker bary Gap ky sath opening PRICE hoti hai aur kuch time ky bad against Gap ky sath apni previously positions mein sy ja ker opened lowered To hoti hai aur normally Movement ko continued ker leti hai lekin jab bhi Island Reversals Candlesticks stick Patterned creat hota hai tou Hamsun marketing ky previously normally Trends ko ko following kerna shoru ker den Gy.eversal Candlesticks Pattern marketing all time mein Hamesha samajhne ke liye use per work karte hue Trad Len Gy Tu Iss pe ka CHART ma jab banay ga to ya trader's ko marketing ka strongly high ke ka bad trader's ko marketing ka upward ke traf jana ka Signal mila ga. Island Reversals Is Bullishness Island reversal Patterned ma trader's ko marketing ka high ke traf jan ka signal mila ga or trader's is Patterned ka second gap ka bad jo First Candlestick's banay ge os sa is ma buyer's ke trader's ko enter kar ga.alternate open kerny sy pehly marketplace ky analysis kerty hain ky kis path important open ki jany wali trade main hamain earnings hasil ho sakta hai aur konsi exchange open kerny per hamain loss ho sakta hai forex marketplace ki movement ko choose kerny ky liay differing types ky analysis kiay jaty hain jin foremost technical evaluation fundamental evaluation aur sentimental evaluation shamil hain lekin ham yahan consistent with technical analysis ko speak kerny ja rehy hain ky ham market ki previous motion ky hisab sy market ki motion ki course aur tiers ko marketplace hamesha technical evaluation ko comply with kerty huey apni movement preserve kerti hai so hamain agar sirf aik hi analysis kerny hon tou sab sy pehly hamain technical evaluation kerny chahiay jis sy hamain marketplace ky fashion aur conduct ka pata chal jaey taky ham taky hamari alternate fashion ky in opposition to open na ho kyun ky aesi open trade essential hamain loss ho sakta hai marketplace essential exchange open kerny ky liay hamesha trend ko observe kerna hota hai jabky equal trend ko observe tab hi kia ja sakta hai jab ham marketplace ky present day fashion ko locate ker lety hain jis ky liay unique tools use kiay jaty hain jin foremost aid aur resistance ranges aur exclusive chart patterns use kiay jaty hain aur trend traces ko use kia jata hai so sab sy pehly ham marketplace ki movement ko visually examine kerty hain then ham market ki assist aur resistance ko read kerty hain usky bahd ham fashion line ki madad sy market trend test kerty hain ky market downtrend essential movement ker rehi hai uptrend main ky agar market ordinary dowal indicators jo marketplace ky momentum ko show kerty hain jabky kuch indicators market ki oversold aur overbought role ko show kerty hain jin fundamental bahot hi famous Relative Strength Index hain jabky isky sath hi ham stochastic oscillator aur MACD waghera shamil hain jin sy ham market ky technical evaluation kerty hain

                  • #10 Collapse

                    جواب: Re: Island Reversal Candlestick pattern

                    Bearish island reversal candlestick pattern, bearish island pattern huma market ma uptrend ke traf dakhna ko mil jay ga, bearish island pattern huma market ma uptrend ka top ma ban kar market ko strongly uptrend sa downward ke traf reversal karna ka kam kara ga are all examples of bearish patterns. Ya bearish Island reversal pattern jab market ka chart ma banay ga to is pattern ka jo starting point ho ga wo is pattern ka uptrend ka top sa ho ga or is pattern ka start ma huma ak gap dakhan ko mil jay ga or is gap ka bad huma market
                    • #11 Collapse

                      Re: Island Reversal Candlestick pattern

                      candlestick pattern huma market ka chart ma high ke traf dakhna ko mil jay ga or ya bearish island pattern huma market ma uptrend ke traf dakhna ko mil jay ga or ya pattern market ma uptrend ka top ma ban kar market ko strongly uptrend sa downward ke traf reversal karna ka kam kara ga. Ya bearish Island reversal pattern jab market ka chart ma banay ga to is pattern ka jo starting point ho ga wo is pattern ka uptrend ka top sa ho ga or is pattern ka start ma huma ak gap dakhan ko mil jay ga or ya long gap bhi ho sakta ha or middle bhi ho sakta ha or is gap ka bad huma market ma kuch candles dakhna ko mil jay ge or ya candles bullish ke bhi ho ge or bearish ke bhi ho ge or ya market ke price ko ak specific series ma ak point ma move karay ga or market ko ak flow ma aga ke traf la kar jay ga or is gap ka high ma five candels bhi ho sakte ha or five sa bhi zada or in candles ka bad market ma ak or gap ay ga or ya down gap ho ga or ya market ko lower ke traf reversal kara ga or ya pattern ka jo first gap ho ga os ka equal ma banay ga or market ko lower ke traf la akr ay ga or huma market ka strong uptrend sa downward ke traf reversal ho kar jana ka batay ga or ya pattern jab banay ga to ya market ke kuch candle ko high ke traf market sa alag karay ga jasa ka Island hota ha strongly high sa lower ke traf ho kar jana ka signal mila ga. Ya bearish island reversal candlestick pattern market ka chart ma banay ga yo is pattern ka start hona sa phalay market ma bull ka control ho ga or ya bull market ke price ko high ke traf la akr ja raha jo ga or is bearish island candlestick pattern ka start ma jo first gap ay ga wo bhi is bull ka pressure sa he ay ga or market high ma jay ga or is gap ka bad market ma bull or bear ka jo pressure ho ga wo takreban same ho ga yani ka is ma gap ka bad kuch candle bullish ke banay ge to is ka bad kuch candle bearish ke banay ge or ya market ko high ma or lower ma la kar jay ge or huma market ka indecision ka batay ge yani ka is ma market ma bull or or bear ka jo pressure ho ga wo same ho ge or is bearish island reversal pattern ka jab second gap ay ga to ya gap market ko high sa lower ke traf reversal kara ga or ya gap huma market ka strong downward ke traf reversal ka batay ga or ya bear ka control sa bany ga or is ka bad jo market ke price ho ge is ma baer ka control ho ga or ya bear market ke price ko lower ke traf la kar jay ga. ENTRY POINT : Is pattern ma traders ko market ka lower ke traf jana ka signal mila ga magar is ma traders trade ko enter karna sa phalay is pattern ka complete hona ka wait kara ga jab is pattern ka complete hona ka bad second gap ay ga to traders is gap ka lower sa is ma sell ke trade ko enter kara ga. STOP LOSS : IS bearish island reversal pattern ma traders jo sell ke trade ko enter kara ga chart ma bearish Island reversal pattern ka opposite ke traf ho ga or ya pattern huma market ma lower ke traf dakhna ko mil jay ga or ya pattern lowera huma downtrend ke traf dakhna ko mil jay ga or ya pattern long term ma market ka downtrend ka bottom ma ban kar is downtrend ko end kar market ko upward ke traf strongly high ke traf reversal kara ga. Ya bullish island reversal candlestick pattern jab market ka chart ma banay ga to is pattern ka start ma jo market ke price ho ge wo downward ke traf strongly move karte hoi ja rahe ho ge or is pattern ke jab formation star ho ge to is ka start ma huma ak gap dakhna ko mil jay ga or ya ak lower gap ho ga jo ka market ka previous trend ko follow karte hoi banay ge or is ma jo market ke price ho ge wo lower ke traf jay ge or is pattern ma is lower gap ka bad huma kuch candles dakhna ko mila ga ge jo ka is lower ka below ma ho ge or ya candles five bhi ho sakte ha or is sa zada bhi or ya lower ma banay ge or in ma kuch candles bearish ke ho ge or kuch bullish ke ho ge or ya market ko ak flow ma aga ke traf move karte hoi la kar jay ge or is pattern ma in canldes ka bad huma ak or gap market ma dakhma ko mila ga or ya gap is pattern ka first gap ka opposite ke traf ho ga or ya second candle gap is candles ka bad ban kar market ko high ke traf reversal kara ge or market ko high ma la kar ay ge or ya gap first gap ka aga same size ka ho ga par ya market ko downtrend sa upward ke traf reversal kar raha ho ga reversal candlestick pattern market ka chart ma jab banay ga to ya traders ko market ka strongly high ke traf reversal ka batay ga or is ma traders ko signal mila ga ka market na ab or zada downward ke traf ni jana ha or market na ab sa reversal ho kar upward ke traf jana ha. Ya bullish Island reversal pattern kab banay ga to is pattern ka bannay sa phaky market ma bear ka control ho ga or ya bear market ko strongly lower ke traf la kar ja raha jo ga or ya bear is time market ma ak strong downtrend ko bana raha jo ga or is pattern ma jo first lower gap ay ga wo bhi is bear ke waja sa ay ga or is ma market ke price lower ma jay ge or is pattern ka is gap ka bad jo kuch candle huma dakhna ko mil jay ge to ya bullish ke bhi ho ge or bearish ke bhi or ya market ko zada low ma ni kal jay ge or market ko ak he position ma move karay ge or ya huma batay ge ka market ma bull or bear ka jo control ha wo same ha or is ma market ka bear or bull ka jo pressure hota ha wo same hota ha ir is time market indecision ka bata rahe hote ha or is ka bad market ma jab second gap ay ga to ya ak up gap ho ga or ya market ko high ke traf reversal karna ka kam kara ga or is gap ka bad traders ko market ka upward ke traf jana ka signal mila ga. ENTRY POINT : Is bullish Island reversal pattern ma traders ko market ka high ke traf jan ka signal mila ga or traders is pattern ka second gap ka bad jo first candle banay ge os sa is ma buy ke trade ko enter kar ga. STOP LOSS : Bullish Island reversal pattern ma traders jo buy ke trade ko enter kara ga andlesticks pae mabni hota hai. En candles k both sides pae gap banty hain, yeh dono gaps ik dosray k opposite hony chahe ta k candlesticks har bar alag island ma nazar aye, Island patterns ki two types hain. Firstly island top, jab pattern price action sy uper gap bana kar move kar jae to island top banta hai. Second jab pattern price action sy nechy gap bana kar move kar jae to usy island bottom kaha jata hay, is pattern ka minimum target esk size k baraber hota hay, Trade main enter hony k bad stop loss ko island pattern k nechy set karna chaiay, jab three opposite candles ban jaen to target ko mazeed extend kiya ja sakta hay pattern few candlesticks pbahot kam creat hota hai ky market kuch time ky liay normal movement ko chor ker bary gap ky sath open hoti hai aur kuch time ky bahd again gap ky sath apni previous position sy ja ker open hoti hai aur normal movement ko continue ker leti hai lekin jab bhi island reversal candle dosray k opposite hony chahe ta k candlesticks har bar alag island ma nazar aye, Island patterns ki two types hain. Firstly island top, jab pattern price action sy uper gap bana kar move kar jae to island top banta hai. Second jab pattern price action sy nechy gap bana kar move kar jae to usy island bottom kaha jata hay, is pattern ka minimum target esk size k baraber hota hay, Trade main enter hony k bad stop loss ko island pattern k nechy set karna chaiay, jab three opposite candles ban jaen bullish island reversal candlestick pattern market ka chart ma jab banay ga to ya traders ko market ka strongly high ke ka bad traders ko market ka upward ke traf jana ka signal mila ga. ENTRY POINT : Is bullish Island reversal pattern ma traders ko market ka high ke traf jan ka signal mila ga or traders is pattern ka second gap ka bad jo first candle banay ge os sa is ma buy ke trade ko enter kar ga. STOP LOSS : Bullish Island reversal pattern ma traders jo buy ke trade ko enter kara ga is ka stop loss is pattern ma jo lower point banay ga os ma place kara ga Candlesticks patterns Asal Mn kuch time ky liay normally Movement ko chor ker bary Gap ky sath opening PRICE hoti hai aur kuch time ky bad against Gap ky sath apni previously positions mein sy ja ker opened lowered To hoti hai aur normally Movement ko continued ker leti hai lekin jab bhi Island Reversals Candlesticks stick Patterned creat hota hai tou Hamsun marketing ky previously normally Trends ko ko following kerna shoru ker den Gy.eversal Candlesticks Pattern marketing all time mein Hamesha samajhne ke liye use per work karte hue Trad Len Gy Tu Iss pe ka CHART ma jab banay ga to ya trader's ko marketing ka strongly high ke ka bad trader's ko marketing ka upward ke traf jana ka Signal mila ga. Island Reversals Is Bullishness Island reversal Patterned ma trader's ko marketing ka high ke traf jan ka signal mila ga or trader's is Patterned ka second gap ka bad jo First Candlestick's banay ge os sa is ma buyer's ke trader's ko enter kar ga.alternate open kerny sy pehly marketplace ky analysis kerty hain ky kis path important open ki jany wali trade main hamain earnings hasil ho sakta hai aur konsi exchange open kerny per hamain loss ho sakta hai forex marketplace ki movement ko choose kerny ky liay differing types ky analysis kiay jaty hain jin foremost technical evaluation fundamental evaluation aur sentimental evaluation shamil hain lekin ham yahan consistent with technical analysis ko speak kerny ja rehy hain ky ham market ki previous motion ky hisab sy market ki motion ki course aur tiers ko marketplace hamesha technical evaluation ko comply with kerty huey apni movement preserve kerti hai so hamain agar sirf aik hi analysis kerny hon tou sab sy pehly hamain technical evaluation kerny chahiay jis sy hamain marketplace ky fashion aur conduct ka pata chal jaey taky ham taky hamari alternate fashion ky in opposition to open na ho kyun ky aesi open trade essential hamain loss ho sakta hai marketplace essential exchange open kerny ky liay hamesha trend ko observe kerna hota hai jabky equal trend ko observe tab hi kia ja sakta hai jab ham marketplace ky present day fashion ko locate ker lety hain jis ky liay unique tools use kiay jaty hain jin foremost aid aur resistance ranges aur excl
                      • <a href="https://www.instaforex.org/ru/?x=ruforum">InstaForex</a>
                      • #12 Collapse

                        Re: Island Reversal Candlestick pattern

                        Dear forex member umeed karta hun aap sab khairiyat se honge expensive members Forex trading me "Lot" aik standard ikaye hai, jo k dealer okay open role k volum ki measurment k leye istemal hota hai. Lot size ki calculation hazard management device okay zarye se kia jata hai. Forex trading me aik behtar buying and selling machine banane okay leye lot length k bare me information rakhna bohut zarori hai. Lots ka taluq direct hujam k sath hota hai, aur hujam ko lots me hello measure kia jata hai. Lot size hamesha danger degree ko mutasir karta hai. The Forex market buying and selling me lot length ka volum jitna ziada hoga to chance bhi us okay hisab se ziada hoga. Risk management me aik version shamil hota hai, jo dealer ko foreign exchange trading market me danger level, utaar-charo (forestall-loss aur take ery price 1.1845 ho, to aap ko 1 lot function open karne ok leye 118,450 base foreign money units chaheye hongay. Is ka matlab hai k aap ko a huergy waghera ok leye devices badal jati hai, jaise gold ko Ote hen. Yani agar EURUSD ka current rate 1.23456 ho to one standard lot size k mutabiq a hundred,000 EUR khareedne k leye 123456 USD ki zarorat paregi. Standard lot size ko mazeed chote sizes me taqseem kia jata hai, jo k mini, micro aur nano lot size ban jate chicken. The Forex market buying and selling me sab se ziada one hundred widespread lot size tak hello aik change open ki ja sakti hai.
                        Maximum lot aik transaction ok leye masses ki maximum tadad hai,
                        Misal k tawar par, five widespread masses 5 × 10 = 50 oil barrel jab k five mini lot 5 × 1 = 5 oil barrel hongay.\

                        Island Reversal Candlestick pattern

                        Mini LoAik mini lot (minilot) fashionable lot k 0.1 ya 10,000 base foreign money unit hote chicken. Mini lot length popular lot k 10% ok barabar hota hai, jis me buyers ze ka 10% jab okay preferred lot size ka 1% banta hai. Is me trader 1,000 base foreign money devices me trading kar sakta hai,is waja se is ok leye mini lot se bhi kam volum ki zarorat hoti hai.Nano LAik nano lot length (nanolot) me popular lot okay zero.001 ya 100 base currency gadgets hote hen. Nano lot length micro lot length ka 10%, mini lot length ka 1% jab okay trendy lot size ka zero.1% banta hai. Ye sab se small lot size hai, is waja se is okay leye sab se ziada kam sarmaye ki zarorat hoti hai. Nano lot siz
                         

                        اب آن لائن

                        Working...
                        X