Trend
Trend line
Supporting trendline
Resisting trendline
Breakout of trendline
dosto jb hum forex market k chart pr nzr dalen to hamen market ksi aik simt main jaty hovy nazar ati ha. Market ki movement ki simt ko market ka trend kaha jata ha.
agr market opr ki simt main jaa rhi ho musalsal to esy uptrend kaha kata ha or agr market nechy ki simt main jaa rahi ho to esy down trend kaha jata ha.
agr market opr ki simt main jaa rhi ho musalsal to esy uptrend kaha kata ha or agr market nechy ki simt main jaa rahi ho to esy down trend kaha jata ha.
Trend line
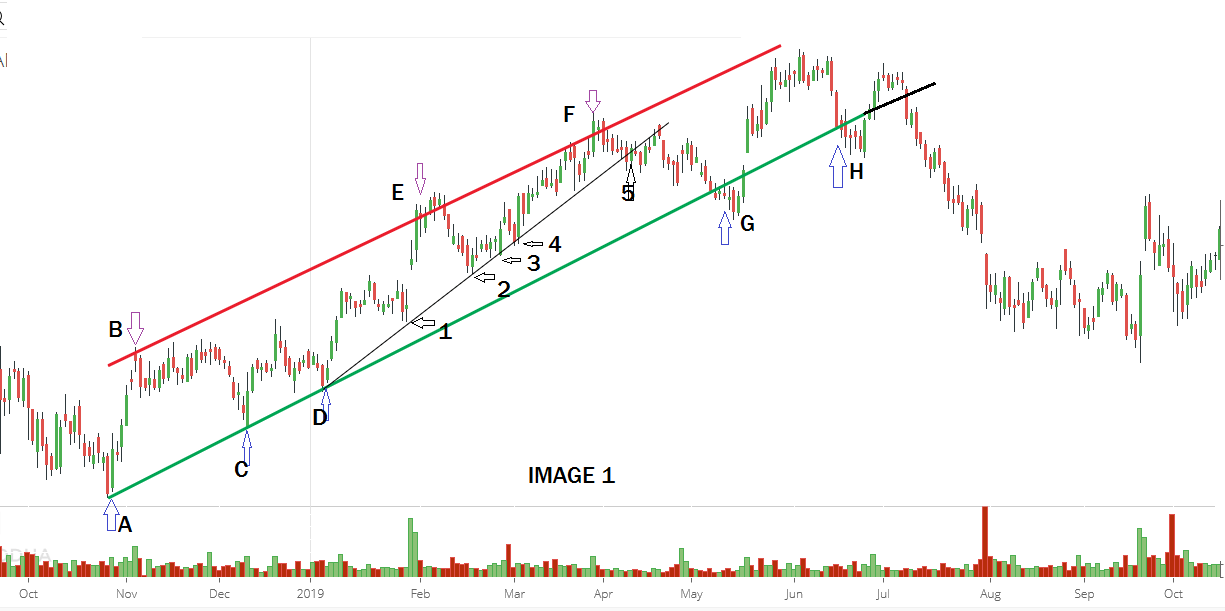
Dosto jb market ksi trend main move kar rhi ho to aksr dekha jata ha wo aik line ko follow karti ha jisy trend line kaha jata ha.
Supporting trendline
agr market up trend main ho to market higher highs or higher lows bnaty hovy opr ki trf jati ha or agr market k lows ko apas main milaya jay to aik line bnti ha jisy supporting trend line kaha jata ha.
Resisting trendline
agr market nechy ki trf jaa rhi ho to market lower highs or lower lows bnati ha or agr market k highs ko apsa main milaya jay to market k opr aik trendline bnti ha jo k resisting trendline khlati ha.esko resisting trendline es lye kaha jata ha k ye markey ko opr jany se resist karti ha.
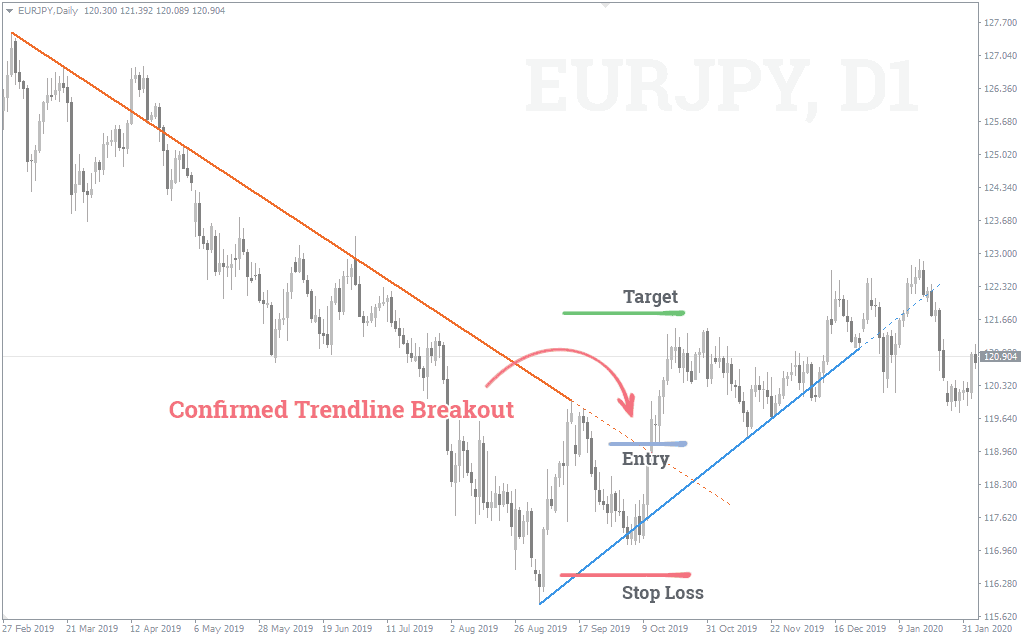
Breakout of trendline
Dosto jb market apny kisis trend ko change karti ha to market trendline ko break kr k apny previous trend se bhr nkl jati ha or esko trendline ka breakout kaha jata ha.
Jesa k agr market uptrend main ho or apni supporting trend line ko break kr nechy aa jy to ye trendline breakout ho ga or ohr es k bad trend change ho skta ha or marlet downtrend main ja skti ha.
Jesa k agr market uptrend main ho or apni supporting trend line ko break kr nechy aa jy to ye trendline breakout ho ga or ohr es k bad trend change ho skta ha or marlet downtrend main ja skti ha.

تبصرہ
Расширенный режим Обычный режим