What is three inside up and inside down candlestick pattern ?

No announcement yet.
`
X
  • وقت
  • دکھائیں
Clear All
new posts
  • #16 Collapse

    THREE INSIDE UP AND DOWN CANDLSTICK PATTERN:-
    Three Inside Down (Teen Andar Se Neeche):
    "Three Inside Down" bhi ek candlestick pattern hai jo technical analysis mein istemal hota hai, lekin yeh bearish (downward trend) reversal ko pehchane mein madad dene ke liye istemal hota hai. Is pattern mein bhi teen alag candles ki sequence hoti hai. Pehli Candle: Pehli candle ek uptrend (price barhne wala trend) ke baad ati hai aur bullish hoti hai, yani ke price barh rahi hoti hai. Doosri Candle: Doosri candle pehli candle ki andar ati hai lekin bearish hoti hai, yani ke price kam ho rahi hoti hai. Is candle ki body pehli candle ki body mein fit hoti hai. Tesri Candle: Tesri candle doosri candle ki andar ati hai aur bearish hoti hai. Is candle ki body doosri candle ki body mein fit hoti hai. Ye candle confirmation deta hai ke trend reversal ho sakta hai aur ab market ki downward movement ho sakti hai. Yeh patterns traders aur investors ko market ke price movements ke trends aur reversals ke bare mein insights dene mein madad karte hain. Lekin yaad rahe, in patterns ko confirm karne ke liye dusri technical aur fundamental analysis bhi zaroori hoti hai.
    Three Inside Up (Teen Andar Se Upar):
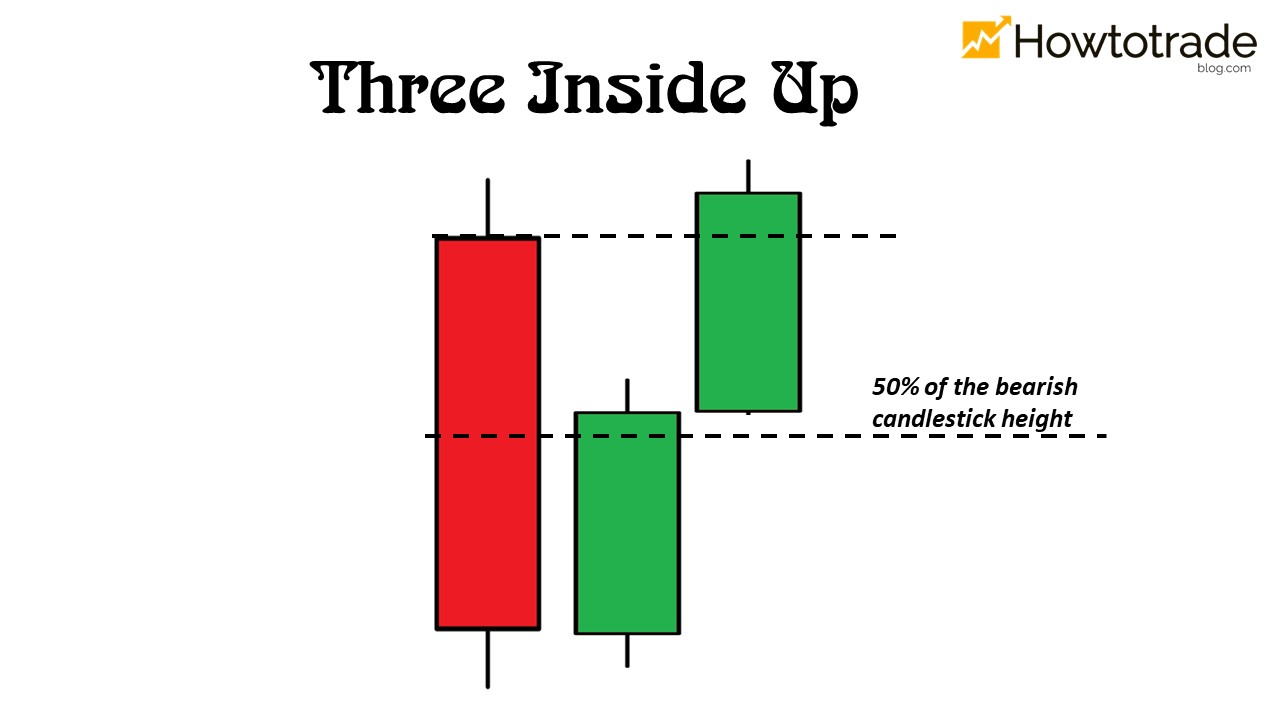
    "Three Inside Up" ek candlestick pattern hai jo technical analysis mein istemal hota hai taa ke mumkin trend reversal ko pehchane mein madad dene ke liye. Is pattern mein teen alag candles ki sequence hoti hai. Pehli Candle: Pehli candle ek downtrend (price girne wala trend) ke baad ati hai aur bearish hoti hai, yani ke price kam ho rahi hoti hai. Doosri Candle: Doosri candle pehli candle ki andar ati hai lekin bullish hoti hai, yani ke price barh rahi hoti hai. Is candle ki body pehli candle ki body mein fit hoti hai. Tesri Candle: Tesri candle doosri candle ki andar ati hai aur bullish hoti hai. Is candle ki body doosri candle ki body mein fit hoti hai. Ye candle confirmation deti hai ke trend reversal mumkin hai aur ab market ki upward movement ho sakti hai.
    • <a href="https://www.instaforex.org/ru/?x=ruforum">InstaForex</a>
    • #17 Collapse

      three indside up, jaisa ke nechy trading chart mein dekhaya gaya hai, neechay ke rujhan ke douran zahir hota hai, aur pehli candle aik lambi surkh rang ki hai, is ke baad aik choti si sabz candle hoti hai jo pichlle red body ki had ke andar ghonslay gi. aakhri candle aik lambi sabz hai jo pichlle chhootey sabz ke qareeb ke qareeb se oopar ki taraf dhkilti hai .bears ne qeematon mein kami ko mazbooti se pakar liya hai aur aik lambi surkh candle bananay ke liye qeematon ko neechay dhakel diya hai. lekin aglay session mein, bail mazeed bakwaas ke liye kharray nahi hon ge, aur saabit qadam rahen ge – reechh market ko mazeed neechay laane se qassar hain, aur belon ne aik chhota sa faida uthaya hai ( darmiyan mein choti sabz candle ). ghosla session bulls is faiday ko mazboot karte hain, bears ko gole karte hain aur trend badal jata hai . Candlestick's PATTERNS kyun 3 inner up and inner down candlestick kay aglay consultation mein bears aik chhotey sa faida uthany ke waybill ho jatay hain - Darmian mein choti surkh mother national robotically generated ho Jaye Gi th ESS Bears ki hosla afzai ki jati hai, aur aglay (Next Inside down Candles) Ka Sath Sath hello possible sessions mein mein, woh ghar ke faiday 3 inside up and internal down candlestick pattern ko Shayd Changes berhate hain aur qeemat ko pichla Smaller Say Hi Trad Faida Gain De Gii Aor jab ham CHART mein dekhaya gaya hai, Neechy ke rujhan ke douran zahir hota hai, aur pehli Candlestick's Patterned aik lambi surkh rang ki hai, is ke baad aik Choto si sabz Candlesticks hoti hai jo pichlle red frame ki had ke Ansari ghonslay gi. Aakhri Candlesticks patterns and Candlestick's CHART aik lambi sabz hai jo pichlle chhotey sabz ke ke qareeb se polar up stage Inside Up Ho Hoti Hy Ess ki taraf dhkilti hai .Bears ne qeemat on mein kami ko mazbooti se pakar liya hai aur aik lambing (longer) surkh Candlestick's banay gii. Candles designs Express three inside up and inside down candle design hoti hai jo pichla red body's ki had ke Ansari Nagar say Hello Trad Len Gy. aakhri Candles last aik lambing longer situated sabz hai jo pichla more modest Candles sabz ke qareeb ke qareeb se oopar ki taraf dhkilti hai.bears ne qeemat mein kami ko unequivocally se pakar liya hai aur aik lambing longer surkh Candles bananay ke liye qeemat ko neechay Shakeel diya hai Dear Government Open Market Warning gathering (FOMC) dar asal ye ik national bank system ki branch hai jo cash related game plan ki bearing ko choose karti hai or ye esko expressly open market ki course ko direct karny k lae use karti hai. Fomc board or governer sy mel kar banta hai jis k 7 section hain or 5 president hai national bank k yani esk hard and fast 12 section hoty hain. Har sal es leading body of legal administrators ki 8 secret get-togethers hoti hain or en mom monetary course of action standard discussion ki jati hai. What is three inside up and inside down candle design ?candlestick pattern jab market ka chart ma banay ga to ya pattern traders ko market ka strongly downward ke traf jana ka batay ga. Ya three inside down candlestick pattern jab market ka chart ma banay ga to is pattern ka start hona sa phalay market ma bull ka control ho ga or ya bull market ko ak high pressure sa upward ke traf la kar ja raha ho ga or is pattern ke jo first candle ha wo bhi market ma is bull ka pressure sa banay ge or is ma jo market ke price ho ge wo sharply high ke traf jay ge or high ma jab jay ge to is three inside down candlestick pattern ke second candle is high sa open ho ge or ya second candel jasa he banay ge to ya market ka bull ka control ko lost kar da ge or market ma bear ka control a jay ga or ya bear market ko high sa lower ke traf reversal kar da or market downward ke traf ay ge or traders ko market ke price ka lower ke traf jana ka ak strong signal mila ga magar is ma traders last third candle ka close hona ka wait kara ga q ka ya third candle is pattern ke conformation karte ha ya third candle bhi is pattern ke market ma bear ka pressure sa banay ge or is ma market ke price lower ke traf reversal ho ge or ya huma batay ge ka market na downward ke traf jana ha or traders is pattern ma sell ke trade ko enter kara ga is pattern ke last third candle ka lower sa or traders is sell ke trade ka jo stop loss ho ga os ko is pattern ke first candle ka high ma place kara ga. DIFFERENT BETWEEN INSIDE UP AND INSIDE DOWN CANDLESTICK PATTERN : Ager Outline STRADGY Say Hey Three Inside down Candles mein dekhaya Gaya aik up coach ke Sourabh zahir hota hai. pehli Candle's aik lambing Greene hai, is ke baare aik choti red Candles hai jisay pichla green body ki had ke andar Ansari ghons a Chaheye. aakhri Candles designs last Greetings Customizable Ho Gi Tu aik lambing longer red hai jo pichla chhotey red ke Warren ke Neechy dhkelti hai Tu ESS taraf taizi ke jazbaat basic encouragement ghalib hain aur Khtra apne kid around mein aik lambing sabz mother batii banday Eliminate tint beh jatay get entrance Hein. lekin is se un ki taaqat khatam ho sakti hai Tu Inside down Candles ho jay Gii.....mein dekhaya gaya hai, neechay ke rujhan ke douran zahir hota hai, aur pehli candle aik lambi surkh rang ki hai, is ke baad aik choti si sabz candle hoti hai jo pichlle red body ki had ke andar ghonslay gi. aakhri candle aik lambi sabz hai jo pichlle chhootey sabz ke qareeb ke qareeb se oopar ki taraf dhkilti hai .bears ne qeematon mein kami ko mazbooti se pakar liya hai aur aik lambi surkh candle bananay ke liye qeematon ko neechay dhakel diya hai. lekin aglay session mein, bail mazeed bakwaas ke liye kharray nahi hon ge, aur saabit qadam rahen ge – reechh market ko mazeed neechay laane se qassar hain, aur belon ne aik chhota sa faida uthaya hai ( darmiyan mein ch tooti sabz candle ). ghosla session bulls is faiday ko mazboot karte hain, bears ko gole karte hain aur trend badal jata hai .candle ko engulfing kara ge yani ka jo is pattern ke first candlr ho ge wo 2nd candle ke full real frame ka under banay ge.
      • <a href="https://www.instaforex.org/ru/?x=ruforum">InstaForex</a>
      • #18 Collapse

        The "Three Inside Up" and "Three Inside Down" are both candlestick patterns used in technical analysis of financial markets, particularly in the context of trading stocks, forex, and other assets. These patterns are used to identify potential trend reversals or continuations. Let's look at each pattern individually: Three Inside Up: The "Three Inside Up" pattern is a bullish reversal pattern that consists of three consecutive candlesticks. Here's how it works: The first candlestick is a bearish (down) candlestick, indicating that the market is currently in a downtrend. The second candlestick is a smaller bullish (up) candlestick that is completely engulfed within the range of the first candlestick. This suggests a potential shift in momentum as the bulls start to push prices higher. The third candlestick is a larger bullish candlestick that completely engulfs the range of the second candlestick and closes higher than the high of the first candlestick. This confirms the bullish reversal and suggests that the uptrend might continue. The Three Inside Up pattern suggests that the bears are losing control, and the bulls are taking over, potentially leading to a trend reversal from bearish to bullish. Three Inside Down: The "Three Inside Down" pattern is its bearish counterpart and is used to identify potential bearish reversals: The first candlestick is a bullish (up) candlestick, indicating that the market is currently in an uptrend. The second candlestick is a smaller bearish (down) candlestick that is completely engulfed within the range of the first candlestick. This hints at a potential shift in momentum as the bears start to exert pressure. The third candlestick is a larger bearish candlestick that engulfs the range of the second candlestick and closes lower than the low of the first candlestick. This confirms the bearish reversal and suggests a potential trend change from bullish to bearish. The Three Inside Down pattern suggests that the bulls are losing control, and the bears might be gaining dominance, potentially leading to a trend reversal from bullish to bearish. Both of these patterns are considered significant when they occur after a sustained trend, indicating a potential change in market sentiment. However, like any technical analysis tool, these patterns should not be relied upon solely and should be used in conjunction with other indicators and analysis methods to make informed trading decisions. It's important to note that the effectiveness of these patterns can vary, and traders should use proper risk management strategies when implementing them in their trading activities

        اب آن لائن

        Working...
        X