Bullish and Bearish Hook Candlestick Pattern Uses and Detail Information.....
X
  • وقت
  • دکھائیں
Clear All
new posts
  • #1 Collapse

    Bullish and Bearish Hook Candlestick Pattern Uses and Detail Information.....
    Aslam u alaikum,

    Dear forex member umeed karta hun aap sab khairiyat se honge dear members forex trading ma different types k pattern hoty hain or ye trader k lae helpful hoty hain. Agr trader enki information sy trade ko open kar ley to wo achy andaz sy predict kar sakta hai. Es topic ma ham asy he ik pattern ko discuss karny ja rahy hain.


    J hook pattern.

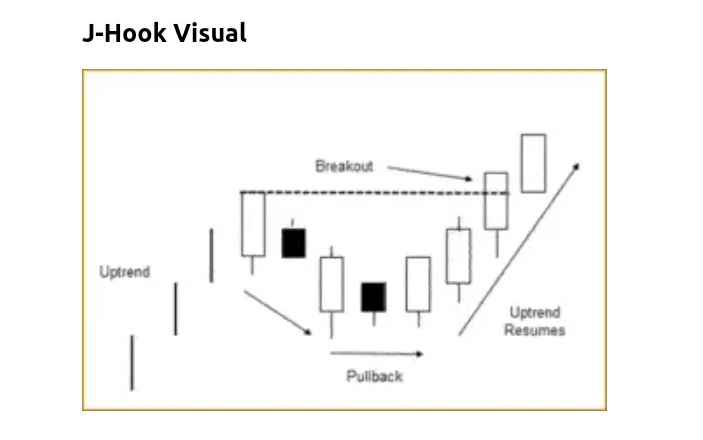
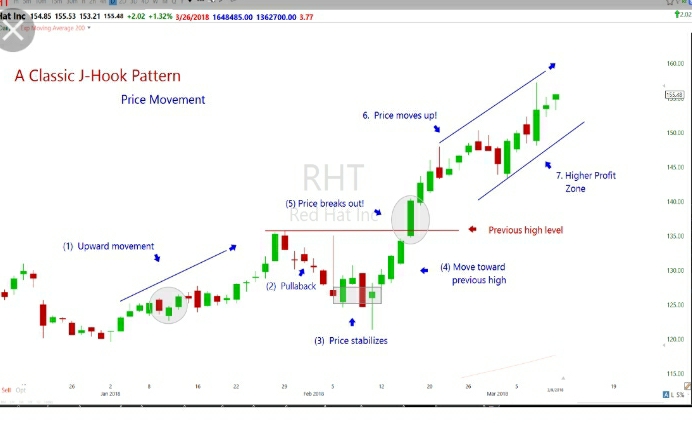
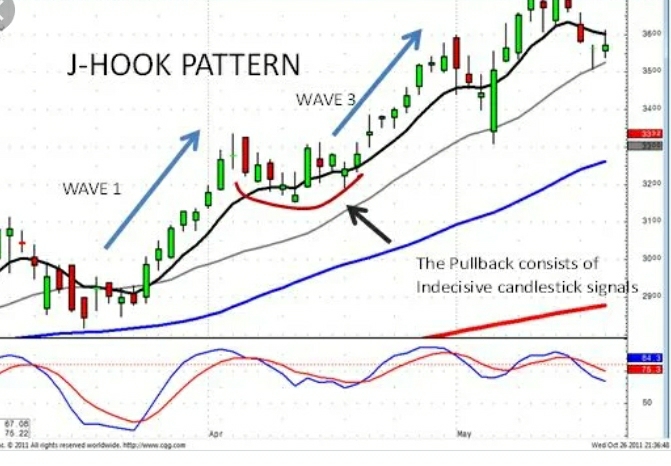
    Forex chart ma j hook pattern ko spot karna bhot easy hoya hai kiu k ye english Alphbet J ki tarha chart ma appear hota hai. Ye pattern up trending ka part hai or tora dip face karta or phr apna trend resume kar leta hai. Es pattern ki key ye hai k trader ko 4th or 3rd candlesticks ko nazar ma rakhna hota hai jo market ma lower high form karti hain or ye j hook pattern ki beginning ho sakti hai. Now price down move karna stop kar deti hai or side way move karna start kar deti hai. Es k bad market ki price higher move karna start kar deti hai. Or ye trader ko oppertunity farham karti hai k wo buy ki trade ko open kar sakta hai.


    Uses of j hook pattern.

    Es pattern ma market price pehle up trend ma move kar rahi hoti hai. Phr ye kuch time k lae down trend ma move karti hai or higher low form karti hai or phr ye apna trend resume kar leti hai. Es pattern ka main use ye hai k ye trader ko achy trade karny k mokay farham karta hai. Trader es ko agr start ma predict kar leyn to wo long trade ma acha profit hasil kar sakty hain. Unko chahe k pehle wo market ka wait karyn or confirmation k bad market ma in or small lot k sath buy ki trade ko open karyn.


    Inverted j hook pattern and its uses.

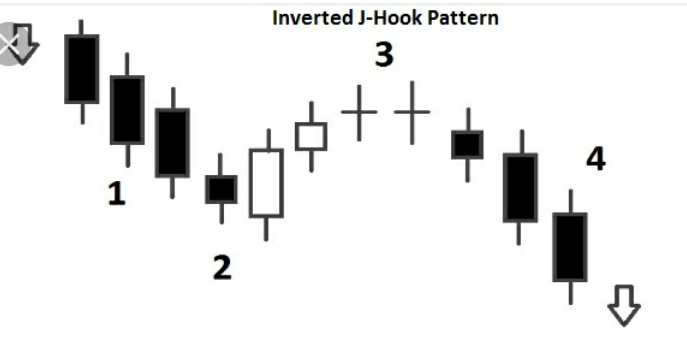
    Inverted j hook pattern j hook pattern k ulat form hota hai es ma pehle market ma down trend hota hai or phr market kuch time k lae up trend ma wapas jati hai or kuch lower high form karti hai. Es k bad market wapas apny down trend ma chali jati hai or trader es time par jb market kuch dair side movement ma hoti hai apni trades ko open karyn to wo acha advantage hasil kar sakty hain or es pattern ma trader sell ki trade sy acha profit hasil kar sakty hain.

    Ap Ka aik thanks bohat zrori ha
  • <a href="https://www.instaforex.org/ru/?x=ruforum">InstaForex</a>
  • #2 Collapse

    Re: Bullish and Bearish Hook Candlestick Pattern Uses and Detail Information.....

    Assalamu alaikum expensive forex buddies ummid karti hun ki aap sab khairiyat se honge aur foreign exchange marketplace mein acchi working pleasant ki base in step with achcha income hasil kar rahe honge. Dear pals jab hum for ex buying and selling business business enterprise mein kam karte hain to jo chizen hamen marketplace ko samajhne mein madad deti hain unmen candlesticks pattern ke bare mein entire information aur information hamen bahut jyada madad deta hai aaj ham baat karenge net line ke naked mein aur essential ummid karti hun ki meri yah from karda information aapko is pattern ko samajhne aur isko apni working mein incluid karne mein bahut jyada assist out karegi. What is neckline? Dear friends for ex buying and selling industrial company mein candlestick pattern mein jab ham baat karte hain head and shoulder sample ki to neckline head and shoulder pattern mein game yaar resistance stage hota hai aur is stage ke get away hone se aap foreign exchange marketplace mein apni koi bhi trade open kar sakte hain. Call: dotdash-inv-very last-neckline-mar-2021-01-2189437539844c5194af3863cb8b3c4a.

    Identity of neckline:

    costly buddies neckline ko hidden shoulder pattern mein find out karna bahut aasan hota hai isko aap do hisson mein divide kar sakte hain aur iski identity is tarah bahut easy ho jati hai aur iski in addition clarification ke liye aapko head and shoulder pattern ke bare mein entire records aur statistics bhi samajhne mein madad deta hai.

    Neckline in head and shoulder pattern:

    expensive buddies forex buying and promoting business corporation mein head and shoulder sample ko jab aap test karte hain to ismein aapko donon shoulders ki above thing in line with ek resistance najar aati hai jisko aap nek line kah sakte hain essentially yah bhi ek robust stage hota hai jo ki aapko yah indication deta hai ki is level ko marketplace contact karke dobara rebounce ho sakti hai ya fir is stage ke break out hone in step with aapko market mein acchi get right of entry to mil sakti hai aur aap achcha income le sakte hain.

    Explanation:

    highly-priced pals jab aap inverted head and shoulder sample ko chart mein outline karna chahte hain to aapko isiliye internet line ko discover kar sakte hain area of interest chart mein aap effects neckline ko pick out kar sakte hain. Pricey neckline ek aisa location hota hai jahan in step with dealer apni buying and selling strategies ke liye order region kar sakte hain.
    • #3 Collapse

      جواب: Bullish and Bearish Hook Candlestick Pattern Uses and Detail Information.....

      When we communicate about buying and selling, we frequently use the expressions “long” and “brief” to classify two varieties of trades. I explain what this indicates under. It can be perplexing to understand exactly what those phrases imply, so in this newsletter, I’m going to explain the whole lot you ever desired to understand approximately what “lengthy” and “brief” trading way. Everything you ever desired to recognise about lengthy and brief trades but were afraid to invite… that’s the long and the short of it! No extra jokes, I promise.
      The Difference Between Long and Short Trades
      The most effective manner to explain “lengthy” and “quick” trades is to mention that during any exchange, you are lengthy of that from which you will earnings if it rises in relative price, and short of that from which you will profit if it falls in relative cost.
      Long vs Short Position
      For instance, permit’s say that you buy a stock of ABC Inc. With U.S. Bucks. It can now be stated which you are “lengthy” stock of ABC Inc. And “quick” of U.S. Dollars. This is because for you to income, the cost of the ABC Inc. Inventory need to rise against U.S. Greenbacks, or as a substitute, the price of the U.S. Dollar ought to fall against the stock of ABC Inc.
      In a exchange in which you are short of a forex towards some tangible asset, you would usually talk to that simplest as a “lengthy” change, and now not say that you were “quick” of the cash denomination. I will speak extra about that later.
      Another manner to recognize the difference between lengthy and short trades is that if you make a alternate wherein you need the fee to rise in a chart, you are lengthy of that tool. If you need the price to fall in a chart, you are short of that device.
      What, then, is a actual “short” alternate?
      The Short Trade
      From the time of the Bretton Woods Agreements quickly after the give up of the Second World War until 1971, the cost of the U.S. Dollar changed into described as $35 in line with ounce of gold, and therefore efficaciously the “charge” of the dollar changed into the same as the charge of gold. Most important financial powers agreed to restoration the price in their very own currency to that of the dollar. In 1971 the U.S. Started out a sequence of devaluations of the greenback in comparison to the price of gold, before sooner or later abandoning all linkage between the dollar and gold in 1976.
      For this cause, there was little or no the Forex market buying and selling earlier than the Nineteen Seventies. Speculative traders rather centered on stocks and commodities. Traders may want to make money via shopping for commodities and shares cheaply then selling them at a better fee. However, as buyers desired to find a way to profit after they concept that fees were about to fall however didn’t already personal any stocks or commodities to promote, the practice of going “brief” arose. Traders might pass brief of shares or commodities by way of borrowing the stocks or commodities, after which selling them, earlier than shopping for them again later at a with any luck cheaper price. The stocks or commodities ought to then be lower back to the loaner, and a income taken from the distinction among the original sale rate and the buy-returned rate. Short dealers might should pay interest on any money borrowed first of all that was needed to buy the shares or commodities to be sold.
      Therefore, going quick might be very distinctive to going long. It should also be cited that shares and commodities –specially shares – have a tendency to have a “lengthy bias”, meaning that their price is much more likely to upward push over the years than fall. Falls in stock markets, or “endure m When we speak approximately trading, we often use the expressions “long” and “brief” to classify styles of trades. I provide an explanation for what this indicates underneath. It may be perplexing to understand exactly what those terms mean, so in this newsletter, I’m going to explain everything you ever desired to recognise about what “long” and “quick” trading manner. Everything you ever desired to understand about long and brief trades however had been afraid to ask… that’s the lengthy and the quick of it! No more jokes, I promise.


      The Difference Between Long and Short Trades
      The best way to provide an explanation for “long” and “quick” trades is to mention that during any exchange, you're lengthy of that from which you'll income if it rises in relative value, and brief of that from which you will profit if it falls in relative fee.

      Long vs Short Position
      For instance, allow’s say which you buy a stock of ABC Inc. With U.S. Dollars. It can now be stated that you are “lengthy” inventory of ABC Inc. And “quick” of U.S. Dollars. This is due to the fact so one can earnings, the value of the ABC Inc. Inventory need to rise against U.S. Bucks, or instead, the price of the U.S. Dollar must fall in opposition to the inventory of ABC Inc.

      In a exchange wherein you're quick of a currency in opposition to some tangible asset, you'll normally discuss with that handiest as a “long” alternate, and now not say that you were “short” of the cash denomination. I will talk extra approximately that later.

      Another manner to apprehend the distinction between lengthy and quick trades is that in case you make a change where you need the fee to upward push in a chart, you are long of that tool. If you want the fee to fall in a chart, you're short of that tool.

      What, then, is a actual “short” trade?

      The Short Trade
      From the time of the Bretton Woods Agreements quickly after the end of the Second World War till 1971, the price of the U.S. Dollar turned into described as $35 in line with ounce of gold, and therefore effectively the “charge” of the dollar changed into the same as the fee of gold. Most fundamental economic powers agreed to fix the value of their personal currency to that of the dollar. In 1971 the U.S. Started out a series of devaluations of the dollar in comparison to the rate of gold, earlier than ultimately forsaking all linkage among the dollar and gold in 1976.

      For this motive, there was very little the Forex market trading before the Seventies. Speculative investors instead targeted on stocks and commodities. Traders should make cash by means of buying commodities and stocks cost effectively then promoting them at a higher fee. However, as investors desired to discover a manner to profit once they idea that charges have been approximately to fall however didn’t already own any stocks or commodities to promote, the exercise of going “brief” arose. Traders would go quick of stocks or commodities by using borrowing the stocks or commodities, after which selling them, earlier than shopping for them again later at a optimistically cheaper fee. The shares or commodities should then be again to the loaner, and a profit taken from the difference between the original sale price and the purchase-returned price. Short sellers could need to pay interest on any money borrowed first of all that turned into needed to purchase the shares or commodities to be bought.

      Therefore, going short may be very special to going long. It ought to additionally be mentioned that shares and commodities –mainly shares – generally tend to have a “lengthy bias”, meaning that their price is more likely to rise over the years than fall. Falls in stock markets, or “undergo markets” as they are frequently known as, have a tendency to occur greater speedy and violently than growing markets (“bull markets”). This is probably at least partly because if you promote stocks that you have borrowed money to pay for, you're more likely to panic if the change starts offevolved shifting in opposition to you, than in case you very own shares whilst the price is falling.Arkets” as they're regularly called, generally tend to take place extra quick and violently than growing markets (“bull markets”). This is probably as a minimum partially because in case you promote shares which you have borrowed cash to pay for, you are more likely to panic if the trade starts offevolved shifting in opposition to you, than in case you very own shares at the same time as the rate is falling.


      • #4 Collapse

        Re: Bullish and Bearish Hook Candlestick Pattern Uses and Detail Information.....

        WHAT IS A HOOK REVERSAL CANDLESTICKS PATTERN :


        Hook ak reversal candlestick pattern ha or ya hook reversal pattern ak strong reversal candlestick pattern hota ha or ya hook pattern market ko strong reversal kar data ha is ma market ka reversal current trend ka opposite ke traf hota ha yani ka jab ya hook reversal pattern market ka chart ma uptrend ke traf banay ga to is ma market ke price uptrend sa downtrend ke traf reversal ho ge or jab ya hook reversal pattern market ma downtrend ma banay ga to is ma market ke price downtrend sa uptrend ke traf strongly reversal ho jay ge. Ya hook reversal pattern market ka chart ma do candles sa mil kar banay ga or ya hook reversal pattern huma market ma uptrend ka top ma ya downtrend ka bottom ma dakhna ko mil jay ga or is ma market ke price sharply reversal ho ge or ya hook pattern traders ko ak strong signal da ga. Ya hook pattern huma support or resistance level par dakhna ko mil jata ha yani ka jo is hook pattern ke do candles hote ha wo agar support ya resistance level ka near ma ho ge to is time market ma huma ak strong or long term movement dakhna ko mila ge or ya movement market ma current trend ka opposite ke traf ho ge. Ya hook reversal candlestick pattern market ka chart ma fo trha sa banta ha yani ka is hook reversal pattern ke do types hote ha is hook reversal pattern ke ak type bullish hook reversal hote ha or dosre bearish hook reversal hote ha or ya dono hook reversal pattern ke types ak dosra ka opposite ma hote ha magar ya dono market ka trend ko reversal karna ka kam karte ha ak ma market reverse ho kar high sa low ma ate ha kr dosra ma market ke price downtrend sa reverse ho kar high ke traf jate ha.


        TYPES OF HOOK REVERSAL CANDLESTICK PATTERN :


        1: BEARISH HOOK REVERSAL CANDLESTICKS PATTERN :


        Bearish Hook reversal candlestick pattern huma market ma uptrend ma dakhna ko mil jata ha or ya bearish hook reversal pattern market ma price chart ma banay ga or ya bearish hook reversal price chart ma uptrend ka top ma banay ga or ya bearish hook reversal pattern market ka top ma do candle sa mil kar banay ga or ya bearish hook reversal pattern huma market ka uptrend sa downtrend ke traf strongly reversal ka batay ga. Ya bearish hook reversal pattern two candle candlestick sa mil kar banay ga or is pattern ka bearish hook reversal pattern ka bannay sa phalay market ma jo trend chal raha ho ga wo uptrend ho ga or is pattern ke jo first candle banay ge wo ak bullish ke cabdle ho ge jo ka market ka previous uptrend ko follow karte hoi banay ge or ya market ke price ko low sa high ke traf la kar jana ka batay ge or is bearish hook reversal pattern ke jo ya first candle ho ge wo ak longvreal body candle ho ge jo ka green ya white colour ke ho ge or ya bullish ke candle huma market ka buy ka traders ka bata rahe ho ge or is bearish hook reversal pattern ke ya furst candlr high ma close ho ge or is bearish hook reversal pattern ke jo second candle ho ge wo ak reversal candle ho ge or ya is pattern ke first candle ka closing point sa open ho ge or ya market ko high sa low ke traf reversal kar ka lay ge magar ya second candle ho ge is bearish hook reversal pattern ke wo first candle sa market ko lower ma ni la a saka ge or is pr) bearish hook reversal pattern ke jo second candle ho ge wo ak long real body bearish ke candle ho ge or ya huma market ka strong reversal ka batay ge or is second candle ka colour red ya black ho ga.


        TRADING WITH BEARISH HOOK REVERSAL CANDLESTICKS PATTERN :


        Jab market ma bearish hook reversal candlestick pattern banay ga to is time market ma bull ka control ho ga or ya bull market ke price ko high pressure sa up ke traf la kar ja raha ho ga or is bearish hook reversal pattern ke jo ya first candle banay ge wo market ma bull ka pressure sa banay ge or is ma market ke price high ke traf jay ge or market ka top ma ak new high point ko banay ge or jab is pattern ke second candle open ho ge to wo market ma jo bull ka control ho ga wo lost ho jay ga or market ma bear ka control a jay ga or ya bear market ke price ko high sa lower ke traf reversal kar ka la ay ga yani ka is ma market ke price high sa low ke traf ana lag jay ge or ya bearish hook reversal pattern traders ko market ka strongly downward ke traf jana ka batay ge. ENTRY POINT : Is bearish hook reversal candlestick pattern ma traders ko market ka lower ke traf ana ka signal mila ga magar is bearish hook reversal pattern ma traders trade ko enter karna sa phalay is conformation kara ga is pattern ke conformation ka liya traders is bearish hook reversal pattern ka complete hona ka bad jo next candle ka close hona ka wait kara ga jab is pattern ka bad next candle lower ma close ho ge to is pattern ke conformation ho jay ge or traders is bearish hook reversal pattern ka bad jo next candle banay ge is ka lower sa sell ke trade ko enter kara ga. STOP LOSS : Bearish Hook reversal pattern ma traders jo trad enter jara ga os ka jo stop loss ho ga wo is pattern ka high ma place kara ga is ma jo high point ho ga wo is bearish hook reversal pattern ke dono candle ka jo high point ho ga os ma stop loss ko place kara ga.


        2: BULLISH HOOK REVERSAL CANDLESTICKS PATTERN :


        Ya bullish hook reversal candlestick pattern bearish hook reversal candlestick pattern ka opposite ma ho ga yani ka ya bullish hook reversal pattern market ka chart ma downtrend ma banay ga or ya bullish hook reversal pattern market ma downtrend ka bottom ma banay ga or ya bullish hook reversal pattern market ma downtrend ma ban kar market ka uptrend ke traf reversal ka batay ga. Ya bearish hook reversal candlestick pattern bhi market ka chart ma do candles sa mil kar banay ga is bearish hook reversal pattern ka market ka chart ma bannay sa phalay market downward ke traf ja rahe ho ge or is pattern ke jo first candle banay ge wo bhi bearish ke banay ge yani ka is bullish hook reversal candlestick pattern ma jo first candle ho ga os kr price high sa low ke traf jay ge or is bullish hook reversal pattern ke jo first candle bnay ge ya ak long real body candle ho ge or is ka jo colour ho ga wo black ya red ho ga or ya furst candle bullish hook reversal ke huma market ka bearish ka pressure ka batay ge or is first candle ka lower ke traf koi long shadow ni ho ga magar is ka high ke traf ho sakta ha long shadow or is bullish hook reversal pattern ke jo ya second candle banay ge wo ak reversal candle ho ge or ya market ko downtrend sa uptrend ke traf reversal karna ka kam kara ge ya second candel bhi ak long real body ho ge or ya first bearish candle ka closing point sa open ho ge or ak bullish ke candle ko banate hoi high ke traf ay ge bullish ma close hoi ge or traders ko market ka upward ke traf jana ka batay ge.


        TRADING WITH BULLISH HOOK REVERSAL CANDLESTICKS PATTERN :


        Bullish Hook Reversal Candlestick Pattern ma traders ko market ka downtrend sa reversal ho kar market ke price ka upward ke traf jana ka signal mila ga jab ya bullish hook reversal candlestick pattern banaya ga to is bullish hook reversal pattern ka bannay sa phalay market ka bear ka control ho ga or ya bear market ke price ko lower ke traf la kar ja raha ho ga or market ke price bear ma move karte hoi lower ma jay ge or is pattern ke jo first candle banay ge wo bhi is bear ka pressure ke waja sa lower ke traf jay ge or market ma ak new lower point ko banay ge or is bullish hook reversal pattern ke jab second candle banay ge to ya ak reversal candle ho ge or ya bear ka control ko lost kar da ge or ya market ma bull ka pressure ko banay ge or market is bull ka control ke waja sa lower sa high ke traf jay ge or traders ko ak strong buy ka signal da ge. ENTRY POINT : Is bullish hook reversal candlestick pattern ma traders ko market ka up ke traf jana ka signal mila ga is ma traders buy ke trade ko enter kara ga is pattern ko confirm karna ka bad ka is pattern ma market ke price na high ma jana ha is bullish hook reversal pattern ka bad jab next candle bullish ke banay ge to is pattern ke conformation ho jay ge or traders is pattern ka bad jo next candle ho ge is ka high sa is ma buy ke trade ko enter kara ga or ya ak long term buy ke trade ho ge. STOP LOSS : Bullish Hook Reversal pattern ma traders jo buy ke trade ko enter kara ga is trade ka jo stop loss ho ga os ko traders is pattern ke jo first candle banay ge os ka lower ma place kara ga or ya lower point is bullish hook reversal pattern ka lower point ho ga.
        • <a href="https://www.instaforex.org/ru/?x=ruforum">InstaForex</a>
        • #5 Collapse

          Re: Bullish and Bearish Hook Candlestick Pattern Uses and Detail Information.....

          WHAT IS A Snare Inversion Candles Example :

          Snare ak inversion candle design ha or ya snare inversion design areas of strength for ak candle design hota ha or ya snare design market serious areas of strength for ko kar information ha is mama market ka inversion latest thing ka inverse ke traf hota ha yani ka hit ya snare inversion design market ka graph mama upturn ke traf banay ga to is mama market ke cost upswing sa downtrend ke traf inversion ho ge or punch ya snare inversion design market mama downtrend mama banay ga to is mama market ke cost downtrend sa upswing ke traf emphatically inversion ho jay ge. Ya snare inversion design market ka diagram mama do candles sa mil kar banay ga or ya snare inversion design huma market mama upturn ka top mama ya downtrend ka base mama dakhna ko mil jay ga or is mama market ke cost forcefully inversion ho ge or ya snare design merchants ko ak solid sign da ga. Ya snare design huma backing or obstruction level standard dakhna ko mil jata ha yani ka jo is snare design ke do candles hote ha wo agar support ya opposition level ka close to mama ho ge to is time market mama huma ak solid or long haul development dakhna ko mila ge or ya development market mama latest thing ka inverse ke traf ho ge. Ya snare inversion candle design market ka graph mama fo trha sa banta ha yani ka is snare inversion design ke do types hote ha is snare inversion design ke ak type bullish snare inversion hote ha or dosre negative snare inversion hote ha or ya dono snare inversion design ke types ak dosra ka inverse mama hote ha magar ya dono market ka pattern ko inversion karna ka kam karte ha ak mama market invert ho kar high sa low mama ate ha kr dosra mama market ke cost downtrend sa turn around ho kar high ke traf jate ha.

          Kinds OF Snare Inversion Candle Example :


          1: Negative Snare Inversion Candles Example :

          Negative Snare inversion candle design huma market mama upturn mama dakhna ko mil jata ha or ya negative snare inversion design market mama cost graph mama banay ga or ya negative snare inversion cost outline mama upswing ka top mama banay ga or ya negative snare inversion design market ka top mama in all actuality do light sa mil kar banay ga or ya negative snare inversion design huma market ka upturn sa downtrend ke traf firmly inversion ka batay ga. Ya negative snare inversion design two light candle sa mil kar banay ga or is design ka negative snare inversion design ka bannay sa phalay market mama jo pattern chal raha ho ga wo upturn ho ga or is design ke jo first candle banay ge wo ak bullish ke cabdle ho ge jo ka market ka past upswing ko follow karte hoi banay ge or ya market ke cost ko low sa high ke traf la kar jana ka batay ge or is negative snare inversion design ke jo ya first flame ho ge wo ak longvreal body candle ho ge jo ka green ya white tone ke ho ge or ya bullish ke candle huma market ka purchase ka brokers ka bata rahe ho ge or is negative snare inversion design ke ya furst candlr high mama close ho ge or is negative snare inversion design ke jo second candle ho ge wo ak inversion candle ho ge or ya is design ke first candle ka shutting point sa open ho ge or ya market ko high sa low ke traf inversion kar ka lay ge magar ya second candle ho ge is negative snare inversion design ke wo first candle sa market ko lower mama ni la a saka ge or is pr) negative snare inversion design ke jo second candle ho ge wo ak long genuine body negative ke candle ho ge or ya huma market areas of strength for ka batay ge or is second candle ka variety red ya dark ho ga.

          Exchanging WITH Negative Snare Inversion Candles Example :

          Poke market mama negative snare inversion candle design banay ga to is time market mama bull ka control ho ga or ya buyer market ke cost ko high strain sa up ke traf la kar ja raha ho ga or is negative snare inversion design ke jo ya first candle banay ge wo market mama bull ka pressure sa banay ge or is mama market ke cost high ke traf jay ge or market ka top mama ak new high point ko banay ge or punch is design ke second light open ho ge to wo market mama jo bull ka control ho ga wo lost ho jay ga or market mama bear ka control a jay ga or ya bear market ke cost ko high sa lower ke traf inversion kar ka la ay ga yani ka is mama market ke cost high sa low ke traf ana slack jay ge or ya negative snare inversion design brokers ko market ka emphatically descending ke traf jana ka batay ge. Passage POINT : Is negative snare inversion candle design mama dealers ko market ka lower ke traf ana ka signal mila ga magar is negative snare inversion design mama brokers exchange ko enter karna sa phalay is compliance kara ga is design ke conformity ka liya merchants is negative snare inversion design ka complete hona ka awful jo next light ka close hona ka stand by kara ga poke is design ka terrible next candle lower mama close ho ge to is design ke conformity ho jay ge or brokers is negative snare inversion design ka terrible jo next flame banay ge is ka lower sa sell ke exchange ko enter kara ga. STOP Misfortune : Negative Snare inversion design mama dealers jo trad enter jara ga os ka jo stop misfortune ho ga wo is design ka high mama place kara ga is mama jo high point ho ga wo is negative snare inversion design ke dono candle ka jo high point ho ga os mama stop misfortune ko place kara ga.

          2: BULLISH Snare Inversion Candles Example :

          Ya bullish snare inversion candle design negative snare inversion candle design ka inverse mama ho ga yani ka ya bullish snare inversion design market ka outline mama downtrend mama banay ga or ya bullish snare inversion design market mama downtrend ka base mama banay ga or ya bullish snare inversion design market mama downtrend mama boycott kar market ka upturn ke traf inversion ka batay ga. Ya negative snare inversion candle design bhi market ka outline mama do candles sa mil kar banay ga is negative snare inversion design ka market ka graph mama bannay sa phalay market descending ke traf ja rahe ho ge or is design ke jo first candle banay ge wo bhi negative ke banay ge yani ka is bullish snare inversion candle design mama jo first light ho ga os kr cost high sa low ke traf jay ge or is bullish snare inversion design ke jo first flame bnay ge ya ak long genuine body candle ho ge or is ka jo variety ho ga wo dark ya red ho ga or ya furst candle bullish snare inversion ke huma market ka negative ka pressure ka batay ge or is first candle ka lower ke traf koi long shadow ni ho ga magar is ka high ke traf ho sakta ha long shadow or is bullish snare inversion design ke jo ya second candle banay ge wo ak inversion candle ho ge or ya market ko downtrend sa upturn ke traf inversion karna ka kam kara ge ya second candel bhi ak long genuine body ho ge or ya first negative candle ka shutting point sa open ho ge or ak bullish ke candle ko banate hoi high ke traf ay ge bullish mama close hoi ge or merchants ko market ka up ke traf jana ka batay ge.

          Exchanging WITH BULLISH Snare Inversion Candles Example :


          Bullish Snare Inversion Candle Example mama dealers ko market ka downtrend sa inversion ho kar market ke cost ka up ke traf jana ka signal mila ga poke ya bullish snare inversion candle design banaya ga to is bullish snare inversion design ka bannay sa phalay market ka bear ka control ho ga or ya bear market ke cost ko lower ke traf la kar ja raha ho ga or market ke cost bear mama move karte hoi lower mama jay ge or is design ke jo first candle banay ge wo bhi is bear ka pressure ke waja sa lower ke traf jay ge or market mama ak new lower point ko banay ge or is bullish snare inversion design ke punch second flame banay ge to ya ak inversion light ho ge or ya bear ka control ko lost kar da ge or ya market mama bull ka pressure ko banay ge or market is bull ka control ke waja sa lower sa high ke traf jay ge or merchants ko ak solid purchase ka signal da ge. Passage POINT : Is bullish snare inversion candle design mama merchants ko market ka up ke traf jana ka signal mila ga is mama dealers purchase ke exchange ko enter kara ga is design ko affirm karna ka awful ka is design mama market ke cost na high mama jana ha is bullish snare inversion design ka terrible hit next candle bullish ke banay ge to is design ke compliance ho jay ge or brokers is design ka terrible jo next light ho ge is ka high sa is mama purchase ke exchange ko enter kara ga or ya ak long haul purchase ke exchange ho ge. STOP Misfortune : Bullish Snare Inversion design mama dealers jo purchase ke exchange ko enter kara ga is exchange ka jo stop misfortune ho ga os ko brokers is design ke jo first flame banay ge os ka lower mama place kara ga or ya lower point is bullish snare inversion design ka lower point ho ga.

          اب آن لائن

          Working...
          X