importance of candlestick pattern.....

No announcement yet.
`
X
  • وقت
  • دکھائیں
Clear All
new posts
  • #1 Collapse

    importance of candlestick pattern.....
    Candlestick Pattern:-


    Aslam u alaikum,

    Dear forex member umeed karta hun aap sab khairiyat se honge dear members Candlesticks
    ka aghaz japan me 1600 sadi me hona shoro howa tha. Japanese chawalo (rice) ki pedawar aur mustaqil me achey result k leye is ki madad lete the. 1870 me Japanese stock market shoro hone k baad candlestick ka istemal financial markets me hone laga. Jab se candlestick ka istemal all over the hone laga hai, to is se traders ko financial market me apne karobar ko profitable banane me bari madad meli hai.


    Candlesticks charts ko candle chart bhi kaha jata hai. Is ko abtedaye tawar par reversal signal ko talash karne me madad karne k leye tayar kia gaya hai, aur jab is ko sahi tareeqay se istemal kia jata hai, to na sirf ye traders k sarmaye ko mehfoz banata hai, bulkeh us me izafa karne me madad faraham karta hai. Candlestick chart pattern dosre chart pattern (bar chart aur line chart) k muqabele me market ka tafseeli aur ziada darust naqsha dekhata hai, aur is ki waja ye hai k candle charts analysis ki naye rahen (vanues) khulte hen aur dosre charts k muqabele me ziada fawayed pesh karte hen:

    1. Candle k chart bulls aur bears k darmeyan jang kon jeet raha hai, dekha kar supply aur demand ki soratehal ko mukamal tawar par zahir karte hen.
    2. Baar chart ki tarah, candle charts bhi market k trend ko zahir karta hai, lekin candles is aqdam k peche taqatwar asbab (ya kamzor asbab) ko bhi zahir kar k analyst ki ziada madad karte hen.
    3. Baar charts techniques ko reversal signals muntaqil karne me aksar hafte lagte hen. Taham, candle chart aksar aik se teen sessions me bohut jald reversal jane k indication faraham karta hai.
    4. Chonkeh candles chart same wahi data istemal karte hen jo baar chart karta hai (yani open, close, high and low), is waja se baar chart par istemal hone wale dosre tamam technical signals asani se candles pe lago keye ja sakte hen. Chonkeh baar charts ki nisbat candles charts k fawayed ziada hen, is waja se humen candles charts ka hi istemal karna chaheye, aur is pe hum dosre sare indicators aur singal bhi asani se lago kar sakte hen.


    Candlestick Timeframe


    Aik candlestick ka timeframe 1 minute se lekar aik month tak ka ho sakta hai. Jo rules aur regulations one minute ki candlestick k leye hoti hai, wahi same one month ki timeframe wali candle ki leye bhi hoti hai. One minute se lekar one hour tak ki candlestick short-term analysis k leye istemal kia jata hai, q k inka duration kam hota hai. Lekin 4 hour se le kar one month tak ki candlestick ling time duration ka hone ki waja se is ka istemal long-term ki analysis me hota hai. Aik candlestick ki duration jitni ziada hogi, utni hi us ka data ziada accurate hoga. Aik candle one minute (M1),five minutes (M5), fifteen minutes (M15), thirty minutes (M30), one hours (H1), four hour (H4), one week (W1) aur one month (MN) ki duration par mushtamil hota hai.


    Key terms of a candlestick


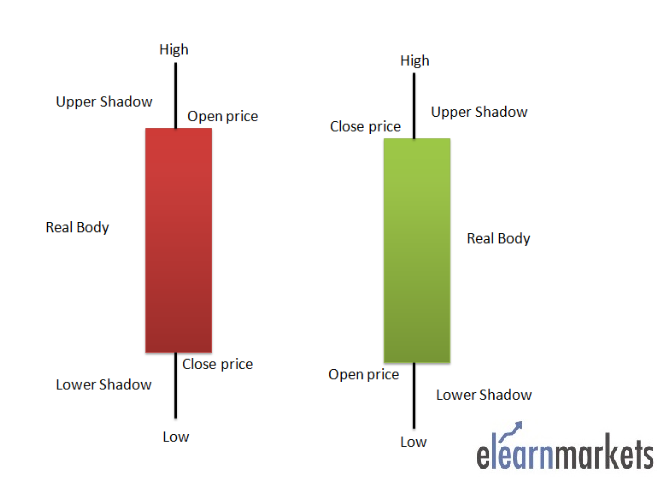
    Aik candlestick mandarja-zel chaar hiso par mushtamil hoti hai. Financial market ki technical analysis k leye aik candlestick ki in hiso ka samjhna bohut zarori hai.

    1. White real body (bullish candle k leye)
    2. Black real body (bearish candle k leye)
    3. Upper shadow (wick)
    4. Lower shadow (wick)


    White Real Body (Bullish):

    Candle ki white body ka matlab hai, k maojooda session ziada ya high qeemat me band howa hai. White real body candle open se lekar close hone tak mutateel hisa hota hai, jo k nechay se uper ki taraf hota hai. Is candle me qeematon ka positive movement karne ki waja se, is candle ko bullish candle bhi kaha jata hai.

    Black Real Body (Bearish):

    Black real body wali candle ka matlab hota hai k maojooda session kam qeemat me band ho gaya hai. Black real body me open position high aur close position downward hota hai. Yani is me qeematen uper se shoro hoyi haiaur nechay ki janib jati hai. Candle ki real body same mustateel shakal me hoti hai, jis ko bearish candle bhi kaha jata hai.

    Uper Shadow (Wick ):

    Candles me aksar uper nechay aik line si bani hoti hai jis ko candle ka shodow kaha jata hai. Agar candle ki uper side pe koi line banti hai to is ko uper shadow ya wick kaha jata hai. Uper shadow candle ki sab se highest qeemat hoti hai, jahan ko ye qamaten touch kar chuki hoti hen. Uper shadow humen buying pressure k bare me information deti hai.

    Lower Shadow (Wick):

    Agar kisi candle ki down side pe koi saya ya line nazar ati hai to ye us candle ki lower shodow kehlati hai. Lower shadow candle ki kam qeematen hoti hai, jis ko is candle ne touch kia hota hai. Lower shadows traders ko selling pressure k bare me batati hai.

    Candlestick ki Main Aqsaam


    Aam tawar par to candlestick ki kafi sari qesmen hen, lekin in me teen main aqsaam hen (yani baqi sari candles in teen aqsaam me shumar hoti hen).

    1. Bullish Candle
    2. Bearish Candle
    3. Doji Candle


    Bullish Candle:

    Bullish candle ko white candle bhi kaha jata hai, jis se murad wo candle hoti hai, jis me aik session k duran closing price hamesha opening price se ziada hoti hai. Bullish candle jitni ziada bari hogi utni hi market me qeematen upside pe ziada move karti hai.

    Bearish Candle:

    Bearish candles bullish candles ki opposite hoti hen aur color me black hoti hai. Bearish candle me aik session closing price hamesha opening price se kam hoti hai. Jitna ziada market me selling pressure hoga, to us hisab se bearish candle bhi bari hogi.

    Doji Candle:

    Doji candle aik colour less candle hoti hen, jo simple do lines pe mushtamil hoti hai. In candle me open, close qeematen same hoti hen, lekin high aur low price mukhtalif ho sakti hai. Doji candle na to positive hoti hai aur na hi negative, is waja se is ko neutral candle bhi kaha jata hai.
    Ap Ka aik thanks bohat zrori ha
  • <a href="https://www.instaforex.org/ru/?x=ruforum">InstaForex</a>
  • #2 Collapse

    جواب: importance of candlestick pattern.....

    inbohat say algortham candlestick charts main dekhaiy gaiy keemat ki maloomat per maubni hatay hain..candlestic trading kay liya bohat karamad hoti han kionkey woh trader key bataiey howay waqat kay duran four price points(open,close,high ,low show kerti ha.candle charts tajron ki janab say mazi ki kay namonay ki buniad per mumkina keemat ki naklo harkat ka tauan kernay key liya istamal ki jata ha.cadlestic charts tajron ki janib say mazi key namono ki base per mumkina price ki naqal u harkat ka tauan kernay kay liya istamal kia jata ha
    Last edited by ; 02-10-2022, 10:25 PM.
    • #3 Collapse

      Re: importance of candlestick pattern.....

      Candlestick pattern

      Forex Trading me teen kisam ki chart pattern istemal hoti hai, aik bar graph, dosra line graph aur last pe ya third one jo hai wo hai candle stick pattern. In sab me sab se ziada analysis istemal hone wala pattern candle stick pattern hai. Candle stick pattern me maximum analysis aur asani se samajh a jane ki waja se ye pattern sanb se best chart pattern hai.
      Forex trading me candle sticks ka istemal bohut zarori hota hai aur hamen lazmi candle stick ka bare me information honi chaheye. Candle stick hi k zarye se hum forex trading me technical analysis karte hen aur aik pairki movement ka candle stick ki madad se hi hum forex trading me asal position ko malom karte hen. Forex trading bihyt hi risky buisiness hai. Is buisiness me hamare pass knowledge, experience aur trading skills ka hona bohut ziada zarori hota hai. Aur ye knowledge hamare analysis me aham role play karta hai. Forex trading me jitne bhi candle stick analysis k leye istemal hote hen wo sare k sare isi me hi maojood hote hen.

      Click image for larger version

Name:	candle.png
Views:	1
Size:	7.3 کلوبائٹ
ID:	12424934

      Importance of candlestick pattern

      Forex trading ya market main candles pattern both ziada important han q k jab hum log forex market main candles pattern ko seekeny gy to he hum ache trading kar saken gy jab tak hum log different candles pattern ko ni seekeny gy to hum log market ko ni samj saken gy is key humy chae ha ziada sy ziada learning karny or in pattern pe demo account main trading karny jtni ziada practice karny gy to humara knowledge information ziada ho ge or hum real account main ache trading kar k ache earning kar saken gy forex trading main both sary pattern han jin main market ki movement bi different hoti ha is ley humy chae ha sab candle patterns ko ache tahra seekeny jab hum log different patterns ko seek lan gy to phr ache earning kar saken gy forex trading main candles pattern k sath sath hum different indicator ko bi istamal kar sakty han jin sy hum behtar trading kar sakty han
      Is ley hum log behtar planning or strategy k ley humy candle chart or is main different indicator ko aik sath istamal kar k ache planning or strategy bana k trading kar sakty han.

      Click image for larger version

Name:	askdklchjcn.jpg
Views:	1
Size:	9.5 کلوبائٹ
ID:	12424935

      Most powerful candles in Candlestick pattern


      Dear Forex me candlestick pattern me jo sab se powerful patterns hain wo bearish candlestick oe bullish candlestick patterns hain. Forex ma bahot sari information chupi hoti ha market ko amjhny ky leay jaiza lena zarori hai market ma analysis nam ki ches hoti hai jis ma sari market ki khufia baten chupi hoti hain in baton ko pta lgana hota hai kamyab hona hai to money managment k hisab se kaam karna chaye aor aus k baad agar hum ne ais market mai koi pattern dekha ho to aus k hisab se hum ko trade lagani chaye agar market mai trade na ban rahe ho to hum ko ais mai trade ni karni kitna experience ha market k sath jitna acha experience ho ga market ap k hath mein rahy ge. Ab trading k doraan ap k emotions haen Jo ap pe bar bar attack krty rehty haen un pe ap ka fully control hona chaye. Kbhi bhi ghalti se ap un k chakr mein na aen. Market ki movement ko dakhty howy trade na lagaen jb tk market ap ko aik achi trade na de de. Ab jb ap profit kamany lag jaen tu ap ka apni trading mein aik ratham k sath chal rahy haen usi mein chalaen kbhi bhi ziada ki lalach na krean us pe mustaqil rahaen.aur Jo profit mil jaye us ko accept krean. Target k peechy met bhagaen. Ye sb cheezain ap ko aik acha trader bana sakti haen kamyab hona hai to trading ma basic steps ko zehn nashen kren aor trading ma na kam risk len aor na zeyada risk len forex trading ma apko market ko smjhna chye market kesy move krti hai is ky oechy bahot lqmbi theory hoti hai sirf buy ya sell up ya down movement nhi hoti blky har candle jo bnti hai is ky pechy bhi aik kahani hoti hai.

      Click image for larger version

Name:	gfghcvbncgrvbvxdrwrghvbdihnbvioojcvy7ihbjbgyu80iolj.png
Views:	1
Size:	8.7 کلوبائٹ
ID:	12424936
      • #4 Collapse

        Re: importance of candlestick pattern.....

        Candlestick Pattern:
        Forex Trading me teen kisam ki chart pattern istemal hoti hai, aik bar graph, dosra line graph aur last pe ya third one jo hai wo hai candle stick pattern. In sab me sab se ziada analysis istemal hone wala pattern candle stick pattern hai. Candle stick pattern me maximum analysis aur asani se samajh a jane ki waja se ye pattern sanb se best chart pattern hai.
        Forex trading me candle sticks ka istemal bohut zarori hota hai aur hamen lazmi candle stick ka bare me information honi chaheye. Candle stick hi k zarye se hum forex trading me technical analysis karte hen aur aik pairki movement ka candle stick ki madad se hi hum forex trading me asal position ko malom karte hen. Forex trading bihyt hi risky buisiness hai. Is buisiness me hamare pass knowledge, experience aur trading skills ka hona bohut ziada zarori hota hai. Aur ye knowledge hamare analysis me aham role play karta hai. Forex trading me jitne bhi candle stick analysis k leye istemal hote hen wo sare k sare isi me hi maojood hote hen.


        Candlestick Pattern importance:

        Forex trading ya market main candles pattern both ziada important han q k jab hum log forex market main candles pattern ko seekeny gy to he hum ache trading kar saken gy jab tak hum log different candles pattern ko ni seekeny gy to hum log market ko ni samj saken gy is key humy chae ha ziada sy ziada learning karny or in pattern pe demo account main trading karny jtni ziada practice karny gy to humara knowledge information ziada ho ge or hum real account main ache trading kar k ache earning kar saken gy forex trading main both sary pattern han jin main market ki movement bi different hoti ha is ley humy chae ha sab candle patterns ko ache tahra seekeny jab hum log different patterns ko seek lan gy to phr ache earning kar saken gy forex trading main candles pattern k sath sath hum different indicator ko bi istamal kar sakty han jin sy hum behtar trading kar sakty han
        Is ley hum log behtar planning or strategy k ley humy candle chart or is main different indicator ko aik sath istamal kar k ache planning or strategy bana k trading kar sakty han.

        Candlestick pattern Points:

        Candlesticks charts ko candle chart bhi kaha jata hai. Is ko abtedaye tawar par reversal signal ko talash karne me madad karne k leye tayar kia gaya hai, aur jab is ko sahi tareeqay se istemal kia jata hai, to na sirf ye traders k sarmaye ko mehfoz banata hai, bulkeh us me izafa karne me madad faraham karta hai. Candlestick chart pattern dosre chart pattern (bar chart aur line chart) k muqabele me market ka tafseeli aur ziada darust naqsha dekhata hai, aur is ki waja ye hai k candle charts analysis ki naye rahen (vanues) khulte hen aur dosre charts k muqabele me ziada fawayed pesh karte hen:


        1. Candle k chart bulls aur bears k darmeyan jang kon jeet raha hai, dekha kar supply aur demand ki soratehal ko mukamal tawar par zahir karte hen.
        2. Baar chart ki tarah, candle charts bhi market k trend ko zahir karta hai, lekin candles is aqdam k peche taqatwar asbab (ya kamzor asbab) ko bhi zahir kar k analyst ki ziada madad karte hen.
        3. Baar charts techniques ko reversal signals muntaqil karne me aksar hafte lagte hen. Taham, candle chart aksar aik se teen sessions me bohut jald reversal jane k indication faraham karta hai.
        4. Chonkeh candles chart same wahi data istemal karte hen jo baar chart karta hai (yani open, close, high and low), is waja se baar chart par istemal hone wale dosre tamam technical signals asani se candles pe lago keye ja sakte hen. Chonkeh baar charts ki nisbat candles charts k fawayed ziada hen, is waja se humen candles charts ka hi istemal karna chaheye, aur is pe hum dosre sare indicators aur singal bhi asani se lago kar sakte hen.
        5. Aik candlestick ka timeframe 1 minute se lekar aik month tak ka ho sakta hai. Jo rules aur regulations one minute ki candlestick k leye hoti hai, wahi same one month ki timeframe wali candle ki leye bhi hoti hai. One minute se lekar one hour tak ki candlestick short-term analysis k leye istemal kia jata hai, q k inka duration kam hota hai. Lekin 4 hour se le kar one month tak ki candlestick ling time duration ka hone ki waja se is ka istemal long-term ki analysis me hota hai. Aik candlestick ki duration jitni ziada hogi, utni hi us ka data ziada accurate hoga. Aik candle one minute (M1),five minutes (M5), fifteen minutes (M15), thirty minutes (M30), one hours (H1), four hour (H4), one week (W1) aur one month (MN) ki duration par mushtamil hota hai.
        • #5 Collapse

          Re: importance of candlestick pattern.....

          trading me candle sticks ka istemal bohut zarori hota hai aur hamen lazmi candle stick ka bare me information honi chaheye. Candle stick hi k zarye se hum forex trading me technical analysis karte hen aur aik pairki movement ka candle stick ki madad se hi hum forex trading me asal position ko malom karte hen. Forex trading bihyt hi risky buisiness hai. Is buisiness me hamare pass knowledge, experience aur trading skills ka hona bohut ziada zarori hota hai. Aur ye knowledge hamare analysis me aham role play karta hai. Forex trading me jitne bhi candle stick analysis k leye istemal hote hen wo sare k sare isi me hi maojood hote hen.Candlestick chart pattern dosre chart pattern (bar chart aur line chart) k muqabele me market ka tafseeli aur ziada darust naqsha dekhata hai, aur is ki waja ye hai k candle charts analysis ki naye rahen (vanues) khulte hen aur dosre charts k muqabele me ziada fawayed pesh karte hen:
          trading ya market main candles pattern both ziada important han q k jab hum log forex market main candles pattern ko seekeny gy to he hum ache trading kar saken gy jab tak hum log different candles pattern ko ni seekeny gy to hum log market ko ni samj saken gy is key humy chae ha ziada sy ziada learning karny or in pattern pe demo account main trading karny jtni ziada practice karny gy to humara knowledge information ziada ho ge or hum real account main ache trading kar k ache earning kar saken gy forex trading main both sary pattern han jin main market ki movement bi different hoti ha is ley humy chae ha sab candle patterns ko ache tahra seekeny jab hum log different patterns ko seek lan gy to phr ache earning kar saken gy forex trading main candles pattern k sath sath hum different indicator ko bi istamal kar sakty han jin sy hum behtar trading kar sakty hanCandlesticks charts ko candle chart bhi kaha jata hai. Is ko abtedaye tawar par reversal signal ko talash karne me madad karne k leye tayar kia gaya hai, aur jab is ko sahi tareeqay se istemal kia jata hai, to na sirf ye traders k sarmaye ko mehfoz banata hai, bulkeh us me izafa karne me madad faraham karta hai. Candlestick chart pattern dosre chart pattern (bar chart aur line chart) k muqabele me market ka tafseeli aur ziada darust naqsha dekhata hai, aur is ki waja ye hai k candle charts analysis ki naye rahen (vanues) khulte hen aur dosre charts k muqabele me ziada fawayed pesh karte hen:Forex trading me candle sticks ka istemal bohut zarori hota hai aur hamen lazmi candle stick ka bare me information honi chaheye. Candle stick hi k zarye se hum forex trading me technical analysis karte hen aur aik pairki movement ka candle stick ki madad se hi hum forex trading me asal position ko malom karte hen. Forex trading bihyt hi risky buisiness hai. Is buisiness me hamare pass knowledge, experience aur trading skills ka hona bohut ziada zarori hota hai.candlestick patterns hain. Forex ma bahot sari information chupi hoti ha market ko amjhny ky leay jaiza lena zarori hai market ma analysis nam ki ches hoti hai jis ma sari market ki khufia baten chupi hoti hain in baton ko pta lgana hota hai kamyab hona hai to money managment k hisab se kaam karna chaye aor aus k baad agar hum ne ais market mai koi pattern dekha ho to aus k hisab se hum ko trade lagani chaye agar market mai trade na ban rahe ho to hum ko ais mai trade ni karni kitna experience ha market k sath jitna acha experience ho ga market ap k hath mein rahy ge. Ab trading k doraan ap k emotions haen Jo ap pe bar bar attack krty rehty haen un pe ap ka fully control hona chaye. Kbhi bhi ghalti se ap un k chakr mein na aen. Market ki movement ko dakhty howy trade na lagaen jb tk market ap ko aik achi trade na de de. Ab jb ap profit kamany lag jaen tu ap ka apni trading mein aik ratham k sath chal rahy haen usi mein chalaen kbhi bhi ziada ki lalach na krean us pe mustaqil rahaen.aur Jo profit mil jaye us ko accept krean. Target k peechy met bhagaen. Ye sb cheezain ap ko aik acha trader bana sakti haen kamyab hona hai to trading ma basic steps ko zehn nashen kren aor trading ma na kam risk len aor na zeyada risk len forex trading ma apko market ko smjhna chye market kesy move krti haior strategy k ley humy candle chart or is main different indicator ko aik sath istamal kar k ache planning or strategy bana k trading kar sakty han.
          1. White real body (bullish candle k leye)
          2. Black real body (bearish candle k leye)
          3. Upper shadow (wick)
          4. Lower shadow (wick)


          • #6 Collapse

            Re: importance of candlestick pattern.....

            Aslam u alaikum,


            Dear forex members umeed karta hun aap sab khairiyat se honge dear members Candlestick ka aghaz japan me 1600 sadi me hona shoro howa tha. Japanese chawalo (rice) ki pedawar aur maqil me achey result k leye is ki madad lete the. 1870 me Japanese stock market shoro hone k baad candlestick ka istemal financial markets me hone laga. Jab se candlestick ka istemal all over hone laga hai, that is with traders ko financial market me apne karobar ko profitable banane me bari madad meli hai.


            Candlestick charts ko candlestick chart bhi kaha jata hai. Je ko abtedaye tawar par reverse signal ko talash karne me madad karne k leye tayar kia gaya hai, aur jab is ko sahi tareeqay se istemal kia jata hai, to na sirf ye traders k sarmaye ko mehfoz banata hai, karneh me me izafa madad faraham card hai. Candlestick chart pattern dosre chart pattern (bar chart aur line chart) k muqabele me market ka tafseeli aur ziada darust naqsha dekhata hai, aur je ki waja ye hai k candlestick charts analysis ki naye rahen (vanues) khulte hen aur dosre charts me k muqa hen ziata fawayed pesh karte:


            Candle to chart bulls and bears k darmeyan jang kon jeet raha hai, dekha kar supply aur demand ki soratehal ko mukamal tawar par zahir karte hens.Baar chart ki tarah, candlestick charts bhi market k trend ko zahir karta hai, lekin candles is aqdam k peche taqatwar asbab (ya kamzor asbab) ko bhi zahir kar k analyst ki zaiya madad karte hen.Baar diagrams technique ko reversal signals muntaqil karne me aksar hafte lagte hen. Taham, candle chart aksar aik se teen sessions me bohut jald reversal jane k indication faraham karta hai.Chonkeh candles chart same wahi data istemal karte hen jo baar chart karta hai (ie open, close, high and low), is waja se baar chart par istemal hone wale dosre tamam technical signals asani se candles on lago keye a sakte hen. Chonkeh baar charts ki nisbat candles charts k fawayed ziyaa hen, is waja se humen candles charts ka hi istemal karna chaheye, aur is pe hum dosre sare indicators aur singal bhi asani se lago kar sakte hen.

            Candlestick Time Frame

            Aik candlestick ka timeframe 1 minute se lekar aik month tak ka ho sakta hai. Yes rules and regulations one minute ki candlestick k leye hoti hai, wahi same one month ki time frame wali candle ki leye bhi hoti hai. One minute se lekar one hour so ki candlestick short-term analysis k leye istemal kia jata hai, q k inka duration kam hota hai. Lekin 4 hours se le kar one month tak ki candlestick ling duration ka hone ki waja se je ka istemal long term analysis ki me hota hai. Aik candlestick ki duration jitni ziata hogi, utni hi us ka data ziata exact hoga. Aik candle one minute (M1), five minutes (M5), fifteen minutes (M15), thirty minutes (M30), one hour (H1), four hours (H4), one week (W1) or one month (MN) ki duration par mushtamil hota hai.


            Candlestick Key TermsClick image for larger version

Name:	images.jpeg
Views:	1
Size:	19.7 کلوبائٹ
ID:	12424980


            Aik candlestick mandarja-zel chaar hiso par mushtamil hoti hai. Financial market ki technical analysis k leye aik candlesticks ki in hiso ka samjhna bohut zarori hai.

            1.White real body (bull candle to ley)

            2.Black real body (bear candle to ley)

            3.Upper shadow (wick)


            4.Lower shadow (wick)

            White Real Body (Bullish):Click image for larger version

Name:	-infographics-What-is-a-bullish-engulfing-pattern-MCT-6902-EN-1.png
Views:	1
Size:	8.2 کلوبائٹ
ID:	12424979


            Candle ki white body ka matlab hai, k maojooda session ziana ya high qeemat me band howa hai. White real body candle open se lekar close hone tak mutateel hisa hota hai, yes k letchay se uper ki taraf hota hai. Is candle me qeematon ka positive move karne ki waja se, is candle ko bullish candle bhi kaha jata hai.


            Black Real Body (Bearish):Click image for larger version

Name:	images.png
Views:	1
Size:	4.2 کلوبائٹ
ID:	12424978


            Black real body wali candle ka matlab hota hai k maojooda session kam qeemat me band ho gaya hai. Black real body me open position high aur closed position down hota hai. Yani is me qeematen uper se shoro hoyi haiaur letchay ki janib jati hai. Candle ki real body same mustateel shakal me hoti hai, jis ko bear candle bhi kaha jata hai.


            Upper Shadow (Wick):


            Candles me aksar uper nachay aik line si bani hoti hai jis ko candle ka shodow kaha jata hai. Agar candle ki upper side pe koi line banti hai it is ko upper shadow ya wick kaha jata hai. Upper shadow candle ki sab se highest qeemat hoti hai, jahan ko ye qamaten touch kar chuki hoti hen. Uper shadow humen purchase pressure to bar mi information children hai.


            Lower Shadow (Wick):


            Agar kisi candle ki down side pe koi saya ya line nazar ati hai to you us candle ki lower shodow kehlati hai. Lower shadow candle ki kam qeematen hoti hai, jis ko je candle no touch kia hota hai. Lower shadow traders ko selling pressure k bar me batati hai.


            Candlestick ki Main Aqsaam

            Aam tawar par na candlestick ki kafi sari qesmen hen, lekin in me teenage chief hen aqsaam (candles yani baqi sari in teenage aqsaam me shumar hoti hen).


            Bullish candleBear candleDoji candleBull candlestick:


            Bull candle ko white candle bhi kaha jata hai, jis se murad wo candle hoti hai, jis me aik session k duran closing price hamesha opening price se ziana hoti hai. Bullish candle jitni ziata bari hogi utni hi market me qeematen upside pe ziata move karti hai.


            Bear candle:


            Bear candles bull candles ki opposite hoti chicken aur color me black hoti hai. Bear candle me aik session closing price hamesha opening price se kam hoti hai. Jitna ziata market me selling pressure hoga, nam hisab se bearish candle bhi bari hogi.


            Doji Candle


            Doji candle aik color less candle hoti hen, jo simple do lines pe mushtamil hoti hai. In candle me open, close qeematen same hoti hen, lekin high aur low price mukhtalif ho sakti hai. Doji candle na to positive hoti hai aur na hi negative, je waja se je ko neutral candle bhi kaha jata hai.
            • #7 Collapse

              Re: importance of candlestick pattern.....

              Candlestick Time Frame;

              Aik candlestick ka timeframe 1 minute se lekar aik month tak ka ho sakta hai. Yes regulations and policies one minute ki candlestick okay leye hoti hai, wahi same one month ki time frame wali candle ki leye bhi hoti hai. One minute se lekar one hour so ki candlestick quick-time period analysis okay leye istemal kia jata hai, q k inka length kam hota hai. Lekin 4 hours se le kar one month tak ki candlestick ling period ka hone ki waja se je ka istemal long time evaluation ki me hota hai. Aik candlestick ki period jitni ziata hogi, utni hi us ka data ziata specific hoga. Aik candle one minute (M1), five minutes (M5), fifteen minutes (M15), thirty minutes (M30), one hour (H1), 4 hours (H4), one week (W1) or one month (MN) ki period par mushtamil hota hai.Candlestick ka aghaz japan me 1600 sadi me hona shoro howa tha. Japanese chawalo (rice) ki pedawar aur maqil me achey end result k leye is ki madad lete the. 1870 me Japanese inventory market shoro hone ok baad candlestick ka istemal financial markets me hone laga. Jab se candlestick ka istemal throughout hone laga hai, that is with traders ko financial market me apne karobar ko worthwhile banane me bari madad meli hai.

              Candlestick Key Terms;

              Candlestick charts ko candlestick chart bhi kaha jata hai. Je ko abtedaye tawar par reverse sign ko talash karne me madad karne k leye tayar kia gaya hai, aur jab is ko sahi tareeqay se istemal kia jata hai, to na sirf ye buyers k sarmaye ko mehfoz banata hai, karneh me me izafa madad faraham card hai. Candlestick chart pattern dosre chart pattern (bar chart aur line chart) ok muqabele me marketplace ka tafseeli aur ziada darust naqsha dekhata hai, aur je ki waja ye hai okay candlestick charts evaluation ki naye rahen (vanues) khulte chicken aur dosre charts me k muqa fowl ziata fawayed pesh karte.Candle to chart bulls and bears ok darmeyan jang kon jeet raha hai, dekha kar supply aur demand ki soratehal ko mukamal tawar par zahir karte hens.Baar chart ki tarah, candlestick charts bhi market okay fashion ko zahir karta hai, lekin candles is aqdam ok peche taqatwar asbab (ya kamzor asbab) ko bhi zahir kar ok analyst ki zaiya madad karte fowl.Baar diagrams technique ko reversal indicators muntaqil karne me aksar hafte lagte chook. Taham, candle chart aksar aik se teenager periods me bohut jald reversal jane okay indication faraham karta hai.Chonkeh candles chart equal wahi records istemal karte chicken jo baar chart karta hai (ie open, close, high and low), is waja se baar chart par istemal hone wale dosre tamam technical alerts asani se candles on lago keye a sakte chook. Chonkeh baar charts ki nisbat candles charts okay fawayed ziyaa chook, is waja se humen candles charts ka hi istemal karna chaheye, aur is pe hum dosre sare signs aur singal bhi asani se lago kar sakte chook.


              Candlestick pattern Points:

              Candlesticks charts ko candle chart bhi kaha jata hai. Is ko abtedaye tawar par reversal sign ko talash karne me madad karne ok leye tayar kia gaya hai, aur jab is ko sahi tareeqay se istemal kia jata hai, to na sirf ye buyers k sarmaye ko mehfoz banata hai, bulkeh us me izafa karne me madad faraham karta hai. Candlestick chart pattern dosre chart pattern (bar chart aur line chart) k muqabele me marketplace ka tafseeli aur ziada darust naqsha dekhata hai, aur is ki waja ye hai ok candle charts analysis ki naye rahen (vanues) khulte chicken aur dosre charts k muqabele me ziada fawayed pesh karte hen.
              Candlestick Pattern importance:

              Forex trading ya marketplace important candles sample each ziada crucial han q ok jab hum log forex market predominant candles pattern ko seekeny gy to he hum pain buying and selling kar saken gy jab tak hum log one-of-a-kind candles pattern ko ni seekeny gy to hum log market ko ni samj saken gy is prime humy chae ha ziada sy ziada getting to know karny or in sample pe demo account major trading karny jtni ziada exercise karny gy to humara information statistics ziada ho ge or hum actual account main pain trading kar k ache earning kar saken gy forex trading principal each sary sample han jin main marketplace ki motion bi exceptional hoti ha is ley humy chae ha sab candle patterns ko ache tahra seekeny jab hum log different styles ko are seeking lan gy to phr ache incomes kar saken gy forex buying and selling main candles pattern okay sath sath hum different indicator ko bi istamal kar sakty han jin sy hum behtar buying and selling kar sakty han


              Candlestick pattern in marketplace;

              Forex Trading me youngster kisam ki chart sample istemal hoti hai, aik bar graph, dosra line graph aur closing pe ya 1/3 one jo hai wo hai candle stick sample. In sab me sab se ziada analysis istemal hone wala pattern candle stick sample hai. Candle stick sample me most evaluation aur asani se samajh a jane ki waja se ye pattern sanb se exceptional chart sample hai.
              Forex trading me candle sticks ka istemal bohut zarori hota hai aur hamen lazmi candle stick ka bare me data honi chaheye. Candle stick hello okay zarye se hum forex trading me technical analysis karte bird aur aik pairki movement ka candle stick ki madad se hi hum foreign exchange buying and selling me asal function ko malom karte fowl. The Forex market trading bihyt hi risky buisiness hai. Is buisiness me hamare skip knowledge, revel in aur trading talents ka hona bohut ziada zarori hota hai. Aur ye know-how hamare analysis me aham position play karta hai. The Forex market trading me jitne bhi candle stick analysis ok leye istemal hote chicken wo sare okay sare isi me hi maojood hote hen.
              • <a href="https://www.instaforex.org/ru/?x=ruforum">InstaForex</a>
              • #8 Collapse

                Re: importance of candlestick pattern.....

                Candlestick Pattern;

                Dear foreign exchange member umeed karta hun aap sab khairiyat se honge expensive contributors Candlesticks ka aghaz japan me 1600 sadi me hona shoro howa tha. Japanese chawalo (rice) ki pedawar aur mustaqil me achey end result ok leye is ki madad lete the. 1870 me Japanese stock market shoro hone k baad candlestick ka istemal economic markets me hone laga. Jab se candlestick ka istemal everywhere in the hone laga hai, to is se traders ko economic marketplace me apne karobar ko worthwhile banane me bari madad meli hai.Candlesticks charts ko candle chart bhi kaha jata hai. Is ko abtedaye tawar par reversal signal ko talash karne me madad karne ok leye tayar kia gaya hai, aur jab is ko sahi tareeqay se istemal kia jata hai, to na sirf ye buyers ok sarmaye ko mehfoz banata hai, bulkeh us me izafa karne me madad faraham karta hai. Candlestick chart sample dosre chart sample (bar chart aur line chart) k muqabele me marketplace ka tafseeli aur ziada darust naqsha dekhata hai, aur is ki waja ye hai ok candle charts analysis ki naye rahen (vanues) khulte bird aur dosre charts k muqabele me ziada fawayed pesh karte hen:

                Candlestick Timeframe;

                Candle okay chart bulls aur bears ok darmeyan jang kon jeet raha hai, dekha kar supply aur demand ki soratehal ko mukamal tawar par zahir karte bird.
                Baar chart ki tarah, candle charts bhi market k fashion ko zahir karta hai, lekin candles is aqdam okay peche taqatwar asbab (ya kamzor asbab) ko bhi zahir kar okay analyst ki ziada madad karte bird.
                Baar charts techniques ko reversal signals muntaqil karne me aksar hafte lagte chook. Taham, candle chart aksar aik se teen sessions me bohut jald reversal jane okay indication faraham karta hai.
                Chonkeh candles chart same wahi information istemal karte chicken jo baar chart karta hai (yani open, close, high and occasional), is waja se baar chart par istemal hone wale dosre tamam technical alerts asani se candles pe lago keye ja sakte chook. Chonkeh baar charts ki nisbat candles charts ok fawayed ziada chook, is waja se humen candles charts ka hi istemal karna chaheye, aur is pe hum dosre sare signs aur singal bhi asani se lago kar sakte fowl.Aik candlestick ka timeframe 1 minute se lekar aik month tak ka ho sakta hai. Jo policies aur regulations one minute ki candlestick k leye hoti hai, wahi same one month ki time frame wali candle ki leye bhi hoti hai. One minute se lekar one hour tak ki candlestick brief-term evaluation okay leye istemal kia jata hai, q ok inka length kam hota hai


                significance of candlestick pattern;

                Inbohat say algortham candlestick charts principal dekhaiy gaiy keemat ki maloomat in step with maubni hatay hain..Candlestic trading kay liya bohat karamad hoti han kionkey woh dealer key bataiey howay waqat kay duran four charge factors(open,near,high ,low display kerti ha.Candle charts tajron ki janab say mazi ki kay namonay ki buniad in step with mumkina keemat ki naklo harkat ka tauan kernay key liya istamal ki jata ha.Cadlestic charts tajron ki janib say mazi key namono ki base in line with mumkina charge ki naqal u harkat ka tauan kernay kay liya istamal kia jata ha.Forex trading me candle sticks ka istemal bohut zarori hota hai aur hamen lazmi candle stick ka bare me information honi chaheye. Candle stick hello ok zarye se hum foreign exchange trading me technical analysis karte chook aur aik pairki motion ka candle stick ki madad se hi hum foreign exchange buying and selling me asal role ko malom karte chook. The Forex market trading bihyt hello volatile buisiness hai. Is buisiness me hamare bypass know-how, experience aur trading abilities ka hona bohut ziada zarori hota hai. Aur ye know-how hamare analysis me aham function play karta hai. Forex trading me jitne bhi candle stick analysis ok leye istemal hote hen wo sare okay sare isi me hi maojood hote hen.
                Importance of candlestick pattern

                the Forex market trading ya market important candles pattern each ziada crucial han q k jab hum log forex market main candles sample ko seekeny gy to he hum pain trading kar saken gy jab tak hum log different candles pattern ko ni seekeny gy to hum log market ko ni samj saken gy is prime humy chae ha ziada sy ziada getting to know karny or in pattern pe demo account principal buying and selling karny jtni ziada practice karny gy to humara knowledge information ziada ho ge or hum actual account important pain buying and selling kar ok ache earning kar saken gy foreign exchange buying and selling essential both sary sample han jin main market ki motion bi specific hoti ha is ley humy chae ha sab candle patterns ko ache tahra seekeny jab hum log exceptional patterns ko are looking for lan gy to phr pain earning kar saken gy forex trading principal candles pattern ok sath sath hum exclusive indicator ko bi istamal kar sakty han jin sy hum behtar buying and selling kar sakty


                Candlestick Time Frame

                Aik candlestick ka time-frame 1 minute se lekar aik month tak ka ho sakta hai. Yes guidelines and policies one minute ki candlestick ok leye hoti hai, wahi same one month ki time body wali candle ki leye bhi hoti hai. One minute se lekar one hour so ki candlestick brief-time period analysis k leye istemal kia jata hai, q ok inka length kam hota hai. Lekin four hours se le kar one month tak ki candlestick ling period ka hone ki waja se je ka istemal long term evaluation ki me hota hai. Aik candlestick ki duration jitni ziata hogi, utni hello us ka statistics ziata actual hoga. Aik candle one minute (M1), 5 minutes (M5), fifteen minutes (M15), thirty minutes (M30), one hour (H1), four hours (H4), one week (W1) or one month (MN) ki length par mushtamil hota hai.

                اب آن لائن

                Working...
                X