Salam to all frends , umeed ha k liye sab kheriat sa hon ga aur forex market sa daily basis per ak acha gain le raha hon ga. Dear traders forex trading ak risky business ha is man traders ko bhot losses hota han.
Dear Forex member Aaj Jis topic ke bare mein Ham study karne Ja Rahe Hain is topic ko a bullet penutaur bullish peanut Kaha jata hai Jis pattern ko aaj Ham read Karenge price action Mein ise peanut chart pattern Kahate Hain aur yah bahut hi jyada effective Hota Hai
Imprtance of Chart Patterns in Forex .
Forex trading Mein chart pattern bahut important hota hai market price ko jaanch Mein ke liye ya FIR Maar ki ticket trend ko samajhne ke liye koi bhi traders chart Ko Dekhe bagair Ja chart analysis kiye bagair market Mein trade nahin kar sakta
Forex trading man successful trader hamasha currency pairs aur commodities ki price movements ko smajhna k liye price chart ko read kerta han, q k price chart he trader ko patterns man changes, momentum aur price k trend man change ko 100% accuracy k sath identify kerta ha. Chart Patterns forex trading man trader ko is qabil banati ha k wo currency pairs aur commodities k price chart man price ki movement ko track ker k accurate trade entry aur trade exit levels ko identify kerta han. Is liye forex trading man trader kisi b currency pair ya commodity ko buy/sell kerna k liye chart patterns per depend kerta ha. Aj man apka sath ak important chart pattern per apna knowledge share kerta hun.
Explain Peanut Chart Pattern.Pennant Chart Pattern ak consolidation pattern ha jis man price ki movement continuously decrease kerti ha aur pattern k complete hona per price is pattern ko break kerti ha. Pennant Chart Pattern ak trend continuation pattern ha jo long bullish/bearish k mid man banta ha. Yeah chart Kuch Chhoti Se swings per banta hai yani ke is Mein Maximum 2 se 3 swings bahut hi small Sewing hoti hain aur kaun consolidate Karta Hua Breakout kr jata hai
How to spot Pennant Chart Pattern.Pennant Chart Pattern ko draw kerna k liye trader price k swing high aur swing low ko trend lines sa jorta ha. Is pattern k valid hona k liye zarori ha ak line positive slope ki aur dosri negative slope ki honi chaheye aur dono trend lines ak point per ak dosra ko cross kerna b zarori ha.Pennant chart pattern price consolidation kay bad continuation laita hay. Is liye hamain is pattern ko hamain seful banany kay liye chart per deep analysis karny party hain. Ham ager is chart ko intra day main bhi daikhain yo ye mil jata hay. Laikin is pattern ki mazeed trend continuation strength jan'na bahut important hota hay.
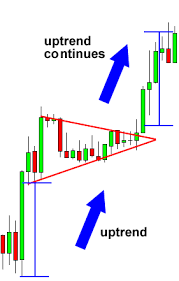
Explain Bull Pennant Chart Pattern:Bullish Pennant Chart Pattern price k bullish trend k mid man banta ha, jo traders ko bullish trend k mazeed continue rehna ka signal deta ha. Ye cahrt pattern currency pairs aur commodities k price chart man commonly banna wala chart pattern ha.

Trading Method of Bullish Peanut Chart Pattren.
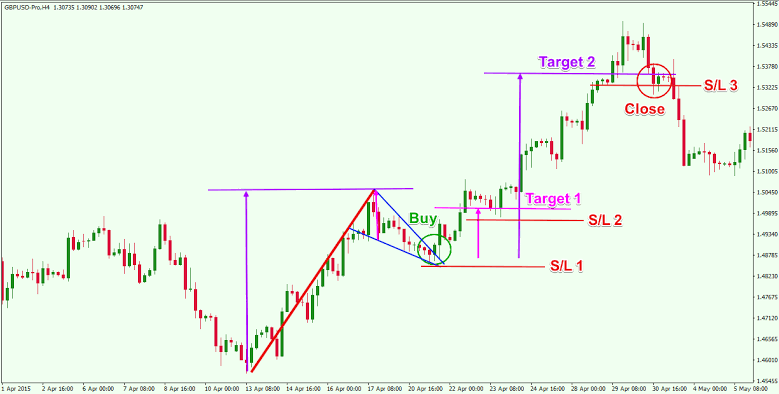
Bullish Pennant Chart Pattern per trading k liye zarori ha k trader is pattern k complete hona ka wait kara. Jab is pattern man price upper trend line k pass a jae aur price candle ka close upper trend line k oper de da to is sa breakout ki confirmation ho jati ha. Lakin breakout per trade risky hona ki waja sa trader ko price ka upper trend line ko retest kerna ka wait kerna chaheye. Jab price retest ki confirmation de da to is per trader ko ""buy ki trade"" active kerni chaheye.

Limites .Bullish Pennant Chart Pattern per trading k doran trader ko Stoploss price k last swing low per place kerna chaheye aur Take Profit ko next resistance levels per Tp-1, Tp-2 aur Tp-3 ker k place karen.
Explain Bear Pennant Chart Pattern.Bearish Pennant Chart Pattern price k bearish trend k mid man banta ha, jo traders ko bearish trend k mazeed continue rehna ka signal deta ha. Ye cahrt pattern currency pairs aur commodities k price chart man commonly banna wala chart pattern ha.
Trading Method Bearish Pennant .
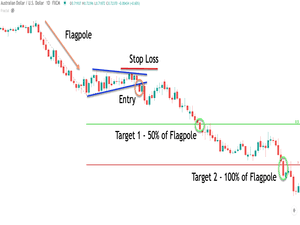
Bearish Pennant Chart Pattern per trading k liye zarori ha k trader is pattern k complete hona ka wait kara. Jab is pattern man price lower trend line k pass a jae aur price candle ka close lower trend line k nicha de da to is sa breakout ki confirmation ho jati ha. Lakin breakout per trade risky hona ki waja sa trader ko price ka lower trend line ko retest kerna ka wait kerna chaheye. Jab price retest ki confirmation de da to is per trader ko ""sell ki trade"" active kerni chaheye.

Entry Levels
Bearish Pennant Chart Pattern per trading k doran trader ko Stoploss price k last swing high per place kerna chaheye aur Take Profit ko next support levels per Tp-1, Tp-2 aur Tp-3 ker k place karen.

Dear Forex member Aaj Jis topic ke bare mein Ham study karne Ja Rahe Hain is topic ko a bullet penutaur bullish peanut Kaha jata hai Jis pattern ko aaj Ham read Karenge price action Mein ise peanut chart pattern Kahate Hain aur yah bahut hi jyada effective Hota Hai
Imprtance of Chart Patterns in Forex .
Forex trading Mein chart pattern bahut important hota hai market price ko jaanch Mein ke liye ya FIR Maar ki ticket trend ko samajhne ke liye koi bhi traders chart Ko Dekhe bagair Ja chart analysis kiye bagair market Mein trade nahin kar sakta
Forex trading man successful trader hamasha currency pairs aur commodities ki price movements ko smajhna k liye price chart ko read kerta han, q k price chart he trader ko patterns man changes, momentum aur price k trend man change ko 100% accuracy k sath identify kerta ha. Chart Patterns forex trading man trader ko is qabil banati ha k wo currency pairs aur commodities k price chart man price ki movement ko track ker k accurate trade entry aur trade exit levels ko identify kerta han. Is liye forex trading man trader kisi b currency pair ya commodity ko buy/sell kerna k liye chart patterns per depend kerta ha. Aj man apka sath ak important chart pattern per apna knowledge share kerta hun.
Explain Peanut Chart Pattern.Pennant Chart Pattern ak consolidation pattern ha jis man price ki movement continuously decrease kerti ha aur pattern k complete hona per price is pattern ko break kerti ha. Pennant Chart Pattern ak trend continuation pattern ha jo long bullish/bearish k mid man banta ha. Yeah chart Kuch Chhoti Se swings per banta hai yani ke is Mein Maximum 2 se 3 swings bahut hi small Sewing hoti hain aur kaun consolidate Karta Hua Breakout kr jata hai
How to spot Pennant Chart Pattern.Pennant Chart Pattern ko draw kerna k liye trader price k swing high aur swing low ko trend lines sa jorta ha. Is pattern k valid hona k liye zarori ha ak line positive slope ki aur dosri negative slope ki honi chaheye aur dono trend lines ak point per ak dosra ko cross kerna b zarori ha.Pennant chart pattern price consolidation kay bad continuation laita hay. Is liye hamain is pattern ko hamain seful banany kay liye chart per deep analysis karny party hain. Ham ager is chart ko intra day main bhi daikhain yo ye mil jata hay. Laikin is pattern ki mazeed trend continuation strength jan'na bahut important hota hay.
Explain Bull Pennant Chart Pattern:Bullish Pennant Chart Pattern price k bullish trend k mid man banta ha, jo traders ko bullish trend k mazeed continue rehna ka signal deta ha. Ye cahrt pattern currency pairs aur commodities k price chart man commonly banna wala chart pattern ha.
Trading Method of Bullish Peanut Chart Pattren.
Bullish Pennant Chart Pattern per trading k liye zarori ha k trader is pattern k complete hona ka wait kara. Jab is pattern man price upper trend line k pass a jae aur price candle ka close upper trend line k oper de da to is sa breakout ki confirmation ho jati ha. Lakin breakout per trade risky hona ki waja sa trader ko price ka upper trend line ko retest kerna ka wait kerna chaheye. Jab price retest ki confirmation de da to is per trader ko ""buy ki trade"" active kerni chaheye.
Limites .Bullish Pennant Chart Pattern per trading k doran trader ko Stoploss price k last swing low per place kerna chaheye aur Take Profit ko next resistance levels per Tp-1, Tp-2 aur Tp-3 ker k place karen.
Explain Bear Pennant Chart Pattern.Bearish Pennant Chart Pattern price k bearish trend k mid man banta ha, jo traders ko bearish trend k mazeed continue rehna ka signal deta ha. Ye cahrt pattern currency pairs aur commodities k price chart man commonly banna wala chart pattern ha.
Trading Method Bearish Pennant .
Bearish Pennant Chart Pattern per trading k liye zarori ha k trader is pattern k complete hona ka wait kara. Jab is pattern man price lower trend line k pass a jae aur price candle ka close lower trend line k nicha de da to is sa breakout ki confirmation ho jati ha. Lakin breakout per trade risky hona ki waja sa trader ko price ka lower trend line ko retest kerna ka wait kerna chaheye. Jab price retest ki confirmation de da to is per trader ko ""sell ki trade"" active kerni chaheye.
Entry Levels
Bearish Pennant Chart Pattern per trading k doran trader ko Stoploss price k last swing high per place kerna chaheye aur Take Profit ko next support levels per Tp-1, Tp-2 aur Tp-3 ker k place karen.

تبصرہ
Расширенный режим Обычный режим