Rounding Bottom CandleStick Pattern Kai hai aur kaisy use kar sakty hain?

No announcement yet.
`
X
  • وقت
  • دکھائیں
Clear All
new posts
  • #1 Collapse

    Rounding Bottom CandleStick Pattern Kai hai aur kaisy use kar sakty hain?
    Aslam u alaikum,

    Dear forex member umeed karta hun aap sab khairiyat se honge dear members Forex trading main market ki movement ko samjhny k liy chart pattern ki buht importance ha. In patterns main round bottom aik important pattern hai. Ager ap is pattern ki understanding lay laity hain to ap ki trading decisions making accuracy increase ho jati hai. Aj main ap say round bottom chart pattern ka knowledge share krna chata hoon.


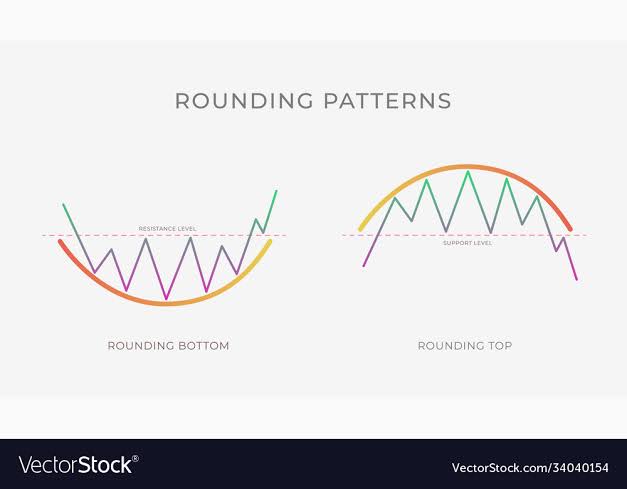
    How to identify round bottom pattern:

    Dear friends, Jab market downward movement krti howi nechy at hai, aur dobara upward movement start kr daiti hai, is slow movement ki waja say, aik round shape banti hai, is liy, is pattern ko rounding bottom pattern kehty hain.


    Yah pattern is waja say banta hai qk jab market downward movement krti hai lakin support level ko break no kr sakti, to round bottom pattern banta hai. Support level per aa kr market movement slow ho jati hai. Is slow movement ki waja say chart pattern round shape me banta hai. Is liy is pattern ko round bottom pattern kehty hain.

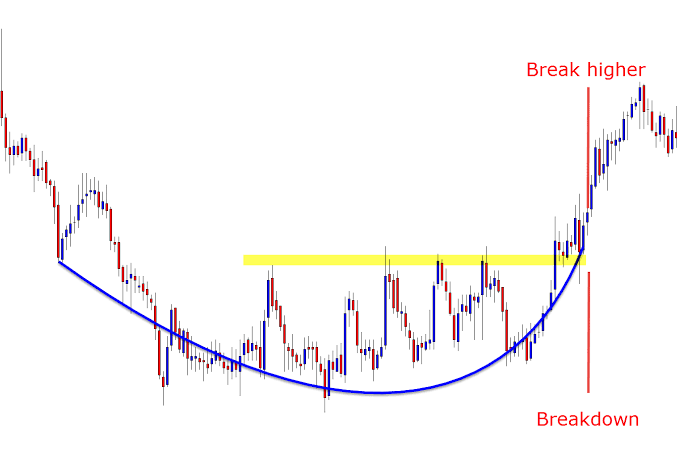
    How to trade on round bottom pattern formation:

    Dear forex members, round bottom pattern market k aik strong support level k oper banta hai qk market is level ko break ni kr sakti, to yah ap ko, aik buying opportunity provide krta hai.


    Money management:

    Dear forex members, Forex trading aik risky business hai, is me ap ko kabi bi, aik pattern daikh k trade ni lagani chaiy, Bal k aik aur confirmation zaror lay laini chaiy. Is tarah ap nuksan say bach sakty hain. Risk to reward ratio ko follow karke hi ap long term trading kar sakte hain.
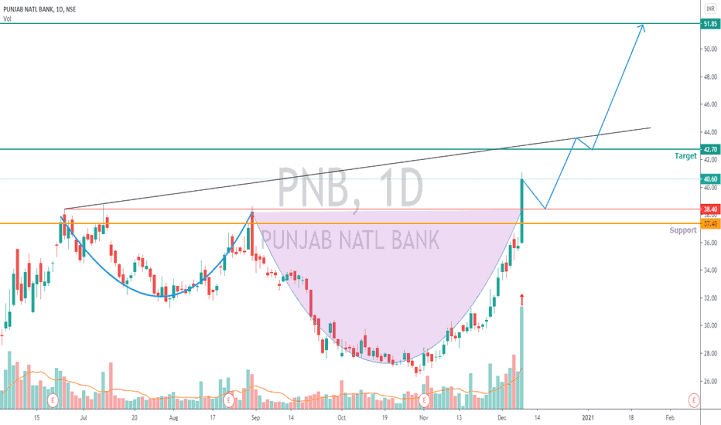
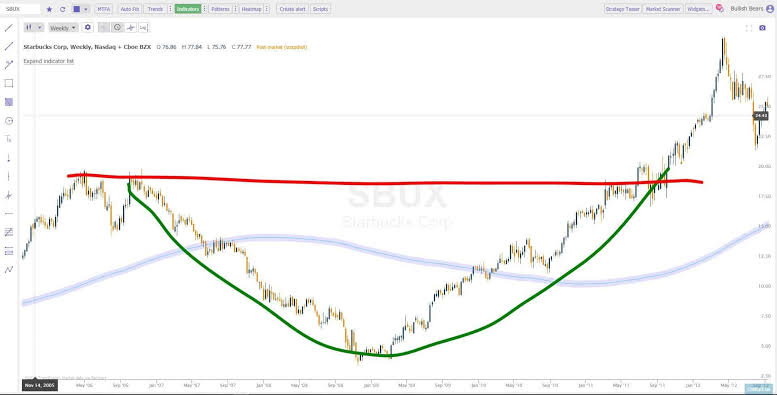
    Chart:

    Dear forex members, Nechy diy gay chart me ap clearly round bottom chart pattern ko daikh sakty hain. Agr ap is pattern ki clear understanding lay laity hain to ap ko trade krny main buht asani hogi.

    Ap Ka aik thanks bohat zrori ha
  • <a href="https://www.instaforex.org/ru/?x=ruforum">InstaForex</a>
  • #2 Collapse

    Re: Rounding Bottom CandleStick Pattern Kai hai aur kaisy use kar sakty hain?

    shooting star candlestick pattern aik technical chart pattern hai .yeh bearish candlestick pattern bhe kehlata hai.es pattern ki nishani ye hai keh es pattern ki candles ka long upper shadow small or little lower shadow real body of candles aur yeh pattern din ke end per hamein market mein nazar ata hai.yeh pattern hameiun uptrend ke baad nazar ata hai.yeh pattern hamein tub nazar ata hai jub aik session band aur dosra open hone wala hota hai.price advance period ke waqt hamein es pattern ki candles banti nazar ati hain. es pattern ki opening price eski closing price ke shooting star candle ki real body ke dugney size ke equal hoti hai.real body ke neechey koi shadow nazar nhi ​​ata.


    Trading With Shooting Star Candlesitck !


    Hshooting star potential price ke top aur reversal ko zahir karta hai.dear brother yeh pattern three candles per mushtamil hota hai.shooting star candlestick pattern inverted hammer pattern ki tarah nazar ata hai.but inverted hammer downtrend mein paya jata hai jub keh shooting star uptrend mein paya jata hai.es pattern ki candles ki lower body small aur wick bhe small hoti hai.ab shooting star candle ki long upper wick represent kjarti hai keh es time period per market mein buyers ka pressure hai lakin phir lower small wick ki vaja se Seelers pressure ko increase karna start kar dety hain aur es tarah market per sellers ka control a jata hai es liye hum es pattern ko reverse of bearish pattern kehtey hain.es tarah trader es pattern ko identify karke es per apni trade open kar saktey hain.


    ​Limitation?

    es pattern ki single bullish candle market trend ko control nhi kar sakti aur phir sellers market ka conbtrol hasil kar letey hain
    Like tu banta hay ik🙏
    • #3 Collapse

      Re: Rounding Bottom CandleStick Pattern Kai hai aur kaisy use kar sakty hain?

      What Is a Rounding Bottom?


      aik ghalat takhmeenah neechay takneeki tajzia mein istemaal honay wala chart patteren ho sakta hai aur usay qabil qader harkato ki aik series se jana jata hai jo khaka nigari se" u" ki shakal banati hai. ghalat takhmeenah botoom area unit jo neechay ki taraf barhay hue rujhanaat ke oopri hissay mein paaya jata hai aur taweel maliyat ki naqal o harkat mein ulat jane ki nishandahi karta hai. is patteren ka time frame kayi hafton se kayi } mahino tak mukhtalif hoga aur bohat se taajiron ke zareya usay aik ghair mamooli baat samjha jata hai. misali tor par, hajam aur qader wheel mein harkat kar satke hain, jahan bhi hajam qader ki karwai ki tasdeeq karta hai .

      How a Rounding Bottom Works


      aik ghalat takhmeenah neechay ki zahiri shakal cupp aur handle ke patteren ki terhan hai, taham" handle" hissay ke earzi neechay ki taraf rujhan ki mahaarat nahi rakhta hai. ghalat takhmeenah ke neechay ki ibtidayi girty hui dhalwan faraham karne se kahin ziyada associ at ki nishandahi karti hai, jo stock ki qeemat ko kam karne par majboor karti hai. associ at oopar ki janib rujhan ki muntaqili is waqt hoti hai jab sarfeen kabhi kabhar qeemat par market mein daakhil hotay hain, is se stock ki maang mein izafah hoga. aik baar ghalat takhmeenah neechay mukammal honay ke baad, stock toot jata hai aur –apne naye oopar ki janib rujhan mein jari reh sakta hai. ghalat takhmeenah neechay ka chart patteren aik misbet market ke ulat jane ki alamat hai, jis ka matlab hai sarmaya daarana tawaquaat aur raftaar, basorat deegar jazbaat ke tor par kaha jata hai, ilaqay ki ikai qadam bah qadam mayoosi se umeed parasti ki taraf muntaqil hoti hai .

      A Rounding Bottom Chart Example


      basri mamaslat aur pyaale jaisi shakal ke paish e nazar ghalat hisaab karne walay neechay ke chart ke patteren ko izafi tor par tashtari neechay kaha jata hai. baazyabi ki raqam, bohat hi neechay ki taraf mamaslat rakhti hai, ko yakja honay mein mahino ya saal lag satke hain. lehaza, sarmaya karon ko mumkina tor par taweel sabr ko zehen mein rakhna chahiye taakay dastyab maliyat ki mukammal vasuli ki tareef ki ja sakay .


      Parts of a Rounding Bottom Chart


      ghalat takhmeenah ke neechay chart ko kayi ahem ilaqon mein taqseem kya ja sakta hai. sab se pehlay, pichla rujhan stak ke ibtidayi nuzool ko is ke kam honay ki taraf zahir karta hai. tasweerai tor par, kami ke aaghaz mein commerce ka hajam sab se ziyada ho ga is liye is mein kami aaye gi kyunkay hasas ki maliyat ki satah kam ho jati hai aur patteren ki tashkeel se bohat susti hoti hai. chunkay stock theek ho jata hai aur patteren ko mukammal karne ki taraf barhta hai, is liye hajam barhay ga kyunkay sarmaya car aik baar phir hasas kharedtay hain. ibtidayi kami ke aaghaz se pehlay aik baar jab stock ki maliyat maliyat ke oopar band hojati hai to ghalat takhmeenah neechay –apne kam maqsad se bahar hojata hai. aik intehai ghalat hisaab ke neechay chart patteren mein kmrshlzm ka hajam misali tor par stock ki maliyat ki simt ki pairwi karta hai ( aur tasdeeq karta hai ), taham yeh achi miqdaar ke qabil artbat ka maalik hai. aksar, commercial azm ka hajam aik baar –apne kam tareen maqsad par pahonch jata hai jab share ki maliyat mushtarqa tor par apni teh tak pahonch jati hai. darj kardah hasas ki miqdaar aam tor par zawaal ke aaghaz mein urooj par pahonch jati hai aur aik baar jab stak apni pichli bulandi par pahonch jata hai to is nuqta nazar par hajam bherne ke sath .
      • <a href="https://www.instaforex.org/ru/?x=ruforum">InstaForex</a>
      • #4 Collapse

        Rounding Bottom Candlestick Pattern: A Comprehensive Guide

        1. Introduction


        Rounding bottom candlestick pattern ek technical analysis tool hai jo traders ko market reversal ki pehchaan karne mein madad karta hai. Yeh pattern aksar long-term trends ke dauran dekha jata hai aur iska formation market ke bearish se bullish phase mein transition ko darshata hai.
        2. Rounding Bottom Pattern Ki Pehchaan


        Rounding bottom pattern ka shape ek U ki tarah hota hai. Yeh pattern tab banta hai jab price dheere dheere neeche ki taraf jata hai, phir dheere dheere upar ki taraf aata hai. Is pattern ki shuruaat generally ek bearish trend ke baad hoti hai, jahan price ne apni lowest point tak pahunchne ke baad stable hona shuru hota hai.
        3. Pattern Ki Duration


        Rounding bottom pattern ki duration aam tor par kuch mahine tak hoti hai. Yeh pattern tabhi effective hota hai jab yeh longer time frames (daily, weekly) par banta hai. Iska matlab yeh hai ke traders ko is pattern ko dekhne ke liye patience rakhna padega.
        4. Volume Ka Role


        Is pattern ke dauran volume ka bhi khayal rakhna zaroori hai. Jab pattern banta hai, volume dheere dheere badhta hai, khas tor par jab price apne lowest point se nikalta hai. High volume bullish confirmation ke liye zaroori hai.
        5. Key Characteristics


        Rounding bottom pattern ki kuch khasiyatain hain:
        • Pehla, yeh pattern gradual change ko darshata hai.
        • Doosra, is pattern ka formation ek stable base ke saath hota hai.
        • Teesra, is pattern ke dauran price ki volatility kam hoti hai.
        6. Entry Points


        Rounding bottom pattern ki entry point ko identify karna important hai. Jab price apne highest point tak pahunchti hai aur iske baad ek clear bullish signal milta hai, tab traders ko position lene ka mauka milta hai. Is point par price breakout karti hai, jo bullish momentum ko darshata hai.
        7. Stop Loss Ka Istemaal


        Traders ko stop loss set karna chahiye jab wo rounding bottom pattern ka istimaal kar rahe hote hain. Stop loss ko pattern ke lowest point ke thoda neeche set karna chahiye taake unexpected price movement se bacha ja sake.
        8. Target Price


        Target price ka tayin karne ke liye, traders ko pattern ke height ko calculate karna chahiye. Yeh height ko breakout price se add karke target price nikaalna chahiye. Isse traders ko potential profit ka andaaza hota hai.
        9. Confirmation Signals


        Rounding bottom pattern ki effectiveness ko confirm karne ke liye, traders ko dusre indicators ka bhi istimaal karna chahiye. Jaise ki moving averages, RSI (Relative Strength Index), aur MACD (Moving Average Convergence Divergence) indicators. Yeh confirmation signals bullish trend ko mazid taqat dete hain.
        10. Psychological Factors


        Market psychology ka bhi is pattern par asar hota hai. Jab traders rounding bottom pattern ko dekhte hain, to unmein ek confidence ka ahsas hota hai jo bullish trend ko support karta hai. Yeh confidence market mein buying pressure ko barhata hai.
        11. Rounding Bottom Aur Market Trends


        Rounding bottom pattern ko market trends ke context mein dekhna zaroori hai. Agar overall market bullish hai, to yeh pattern jyada effective hota hai. Lekin agar market bearish hai, to traders ko cautious rehna chahiye.
        12. Practical Example


        Chaliye ek practical example dekhte hain. Agar kisi stock ka price 100 se 50 tak girta hai, phir dheere dheere 70, 80, 90 tak badhta hai aur phir 100 ke upar breakout karta hai, to yeh ek rounding bottom pattern banata hai. Is example mein, 100 ka level entry point hai aur stop loss 50 ke neeche hoga.
        13. Common Mistakes


        Traders ko kuch common mistakes se bachna chahiye jab wo rounding bottom pattern ka istimaal karte hain. Inmein premature entry, volume ka ignore karna, aur stop loss set na karna shamil hain. Yeh mistakes potential losses ko barha sakti hain.
        14. Conclusion


        Rounding bottom candlestick pattern ek powerful tool hai jo traders ko market reversal ki pehchaan karne mein madad karta hai. Is pattern ko samajhna aur iske sahi istemal se traders ko profitable trades karne ka mauka mil sakta hai. Is pattern ko dusre technical indicators ke saath mila kar use karna behtar hai, taake risk management aur accuracy barh sake. Trading mein patience aur discipline zaroori hai, aur rounding bottom pattern is approach ka ek aham hissa hai.

        اب آن لائن

        Working...
        X