Bars candlestick kea hota ha
X
  • وقت
  • دکھائیں
Clear All
new posts
  • #1 Collapse

    Bars candlestick kea hota ha
    Aoa

    Dear members aj ka hamra ju topic ha wo ha bar's candlestick kea hoti ha trading kliye icc ka janna bahut zaruri hora have tb he ja ke hum achy trader bann skty han lihaza haum ko chahiye yahan zdya time invest Karen

    Click image for larger version

Name:	images (1).png
Views:	2
Size:	3.8 کلوبائٹ
ID:	12556756

    generally grouped), in the form of vertical or horizontal rectangular bars, where the length of bars are proportional to the measure of data. They are also known as bar charts. Bar graphs are one of the means of data handling in statistics.
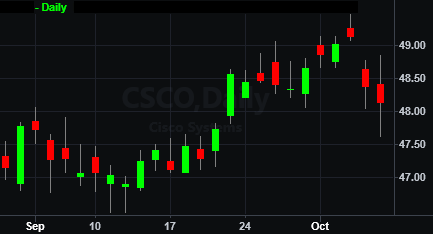
    Bar chart humy prices k bary main ek bar ki shakal main information dety hain bar ak vertical seedhi line hota hai jo. Price movement ko show krta hai jab k bar k right side par ak horizental short line hoti hai jisko bar ki right arm bhi kaha jata hai ye bullish bar main closing price ko show karta hai. Jab k bearish bar main opening price ko show karti hai or left side pay horizental short line hoti hai jo k left arm kehlati hai ye arm bullish bar main opening price jab k jab k bearish bar m closing price show karti hai bar ki arms k uper. Or neechy bar ki length hoti hai jo k deta hai kisi given time ki opening ya closing or high & low price btata hai. jab k bar ki length is bat ko show karti hai k price kitni uper or neechy ja chuki hai. Bar chart technical analysis main bhi helpful hoty

    Click image for larger version

Name:	images (2).png
Views:	1
Size:	10.6 کلوبائٹ
ID:	12556757


    changes over time. Line charts are created by plotting a series of several points and connecting them with a straight line. Line charts are used to track changes over short and long periods.
    Line chart kisi bhi chez ki graphical representation ko kehty hain ye chart different time periods ki price ko aps

    Click image for larger version

Name:	images (3).png
Views:	12
Size:	7.4 کلوبائٹ
ID:	12556758

    Tammm member kindly zarur read out key Karen icc cy bahut e profit hi skta ha hum sb ko well trader banny kliye mehnat ki zarurt ha
  • <a href="https://www.instaforex.org/ru/?x=ruforum">InstaForex</a>
  • #2 Collapse

    BAR CANDLESTICK PATTERN:-
    Bars candlestick ek prakar ke technical analysis ka tool hota hai jo ki stock market ya anya financial market ke price movements ko represent karne ke liye istemal hota hai. Bars candlestick charts traders aur investors ke liye ek visually informative tarike se market data ko darust karne me madadgar ho sakta hai.
    BAR CANDLESTICK PATTERN K HISSEY:-
    Bars candlestick charts me har ek candlestick ek specific time period ki price movement ko darust karta hai. Har ek candlestick chart me do hisse hote hain: Body (Sharir): Candlestick ka bada bhag jo opening price aur closing price ke beech ki range ko darust karta hai. Agar closing price opening price se upar hota hai, to candlestick typically green ya white color me hota hai, isse bullish candle kehte hain. Agar closing price opening price se niche hota hai, to candlestick typically red ya black color me hota hai, isse bearish candle kehte hain. Wicks (Chhadiyan): Candlestick ke upper aur lower side par vertical lines jo high price aur low price ko darust karte hain. Upper wick high price ko darust karta hai aur lower wick low price ko darust karta hai.
    BAR CANDLESTICK PATTERN K FEATURES:-
    Price Representation: Bars candlestick charts price movements ko visually darust karte hain. Har ek candlestick ek specific time period (jaise ki ek din, ek ghanta, ek hafta, etc.) ki price movement ko darust karta hai. Isse traders ko ek samay par hone wale price changes ka accha idea milta hai. Bullish Aur Bearish Signals: Candlestick charts bullish (price increase) aur bearish (price decrease) signals ko dikhate hain. Bullish candlesticks typically green ya white hote hain aur bearish candlesticks typically red ya black hote hain. Isse traders ko market sentiment ka pata lagta hai. Wick Aur Body: Har ek candlestick ke upper aur lower wicks hote hain jo high price aur low price ko darust karte hain. Candlestick ka body opening price aur closing price ke beech ki range ko darust karta hai. Wick aur body ke combination se traders ko price volatility aur reversal signals ka pata chalta hai. Candlestick Patterns: Bars candlestick charts me kuch specific patterns hote hain jaise ki doji, hammer, shooting star, engulfing patterns, etc. In patterns ko samajh kar traders market movements ko predict kar sakte hain. Time Frames: Traders candlestick charts par alag-alag time frames (jaise ki daily, hourly, 15-minute, etc.) select kar sakte hain, jo unke trading strategies ke anukool ho. Trend Identification: Candlestick charts se trend identification aasan hota hai. Uptrend, downtrend, ya sideways trend ko candlestick patterns ke madhyam se samjha ja sakta hai. Support Aur Resistance Levels: Candlestick charts traders ko support aur resistance levels ka pata lagane mein madad karte hain. Support level woh price hota hai jahan se asset ka price neeche nahi girta aur resistance level woh price hota hai jahan se price upar nahi jata. Historical Data: Candlestick charts historical price data ko darust darust tarike se represent karte hain, jo traders ko past performance aur potential future movements ka analysis karne mein madadgar hota hai.
    • #3 Collapse

      Introduction.Dear friend umeed hy k ap sb theak hon gy.aj jo ap ny post share mi hy wo bhot he eham hy aor bar candle stick pattern k bary main mazeed main ap sy kuch maloomat share kroon ga.umeed hy ap ko phr k is say bhot faida ho ga.Definition.aik androoni baar candle takneeki tajzia mein ahmiyat rakhti hai kyunkay yeh market mein istehkaam ya ghair faisla kin daur ki numaindagi karti hai. qeemat ke faisla kin iqdaam se pehlay yeh mojooda rujhan mein mumkina waqfay ki nishandahi kar sakta hai, jisay tajir apni tijarti hikmat amlyon ka andaza laganay aur mansoobah bandi karne ke liye istemaal kar satke hain .Three days of candle stick pattern trading.teen roza candle stick trading pitrnzshaam ka sitara aik bearish reversal patteren hai jahan pehli candle stick up trained ko jari rakhti hai. doosri mom batii ka faasla oopar jata hai aur is ka jism tang hota hai. teesri candle stuck pehli candle stuck ke wast point ke neechay band ho jati hai. subah ka sitara aik taizi se ulatnay wala patteren hai jahan pehli candle stuck lambi aur siyah / surkh rang ki hoti hai, is ke baad choti mom batii stand hoti hai jo neechay gir gayi hoti hai. yeh aik lambi jism wali safaid / sabz mom batii se mukammal hoti hai jo pehli mom batii ke wast ke oopar band hoti hai .Characteristics.1.baar chart ke andaraik androoni baar jo ziyada time frame par bantaa hai is mein ziyada" mutaliqa" hota hai sirf is wajah se ke patteren ko ban'nay mein ziyada waqt lagta hai. is ka matlab hai ke mazeed tajir is ki tashkeel mein sargaram amal thay .2. Trading market mein bohat acha kaam karta hai .agar aap androoni baar candle stuck patteren ki bunyaad par tijarat karne ka mansoobah bana rahay hain, to aap ko hamesha market ka rujhan talaash karna chahiye. yeh hikmat e amli katay hue bazaar ya side way market mein kaam nahi karti kyunkay aap ko aasani se rokkk diya jaye ga .3. Pattern break out par baar set up ke andarbehtareen androoni baar set up pichlle patteren se break out ke baad bantay hain. is ki wajah saada hai. aik rujhan mein, istehkaam is waqt shuru hota hai jab longs munafe lainay ( baichnay ) ka faisla karte hain .is ki wajah se market peechay hatt jati hai, jahan naye kharidaron ko khareedna parta hai, jis se qeematein buland rehti hain. andar baar patteren dinon, hafton ya yahan tak ke mahino tak jari rehta hai jab tak ke naye khredar aik baar phir farokht knndgan se agay bherne aur market ko ouncha karne ke qabil nah hon .zail mein hindustaan yoni liver ke rozana time frame par ban'nay walay baar patteren ke andar taizi ki aik umdah misaal hai. yeh dar haqeeqat aik tijarti set up hai jisay yahan daily price action par bulaya gaya tha aur is ne ab tak khoubsurti se kaam kya hai .andar ke sath torna4. mother candle aur andar baar candle ka sizemother baar se mawazna karne wali androoni baar ka size bohat ahem hai. mere tajarbay mein, mother baar ki nisbat andar ki baar jitni choti hogi, aap ke munafe bakhash tijarti set up ka tajurbah karne ke imkanaat itnay hi ziyada hon ge .5. androoni baar trade mein daakhil hona, bahar niklana aur nuqsaan ko roknadaakhil karna : – jab qeemat ki karwai androon candle stuck chart ke patteren ko mukammal karti hai, to aap ko ansayid baar cansodulation range ke nichale aur ounchay ko nishaan zad karna chahiye. yeh do sthin mumkina tijarat ko mutharrak karne ke liye istemaal hoti hain .yaad rakhen, androoni mom batii hamein hatmi break out aur waqfay ki simt mein range se bahar jari rehne ke imkaan ki taraf ishara karti hai, taham, yeh hamein asal harkat se pehlay range ke zariye break out ki simt ke baray mein maloomat nahi deti ha
      • <a href="https://www.instaforex.org/ru/?x=ruforum">InstaForex</a>
      • #4 Collapse

        BAR Candle Example:- Bars candle ek prakar ke specialized investigation ka instrument hota hai jo ki securities exchange ya anya monetary market ke cost developments ko address karne ke liye istemal hota hai. Bars candle graphs brokers aur financial backers ke liye ek outwardly enlightening tarike se market information ko darust karne me madadgar ho sakta hai. BAR Candle Example K HISSEY:- Bars candle outlines me har ek candle ek explicit time span ki cost development ko darust karta hai. Har ek candle outline me do hisse hote hain: Body (Sharir): Candle ka bada bhag jo opening cost aur shutting cost ke beech ki range ko darust karta hai. Agar shutting cost opening cost se upar hota hai, to candle regularly green ya white consider me hota hai, isse bullish flame kehte hain. Agar shutting cost opening cost se specialty hota hai, to candle commonly red ya dark consider me hota hai, isse negative light kehte hain. Wicks (Chhadiyan): Candle ke upper aur lower side standard vertical lines jo exorbitant cost aur low cost ko darust karte hain. Upper wick exorbitant cost ko darust karta hai aur lower wick low cost ko darust karta hai. BAR Candle Example K Highlights:- Value Portrayal: Bars candle outlines cost developments ko outwardly darust karte hain. Har ek candle ek explicit time span (jaise ki ek noise, ek ghanta, ek hafta, and so on) ki cost development ko darust karta hai. Isse dealers ko ek samay standard sharpen ridge cost changes ka accha thought milta hai. Bullish Aur Negative Signs: Candle diagrams bullish (cost increment) aur negative (cost decline) signals ko dikhate hain. Bullish candles regularly green ya white hote hain aur negative candles commonly red ya dark hote hain. Isse brokers ko market opinion ka pata lagta hai. Wick Aur Body: Har ek candle ke upper aur lower wicks hote hain jo exorbitant cost aur low cost ko darust karte hain. Candle ka body opening cost aur shutting cost ke beech ki range ko darust karta hai. Wick aur body ke mix se dealers ko cost unpredictability aur inversion signals ka pata chalta hai. Candle Examples: Bars candle outlines me kuch explicit examples hote hain jaise ki doji, hammer, falling star, immersing designs, and so forth. In designs ko samajh kar brokers market developments ko anticipate kar sakte hain. Time spans: Brokers candle outlines standard alag time spans (jaise ki everyday, hourly, 15-minute, and so on) select kar sakte hain, jo unke exchanging techniques ke anukool ho. Pattern Recognizable proof: Candle diagrams se pattern ID aasan hota hai. Upswing, downtrend, ya sideways pattern ko candle designs ke madhyam se samjha ja sakta hai. Support Aur Obstruction Levels: Candle outlines brokers ko support aur obstruction levels ka pata lagane mein madad karte hain. Support level woh cost hota hai jahan se resource ka cost neeche nahi girta aur opposition level woh cost hota hai jahan se cost upar nahi jata. Authentic Information: Candle diagrams authentic cost information ko darust tarike se address karte hain, jo merchants ko past execution aur potential future developments ka examination karne mein madadgar hota hai.

        اب آن لائن

        Working...
        X