Asalamualikum dear members ummed Hy ap sb khariyat Sy hon gy or forex py mehnat kr k kamyabi hasil kr rhy hon gy.dear members aaj hm matching low candlestick pattern k bary mein baat krein gy.
What is matching low candlestick pattern :
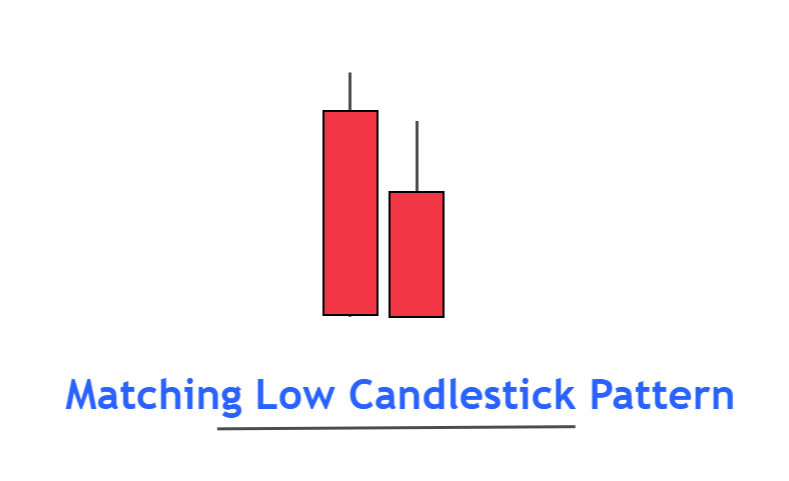
Dear forex market Mein Jb Hm kam kr rhy Hoty Hain To Hamein us mein Soch smjh k kam krna hota hy or different candles tricks Ko Daikh kr trading krna Hoti Hy. Forex market Mein different pattern ban rhy Hoty Hain hr pattern ko ap achy tariqy sy identify kr skty hain. matching Low pattern price mein nichly state pr bnney wala aik two black Sy Mil kr bnney wala stand reversal pattern hy. Pattern mein dono Black or red candles same sport level ko down stair pr touch Krti Hain or Wapis us up side pr rebound Ho Jti Hain. Jo stand reversal ka Sabab Bnti Hain pattern k up site pr candles k high zaruri Nai hy Lekin dono candles k bottom hony chaheay sport level or resistance level ko achy tarike sy smjh skty hain or To ap es market Mein successful trading kr sakty hain. Ap market Mein achi entry Ly kr trading Krein Jb ap market mein achi entry lty hain to ap ko Acha profit mil Jta hy.or hm successful ho skty Hain.

Identification :
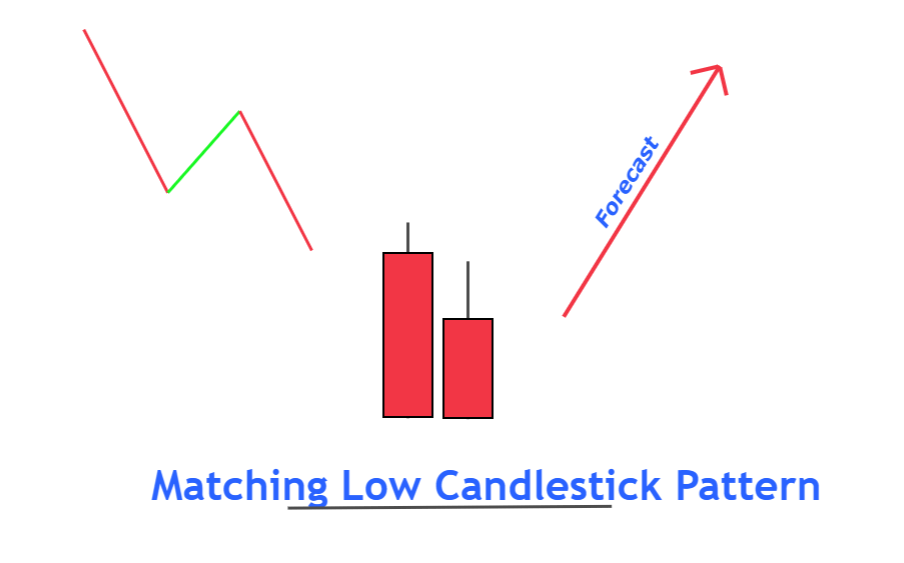
Dear members Forex market Mein Jb ap kam Krty Hain To matching low candlesticks pattern price ke bottom area Mein hony ke wja sy aik stand reversal ka pattern hy.
yeh pattern 2 candles pr mustamil hota hy jis mein dono candles black color ke hoti hy.
pattern ke first and second candles ke bottom ya lower price same hoti hy.

Explanation of pattern :
Dear member forex market mein Jb hm kam kr rhy hoty hain to us mein matching low and sticks pattern k liye zaruri hy k price chart k bottom Hona chaheay. Jb K pattern to candles k aik Bullish trend reversal pattern hy. Jis ke first candle aik black candle hoti hy jo yeh zahir Krti Hy. jab k second candles b same black candles hoti hy. jo trend reversal ka Sabab bnti hy. pattern ke dono candles ka bottom same point pr hota hy Jab candles ka upper side pr length Ka Hona Koi important limit Ka Hona zaruri Nai hy. Agr ap market mein proper pattern ko achi tariqy sy identify krty hain. To ap ko bht zyada benefit Milta hy or Market Mein different important analysis per completely study Krty hain To ap es market mein zyada Sy zyada advantages ko increase kr saky hain ap ko Hmesha Koshish Krna Hogi k proper market ko time dy, or best point pr entry Ly Jb ap market ko judgement kr rahy hoty hain. to us mein ap ko bhut zyada entries achi mil rahi hoti hy. jis mein ap achi earning kr sakty hain.
Trading strategy :
Dear friends forex market mein Jb ap kam kar rahy hote hain to us mein ap ko achi planning Kar k kam krna hota hy. Market ko achi tarike sy focus krna hota hy matching lock and stick pattern per trading k liye important hy k price market Ke current condition main bottom level pr trade kar rahi hy. yeh pattern wise b eik strong sport level pr bnta hy.pattern pr trade entry proper risk management k hisab sy honi chaheay agr ap es mein entry Ly kr trading karty hain to ap ko Acha profit Mil Jta hy. es liye ap ko Koshish Krna Hogi k ap zyada Sy zyada achy experience k sath kam Krein, or money management k sath kam Karein Tkey ap ko es market Mein Acha result miley.or hm successful ho skty Hain.

What is matching low candlestick pattern :
Dear forex market Mein Jb Hm kam kr rhy Hoty Hain To Hamein us mein Soch smjh k kam krna hota hy or different candles tricks Ko Daikh kr trading krna Hoti Hy. Forex market Mein different pattern ban rhy Hoty Hain hr pattern ko ap achy tariqy sy identify kr skty hain. matching Low pattern price mein nichly state pr bnney wala aik two black Sy Mil kr bnney wala stand reversal pattern hy. Pattern mein dono Black or red candles same sport level ko down stair pr touch Krti Hain or Wapis us up side pr rebound Ho Jti Hain. Jo stand reversal ka Sabab Bnti Hain pattern k up site pr candles k high zaruri Nai hy Lekin dono candles k bottom hony chaheay sport level or resistance level ko achy tarike sy smjh skty hain or To ap es market Mein successful trading kr sakty hain. Ap market Mein achi entry Ly kr trading Krein Jb ap market mein achi entry lty hain to ap ko Acha profit mil Jta hy.or hm successful ho skty Hain.
Identification :
Dear members Forex market Mein Jb ap kam Krty Hain To matching low candlesticks pattern price ke bottom area Mein hony ke wja sy aik stand reversal ka pattern hy.
yeh pattern 2 candles pr mustamil hota hy jis mein dono candles black color ke hoti hy.
pattern ke first and second candles ke bottom ya lower price same hoti hy.
Explanation of pattern :
Dear member forex market mein Jb hm kam kr rhy hoty hain to us mein matching low and sticks pattern k liye zaruri hy k price chart k bottom Hona chaheay. Jb K pattern to candles k aik Bullish trend reversal pattern hy. Jis ke first candle aik black candle hoti hy jo yeh zahir Krti Hy. jab k second candles b same black candles hoti hy. jo trend reversal ka Sabab bnti hy. pattern ke dono candles ka bottom same point pr hota hy Jab candles ka upper side pr length Ka Hona Koi important limit Ka Hona zaruri Nai hy. Agr ap market mein proper pattern ko achi tariqy sy identify krty hain. To ap ko bht zyada benefit Milta hy or Market Mein different important analysis per completely study Krty hain To ap es market mein zyada Sy zyada advantages ko increase kr saky hain ap ko Hmesha Koshish Krna Hogi k proper market ko time dy, or best point pr entry Ly Jb ap market ko judgement kr rahy hoty hain. to us mein ap ko bhut zyada entries achi mil rahi hoti hy. jis mein ap achi earning kr sakty hain.
Trading strategy :
Dear friends forex market mein Jb ap kam kar rahy hote hain to us mein ap ko achi planning Kar k kam krna hota hy. Market ko achi tarike sy focus krna hota hy matching lock and stick pattern per trading k liye important hy k price market Ke current condition main bottom level pr trade kar rahi hy. yeh pattern wise b eik strong sport level pr bnta hy.pattern pr trade entry proper risk management k hisab sy honi chaheay agr ap es mein entry Ly kr trading karty hain to ap ko Acha profit Mil Jta hy. es liye ap ko Koshish Krna Hogi k ap zyada Sy zyada achy experience k sath kam Krein, or money management k sath kam Karein Tkey ap ko es market Mein Acha result miley.or hm successful ho skty Hain.


تبصرہ
Расширенный режим Обычный режим