Define (MACD) Indicator & Details..!

No announcement yet.
`
X
  • وقت
  • دکھائیں
Clear All
new posts
  • #1 Collapse

    Define (MACD) Indicator & Details..!
    Asslam.u.Aliakum Dosto...

    dear friends ksy hain ap sab aj hum MACD ki setting MT4 Mobile k bary mian bat krain jis k bary mian kafi sary doston nay sawal kia tha socha k ap logo k sath bo share kr dn or main umeed krtta hn k mery is topic say ap ko bhot faida hasil ho.

    (MACD) Definition:

    Dear Friends MACD ik bhot hi zabardat indicator hy jo jo trading k signals provide krta hy yeh thora lagging indicator hy pr is ki accurascy bhot hi zayada hy agr ap is ko use krty hian to is k zarey ap kafi pips win kr sakte hain.
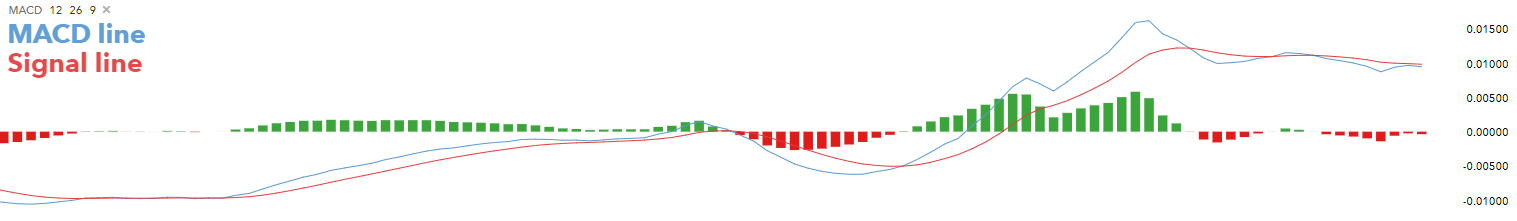
    (MACD) Indicator:

    dosto moving average convergence Divergence indicator eisa indicator hai jo aapko currently prices kay sath divergence ki shape main result provide karta hai. Jab market mein prices higher ya lower point per hoti hain liken indicators aapko isk against result show krta hai. Click image for larger version

Name:	images (2).png
Views:	2
Size:	18.2 کلوبائٹ
ID:	12556485

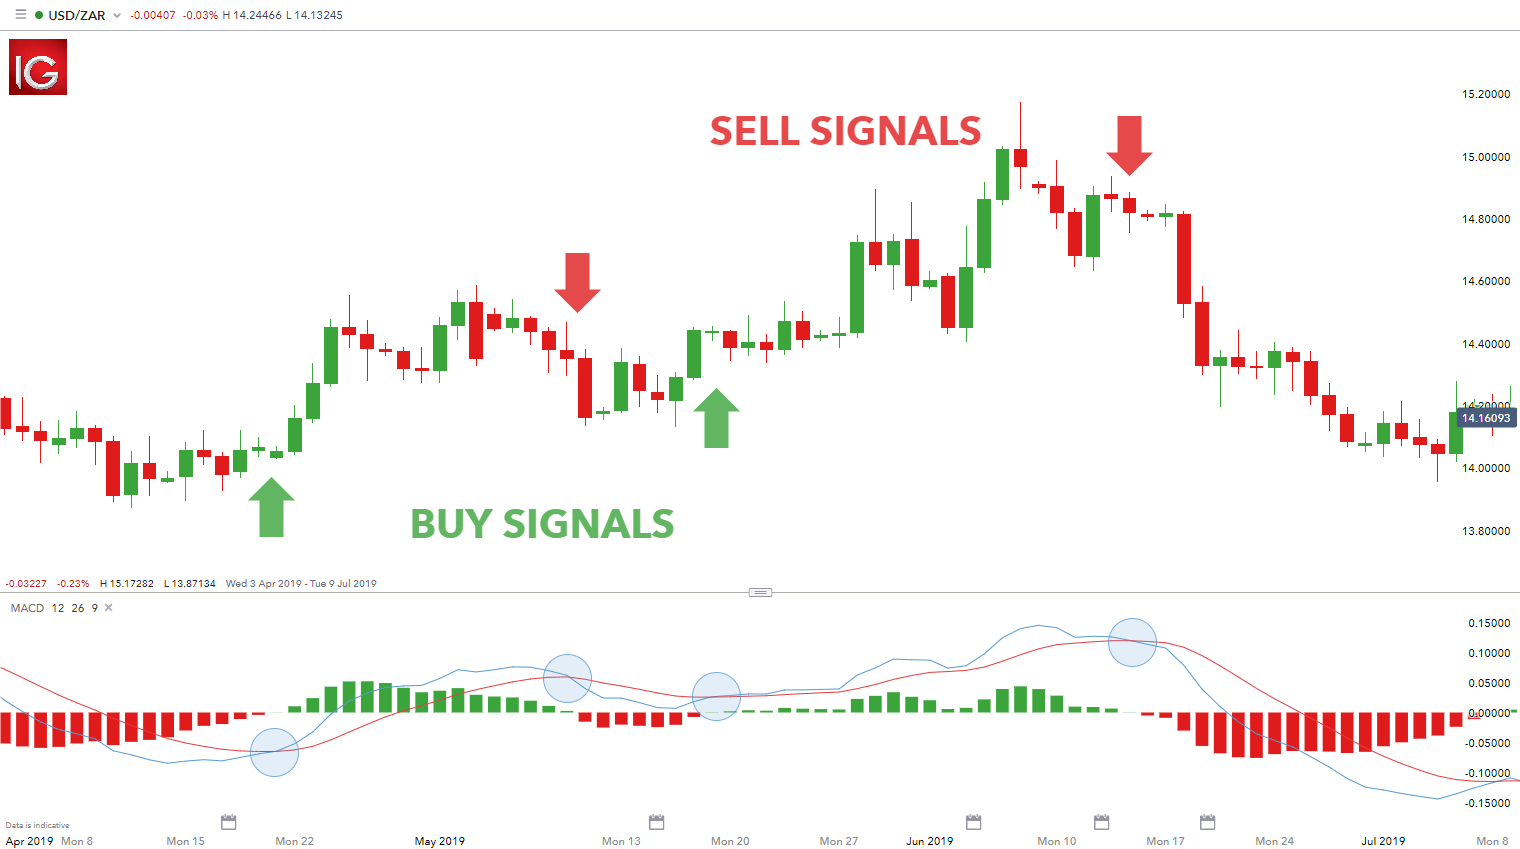
    Description Of (MACD) Indicator:

    dosto moving average convergence Divergence MACD Indicator ki further details kay liye main aapko iska trading chart share krny lga hun jo aapki learning ko zyda perfect bana sakhta hai. Ismein apni learning ko perfect bana kar apni working best bana sakhty hain.

    MACD Crossover Strategy MT4 Mobile:

    Dear Friends bhot sary doston ko MT4 mobile mian yeh problem face hoti hy k jab wo MT4 mobile k chart mian MACD ko setup krty hoin to un ko MT4 pr sirf ik hi line nazar ati Pc version ki traha do line nhin show hoti is topic mian hum log MACD ky setup k baty mian seekhain gain.

    Interpretation:


    dosto moving average convergence Divergence MACD Indicator ki interpretation bahut zyda easily understandable hoti hai. Jab trading chart main market ki prices higher point per hoti hain liken MACD aapko downtrending main information deta hai tu ya divergence ah jata hai, es halat main aapko selling krna hoti hai. Isk against jab market main lowest prices prevailing hoti hain liken MACD Indicator aapko uptrending movement show krta hai, tu us time aapko buying entry lena hoti hai. Click image for larger version

Name:	images (4).jpeg
Views:	15
Size:	25.9 کلوبائٹ
ID:	12556486
  • <a href="https://www.instaforex.org/ru/?x=ruforum">InstaForex</a>
  • #2 Collapse

    Re: Define (MACD) Indicator &amp; Details..!

    WHAT IS MACD?

    The Moving Average Convergence Divergence (MACD) is a technical indicator which simply measures the relationship of exponential moving averages (EMA).The MACD displays a MACD line (blue), signal line (red) and a histogram (green) - showing the difference between the MACD line and the signal line.
    The MACD line is the difference between two exponentially levelled moving averages – usually 12 and 26-periods, whilst the signal line is generally a 9-period exponentially smoothed average of the MACD line.
    These MACD lines waver in and around the zero line. This gives the MACD the characteristics of an oscillator giving overbought and oversold signals above and below the zero-line respectively.
    WHAT DOES MACD MEASURE?

    The MACD measures momentum or trend strength by using the MACD line and zero line as reference points:
    • When the MACD line crosses ABOVE the zero line, this signals an UPTREND
    • When the MACD line crosses BELOW the zero line, this signals an DOWNTREND

    In addition, the MACD signals buy or sell orders which are given when the two MACD lines cross over as outlined below:
    • When the MACD line crosses ABOVE the signal line, traders use this as a BUY indication
    • When the MACD line crosses BELOW the signal line, traders use this as a SELL indication

    HOW IS MACD CALCULATED?

    Most charting platforms offer the MACD indicator, and implement this calculation using the aforementioned default periods. The formula below breaks down the varying components of the MACD to make it comfortable for traders to apply.
    As mentioned previously, the MACD histogram plots the difference between the two moving average lines. The histogram fluctuates in and around the zero designation on the MACD indicator. When the MACD line is above the signal line, then the histogram will be positive. The opposite is true when the MACD line sits below the signal, whereby the histogram will plot below the zero as a negative value. A zero value on the histogram indicates a crossing over of the two moving average lines thus marking buy/sell signals.
     
    • <a href="https://www.instaforex.org/ru/?x=ruforum">InstaForex</a>
    • #3 Collapse

      Re: Define (MACD) Indicator &amp; Details..!

      MACD

      MACD is included in MetaTrader default indicator kit, so you don’t need to download it. Go to “Insert”, find “Indicators” and then “Oscillators” – and you will see the MACD. The indicator will appear in a separate window below the price chart.

      The classic settings include 12 and 26 EMAs and a signal line (SMA) with a period of 9. You can choose other parameters depending on your trading style and goals. For example, the MACD (5,35,5) is more sensitive and might be better suited for weekly charts.
      Increasing the number of periods for the signal line will reduce the number of crossover signals, helping avoid false signals. However, trade signals will occur later than they would with a shorter signal line EMA.
      The indicator can be applied to any timeframe, but it’s preferable to choose those from H1 and bigger.
      HOW THE MACD INDICATOR WORKS

      The main idea behind the MACD is that it subtracts the longer-term moving average from the shorter-term moving average. This way it turns a trend-following indicator into the momentum one and combines the features of both.
      The MACD has no bounds, but it has a zero mean, around which it tends to oscillate as the moving averages converge, intersect and diverge.
      Convergence occurs when the moving averages move towards each other. Divergence takes place when the moving averages move away from each other. The MACD histogram is above 0 when the 12-period MA is above the 26-period MA and below 0 when the shorter MA is below the longer MA. As a result, positive values of the histogram point at a bullish trend, while negative values mean a downtrend.

      HOW TO USE MACD IN FOREX TRADING

      All in all, the market is bullish when the MACD is above 0 and bearish when it’s below 0.
      The MACD provides traders with several types of signals: signal line crossovers, overbought/oversold levels, centerline crossovers, as well as divergences.
      1. SIGNAL LINE CROSSOVERS

      A bullish crossover happens when the MACD starts rising and then goes above the signal line. A bearish crossover happens when the MACD starts declining and crosses the signal line to the downside.
      The MACD works best in trends when the price range in rather narrow. A good strategy may be to establish a trend and then to use only those MACD signals which are in line with this trend.
      On the picture below, you can see that in a downtrend it’s wise to trade only negative MACD crossovers with the signal line.

      2. OVERBOUGHT/OVERSOLD LEVELS

      It’s also possible to use the MACD as an oscillator. It’s common knowledge that the market always returns to the mean and the fast MA always returns to the slow one. The bigger the divergence between the Moving Averages (the higher of the lower is the MACD histogram), the more bullish/bearish the market is and the higher the probability of the price correction that will lead the MACD back to 0.
      As a result, it’s possible to trade extreme highs/lows of the MACD as a sign that the market is overbought/oversold. As the indicator has no upper or lower limits, you should judge extremes by the visual comparison of the MACD levels. Notice that this kind of signals requires confirmation from price action or other technical indicators.
       

      اب آن لائن

      Working...
      X