Introduction:
Aslam u alaikum,
Dear forex member umeed karta hun aap sab khairiyat se honge dear members Forex trading main success k lye aur achy profit k lye learning, knowledge aur experience ka hona bohat zarori hai. Knowledge aur experience ko enhance karny k lye technical analysis bohat zarori hai. Ager ap proper technical knowledge k sath kam krty hain to ap profit hasil kr sakty hain. Forex market main trend change hoty rehty hain aur fluctuations hoti hain. Isi lye market ki movement aur trend ka idea karny k lye technical analysis bohat zarori hai. Forex trading market mein market ki movement ko daikhny k liye kuch important factors hain. In main standard deviation or average ko bohat ziada importance hai. Aj main ap say apni post main standard deviation or mean ( average ) ka knowledge share krna chahta hu.
Mean / Average in forex trading:
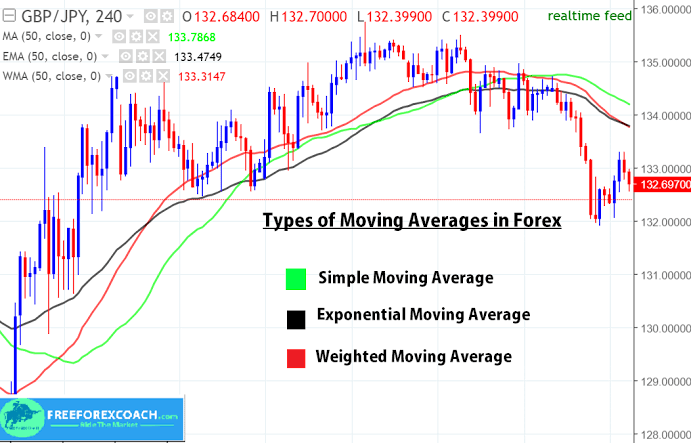
Mean ya average ap ko kisi bi time price ka average bta rahy hoty hain.Buht say indicator jesy Moving average indicator, average ki basis per ap ko market trend k bary main btaty hain. Yeh indicator candlestick ki closing / opening values ko add Kar Kay number of candlestick per divide krty hain, is ki value ko ap Average ya mean keh sakhty hain. Ap moving average indicator kisi bi time frame main laga kr, os time frame main market ki average movement k bary main market k trend aur fluctuation ka idea kar sakty hain.
What is Standard Deviation:
Forex trading main standard deviation aik variability ka ishara hai. Ye zahir karta hai k price apni average value sy kitna deviate karti hai. High standard deviation ka matlab high volatility hai. Ye instrument trend k start point aur strength ko identify karta hai. Lakin ye us ki direction ko identify nhi karta hai.
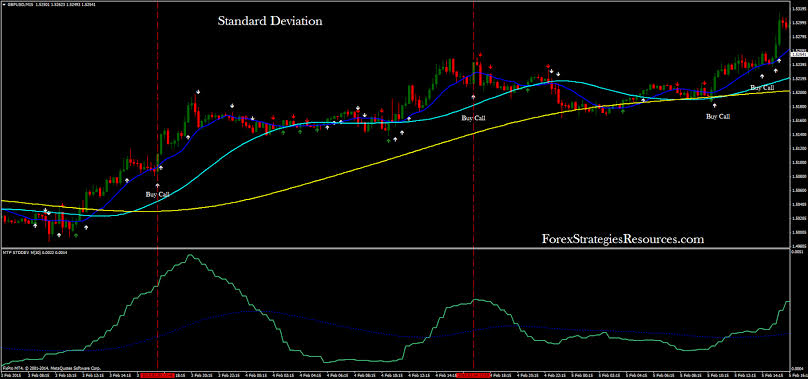
Forex trading mein “Bollinger band” aik aisa indicator hai jo ap ko standard deviation ki information provide krta hai. Bollinger band aik technical analysis hai jisy trader trend line ki planning k lye istamal karty hain, jo aik security ki simple moving average sy deviation hoti hai. Standard Deviation aur average k knowledge ki base per ap bohat achi decision making kar k trading kr sakty hain.
Standard Deviation Calculation:
Standard Deviation ki calculation krny k liye, ap mean ki value ko her closing values sy minus krty hain, or jab en answer ko total kar kay total number of values say divide karty hain, tu ap k pas standard deviation ki value aa jati hai. Forex trading main, average aur standard deviation ka knowledge ap k profit earning ratio increase ho jati hai.
Advantage of knowledge of Standard deviation and Averages in forex trading:
Forex trading main success k lye technical analysis bohat zarori hai. Isi lye standard deviation aur averages ka knowledge bohat zarori hai. Ye hmy right time p right decision lany main help karti hai. Aur istra risky trades sy bach k hum loss sy bach sakty hain. Aur acha profit earn kar sakty hain.
Aslam u alaikum,
Dear forex member umeed karta hun aap sab khairiyat se honge dear members Forex trading main success k lye aur achy profit k lye learning, knowledge aur experience ka hona bohat zarori hai. Knowledge aur experience ko enhance karny k lye technical analysis bohat zarori hai. Ager ap proper technical knowledge k sath kam krty hain to ap profit hasil kr sakty hain. Forex market main trend change hoty rehty hain aur fluctuations hoti hain. Isi lye market ki movement aur trend ka idea karny k lye technical analysis bohat zarori hai. Forex trading market mein market ki movement ko daikhny k liye kuch important factors hain. In main standard deviation or average ko bohat ziada importance hai. Aj main ap say apni post main standard deviation or mean ( average ) ka knowledge share krna chahta hu.
Mean / Average in forex trading:
Mean ya average ap ko kisi bi time price ka average bta rahy hoty hain.Buht say indicator jesy Moving average indicator, average ki basis per ap ko market trend k bary main btaty hain. Yeh indicator candlestick ki closing / opening values ko add Kar Kay number of candlestick per divide krty hain, is ki value ko ap Average ya mean keh sakhty hain. Ap moving average indicator kisi bi time frame main laga kr, os time frame main market ki average movement k bary main market k trend aur fluctuation ka idea kar sakty hain.
What is Standard Deviation:
Forex trading main standard deviation aik variability ka ishara hai. Ye zahir karta hai k price apni average value sy kitna deviate karti hai. High standard deviation ka matlab high volatility hai. Ye instrument trend k start point aur strength ko identify karta hai. Lakin ye us ki direction ko identify nhi karta hai.
Forex trading mein “Bollinger band” aik aisa indicator hai jo ap ko standard deviation ki information provide krta hai. Bollinger band aik technical analysis hai jisy trader trend line ki planning k lye istamal karty hain, jo aik security ki simple moving average sy deviation hoti hai. Standard Deviation aur average k knowledge ki base per ap bohat achi decision making kar k trading kr sakty hain.
Standard Deviation Calculation:
Standard Deviation ki calculation krny k liye, ap mean ki value ko her closing values sy minus krty hain, or jab en answer ko total kar kay total number of values say divide karty hain, tu ap k pas standard deviation ki value aa jati hai. Forex trading main, average aur standard deviation ka knowledge ap k profit earning ratio increase ho jati hai.
Advantage of knowledge of Standard deviation and Averages in forex trading:
Forex trading main success k lye technical analysis bohat zarori hai. Isi lye standard deviation aur averages ka knowledge bohat zarori hai. Ye hmy right time p right decision lany main help karti hai. Aur istra risky trades sy bach k hum loss sy bach sakty hain. Aur acha profit earn kar sakty hain.
تبصرہ
Расширенный режим Обычный режим