Harami Candlestick Pattern....

No announcement yet.
`
X
  • وقت
  • دکھائیں
Clear All
new posts
  • #1 Collapse

    Harami Candlestick Pattern....
    Aslam u alaikum,

    Dear forex member umeed karta hun aap sab khairiyat se honge dear members jab hum analysis ko study kar rahy hoty hain to candlesticks ky bary mn knowledge hasil karna bht important hota hai. Aj hum Harami Candlestick Pattern ky bary mn bat Karen gy. Lafz Harami Japanese zaban ka lafz hai jis ky meaning pregnant ky hain. Harami Candles ka format aesy hi hota hai jaisy 1 pregnant woman apny baby ko carry kiye huay ho. Harami Candlestick pattern double pattern sy ban’ny wali candlesticks hain. First candle barhi hoti hai like a women or second candle choti hoti hai like a baby. Harami Candlestick reversal signal provide karti hain. Harami Candlesticks 2 types ki hoti hain.


    1. Bullish Harami Candlestick Pattern
    2. Bearish Harami Candlestick Pattern

    1. Bullish Harami Candlestick Pattern:
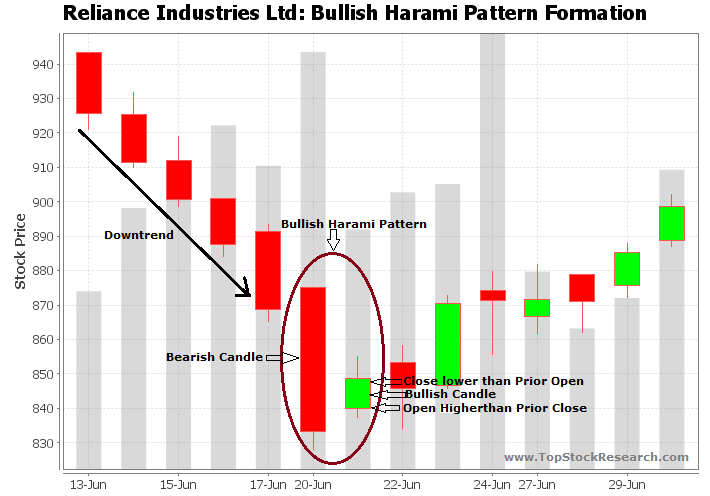
    Bullish Harami Candlestick bullish reversal ka signal deti hai. Bullish Harami Candlestick Pattern 1 long down ky baad ban’ny wala pattern hai. Yeh pattern 2 candles sy mil kar banta hai. First candle barhi hoti hai or bearish hoti hai. Next candle bullish hoti hai jis ka size chota hai. Candles ky dono taraf chota sa shadow hota hai.


    Agar iss tarah ki candles 1 down trend k baad banain to iss ko technical analysis ky rules ky mutabiq bullish consider kiya jata hai. Yani ky Bullish Harami Candlestick Pattern 1 bullish reversal pattern hai.

    2. Beariah Harami Candlestick Pattern:

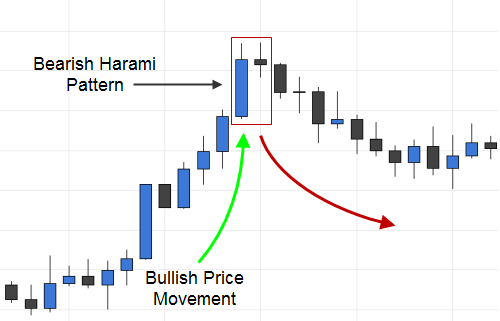
    Beariah Harami Candlestick beariah reversal ka signal deti hai. Beariah Harami Candlestick Pattern 1 long up ky baad ban’ny wala pattern hai. Yeh pattern 2 candles sy mil kar banta hai. First candle barhi hoti hai or bullish hoti hai. Next candle bearish hoti hai jis ka size chota hai. Candles ky dono taraf chota sa shadow hota hai.
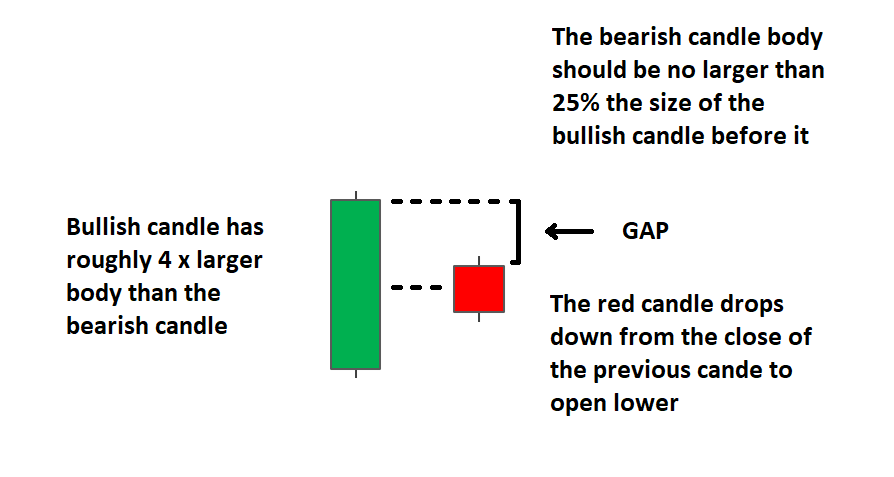

    Agar iss tarah ki candles 1 up trend k baad banain to iss ko technical analysis ky rules ky mutabiq bearish consider kiya jata hai. Yani ky Bearish Harami Candlestick Pattern 1 bearish reversal pattern hai.
    Ap Ka aik thanks bohat zrori ha
  • <a href="https://www.instaforex.org/ru/?x=ruforum">InstaForex</a>
  • #2 Collapse

    Re: Harami Candlestick Pattern....

    Harami Candlestick pattern aik Japanese candlestick pattern hai jo market main bullish aur bearish short term single produce karta hai. Harami Candlestick pattern price action ke direction kay hisaab say bullish ya bearish consider hota hai. Harami candlestick pattern 2 candlesticks par mushtamil hotaa hai. 1 candlesticks bullish aur dosri bearish hoti hai aur es hisaab say market ke bullish ya bearish direction ka andaza lagaya jaata hai. Neechy dee gai tasveer main aap bullish aur bearish Harami pattern dekh sakte hain. Harami Candlestick reversal signal provide karti hain. Harami Candlesticks 2 types ki hoti hain.
    Click image for larger version

Name:	download.jpg
Views:	7
Size:	10.0 کلوبائٹ
ID:	12412371
    1. Bullish Harami Candlestick Pattern
    2. Bearish Harami Candlestick Pattern

    Click image for larger version

Name:	download.png
Views:	26
Size:	2.0 کلوبائٹ
ID:	12412372
    1. Bullish Candlestick Pattern:
    Bullish harami candlestick pattern bullish reversal signal deti ha. harami candlestick pattern 1 long down k bd banny wla pattern ha.
    Ye pattern 2 candles se mil kr bnta ha. Pehli candle bri hoti ha js ka nsm bearish hota ha. jb k 2sri chpti candle hoti hs jis ka nam bullish hota ha in oattern ko understand krny k ly humary paas knowledge bht ziada hona chahiye.
    Click image for larger version

Name:	download (1).jpg
Views:	2
Size:	9.9 کلوبائٹ
ID:	12412373
    2. Bearish Candlestick Pattern:
    Bearish candlestick pattern is me 2 trah ki candle bnti ha ek long r 2sri short iski csndle k 2no side pe arrows bnta ha r ye uptrend se strt hota ha. Bullish harami candlestick pattern bnny k bd kis trah markt ny move kia same usi trah beariah ki b movement hoti ha humy chahiye k hum in sb k related apna knowledge increase kren tbhi hum trading me expert bn skty hsin. Bearish harami pattern tab banta hai jab market aik strong bullish trend kay bad market mein bulls pressure resistance level k oper less ho jata hai, to es situation main resistance level par akhiri bullish candlestick k bad aik choti body wali bearish candlestick banti ha
    Click image for larger version

Name:	images.png
Views:	2
Size:	8.5 کلوبائٹ
ID:	12412374
    • #3 Collapse

      Re: Harami Candlestick Pattern....

      WHAT IS A HARAMI CANDLESTICK?

      The Harami candlestick is a Japanese candlestick pattern that comprises of two candles which indicates a potential reversal or continuation in the market. The word ‘Harami’ is derived from the Japanese word for ‘pregnant’ which is representative of the Harami candlestick pattern. The Harami candlestick pattern can signal both bullish and bearish indications as seen below:
      Bullish Harami:
      1. Established downtrend
      2. Leading larger bearish (red) candle
      3. Trailing smaller bullish (green) candle - price gaps up after bearish candle and is contained within the open and close of the leading bearish candle

      Bearish Harami:
      1. Established uptrend
      2. Leading larger bullish (green) candle
      3. Trailing smaller bearish (red) candle - price gaps down after bullish candle and is contained within the open and close of the leading bullish candle

      As indicated in the images above, the first candle (pregnant candle) is a large candle continuing the immediate trend and the trailing candle is a small candle protruding like a pregnant woman. It is important to note that technically the second candle will gap inside the first candle. However, gapping on forex charts is rare due to the 24-hour nature of forex trading. Therefore, the technically correct version of the Harami is rare in the forex market as gaps are minimal and the second candle often becomes a small inside bar of the first.
      The confirming candle is used as a tool to tell traders if the smaller trailing gives life to a reversal or follows the trend with the starting candle. The popularity of the Harami pattern and other candlestick patterns is due to the ability to catch a reversal at the most opportune time with tight risk. This will allow traders to have very favorable risk-reward ratios.
      USES OF THE HARAMI CANDLE IN FOREX TRADING

      Advantages of the Harami pattern:
      • Easy to identify
      • Opportunity to capitalise on large movements with high risk-reward ratios
      • Widely used in forex trading

      Limitations of the Harami pattern:
      • Requires confirmation before execution

      TRADING WITH THE HARAMI CANDLE PATTERN

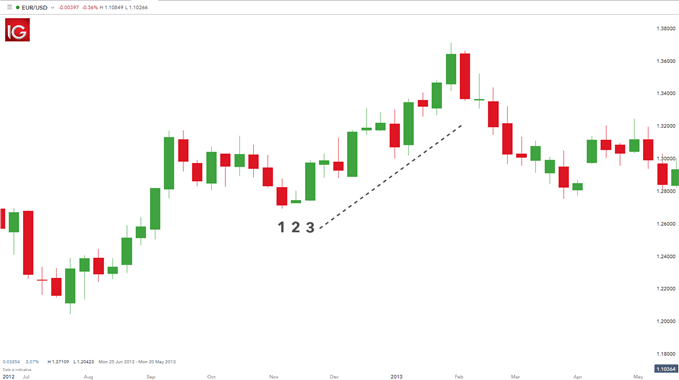
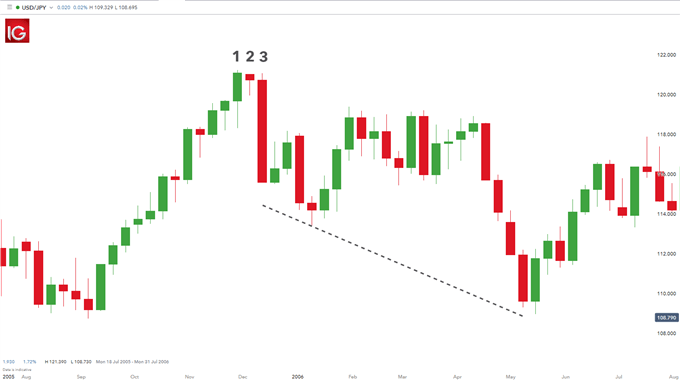
      The Harami candlestick pattern forms both bullish and bearish signals depending on the validating candle. The forex charts below exhibit both types of Harami patterns and how they feature within the forex market.
      In both instances the candle labelled ‘3’ designates the confirmation candle which approves the pattern. With most candlestick patterns, traders can utilise other technical indicators to support the pattern.
      Bullish Harami:
      The Bullish Harami above represents a continuation of the current upward trend for the EUR/USD pair. This is important to remember because not all Harami patterns indicate reversals.
      Bearish Harami:
      The Bearish Harami above displays how a reversal pattern is formed using the Harami candlestick pattern with the reversal occurring at the medium term high. Reversal signals are often stronger at significant price levels (support, resistance, highs and lows).
      When traders interpret the Harami candles, context is vitally important. Analysing the previous charting pattern (trends) as well as price action will give the trader greater insight and ability to forecast the implications of the Harami pattern. Without context, the Harami is just three candles which are practically insignificant.
      READ MORE ON TRADING WITH HARAMI CANDLESTICKS

      • #4 Collapse

        Re: Harami Candlestick Pattern....

        Morning Doji-superstar Candlestick Pattern


        Morning doji-star candlestick sample prices chart par dealers ki marketplace fundamental dilchaspi khatam hone aur market ka customers k hathon principal jane ka aik sturdy bullish fashion reversal sample hai, jo teenager candles par mushtamil hota hai. Ye pattern fees k backside par ya low fees location predominant banta hai. Ye sample teen candles ka hone ki waja se unmarried candle sample ya double candles patterns ki nisbat ziada picheeda aur dilshasp hota hai. Ye sample wese single day candle aur days candlestick ki nisbat fee chart pat bohut kam dekhte chook, lekin un ki nisbat ye karkardagi major ziada reliable hote bird.


        Candles Formation


        Morning doji-celebrity candlestick sample ka shumar bhi bullish fashion reversal sample most important hota hai, jo okay expenses k backside ya bearish trend k baad banta hai. Morning doji-star candlestick sample foremost candles ki formation darjazzel tarah se hoti hai;


        1. First Candle: Morning doji-megastar candlestick sample ki pehli candle aik long real frame wali bearish candle hoti hai, jo okay prices k sabeqa bearish fashion ki alamat hoti hai. Ye candle coloration primary black ya crimson hoti hai, jiss real frame shadow ki nisbat ziada hota hai.

        2. Second Candle: Morning doji-big name candlestick pattern ki dosri candle aik bagher wali doji candle hoti hai, jo ziada tar doji-celebrity candle hoti hai. Ye candle small upper aur lower shadow ok sath hoti hai, aur ye candle pehli bearish candle k bottom par banti hai, jiss ka open aur close same factor par hota hai.

        Three. Third Candle: Morning doji-famous person candlestick pattern ki teesri candle aik bullish candle banti hai, jo k sabeqa bearish trend ka khatema karke new bullish fashion reversal ka sabab banti hai. Ye candle robust bullish candle hoti hai, jiss ka upper ya decrease aspect par small wick ho sakti hai, lekin ye doji candle se above aspect par hole principal banna chaheye.

        Explanation

        Morning doji-celebrity candlestick pattern price chart k backside par ya bearish fashion okay baad banta hai, jo okay teenager candles par mushtamil hota hai. Pattern ki pehli candle aik bearish candle hoti hai, jo okay charges k bearish ya backside fashion ki alamat hoti hai. Ye candle aik robust position par hoti hai, jo expenses ko downward push karti hai. Pattern ki dosri candle aik bagher real frame wali doji candle hoti hai, jo k ziada tar aik doji-famous person candle hoti hai. Ye candle pehli candle okay backside par banti hai, aur ye candle wese to yahan par neutral position play karti hai, lekin iss ka shumar aik bullish candle k tawar kia jata hai. Pattern ki akhari candle aik bullish candle hoti hai, jo ok dosri candle ok top par banti hai. Ye candle bullish fashion reversal ka kirdar ada karti hai.


        Trading

        Morning doji-superstar candlestick sample charges okay backside par banne ki waja se bullish fashion reversal ok leye aik robust sign deta hai, jiss par buyers market primary buy ki entry kar sakte chook. Pattern par buying and selling karne se pehle investors ok leye aik confirmation candle ki zarorat pare gi. Ye confirmation candle real frame foremost bullish bhi honi chaheye aur teesri bullish candle ok pinnacle par close bhi honi chaheye. Pattern ok baad bearish candle banne se pattern par buying and selling loss ka bahis ban sakti hai. Jab k pattern ki affirmation CCI, RSI, MACD indicator aur stochastic oscillator se bhi ki ja sakti hai, jiss par price oversold region predominant honi chaheye. Stop Loss sample okay sab se backside par ya dosri candle okay low charge se two pips below set karen.
        • <a href="https://www.instaforex.org/ru/?x=ruforum">InstaForex</a>
        • #5 Collapse

          Re: Harami Candlestick Pattern....

          Introduction:-

          Harami candlestick Aisa pattern hota hai Jise understand karna bahut Zaroori Hota Hai Kabhi kabhi aap market Mein dekhte hain ke candlestick ke upar wale side side par koi. Nahi hota happier candlestick Kohima Harami candlestick kehte hain Is par focus karna bahut Zaroori Hota Hai Singapore market ki neck movement ke baare mein Maloom Hota Hai agar aap ek long time trader hai to aapko is candlestick strategy ke baare mein likhna bahut jyada Jaroori hai.

          Click image for larger version

Name:	HaramiNQuptrend.png
Views:	14
Size:	38.1 کلوبائٹ
ID:	12412377


          Harami candlestick pattern:-


          Harami candle stick esa pattern hay jes ko understand karny key ley day 1 ka time frame chart use karna important hota hay, day 1 me single candle bullish ya bearish banta hay es par hi focus nahi kia jata 2nd day key candle se ye information hasil ho sakti hay key ye bullish harami candlestick hay ya bearish harami candle. market mai enter hona chahey pher he hum ache earning hasial kar sakly gy candle ke mutalik iqsam hain hain hamy kabe be inhy ignore nahi karna chahey forex aik world wide business hain hum is mai agar tukky laga kar kam kary gy to hamy loss ho jy ga forex aik international business hain is mai usa or china or new yok jasy bary bary mumalik sahmil hai.

          Click image for larger version

Name:	bearish-harami-pattern_body_USDSGDtradingexample.png.full.png
Views:	12
Size:	12.9 کلوبائٹ
ID:	12412378


          HARAMI CANDLE PATTERN ke TYPES:


          Harami candlestick pattern ki 2 types hai.

          1. BULLISH CANDLE PATTERN.
          2. BEARISH CANDLE PATTERN.


          1 bullish Harami candlestick pattern.

          Harami candlestick pattern Mein Bullish downtrand ka agaaz karti hai pahle candlestick Badi aur bearish hoti hai bearish candlestick to bad use se thoda niche bullish candle banti hai. Bullish Harami Candlestick Pattern k banna k bad new candle k open k sath trader ko ""Buy ki Trade"" active kerni chaheye. Stoploss ko first black candle ki low is located at karen place aur Take Profit ko next resistance level for karen place. Bull candlestick harami generally make par candles include card hai ismein hota hai .


          2. Bearish Harami Candlestick Pattern.


          Bearish candlestick up trend ka agaz karti hai pahle candlestick Badi aur bullish hoti hai bullish candlestick ky bad ussy thora nechy bearish candlestick bati hai. Resistance level strike after last bullish candlestick Kay bad aik choti body wali bearish candlestick close hoti hai, tu isko aap bearish pattern Harami candlestick khety Hain Ya hamesha aik strong uptrend Kay bad resistance level na mil sakty hai.
          Click image for larger version

Name:	bullish-and-bearish-harami.png
Views:	1
Size:	2.9 کلوبائٹ
ID:	12412379

          اب آن لائن

          Working...
          X