Assalamualaikum!
Dear members forex main market main jb hm work krty hain. Tu hmein chart open krty hi os pr Koch candles nazar ati hain. Ju uper nechy move krti nazar ati hay. Jin ko ko hm identify krty hain. Aur phr tread krty hain. Aj candle stick ke sari malomat AP Sath shear krun ga. Jis sy ap ko bhi asani ho gi.
What is Candlestick:
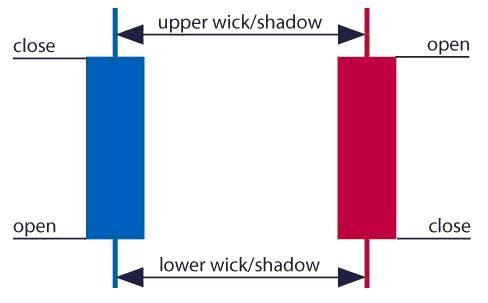
Market main work key duran firstly. Candle stick ko identify krty hain. Kun agr AP in candle ko achy learn kr lety hain tu ap bht acha profit hasil kr skty hain. Jb AP chart open krty hain. Tu os pr AP ko red Aur black color ki bht zada candle banti dekhai deti hay. Jis ko hm candle sticks khty hain. Koch candles uper ko trf move krti nazar ati hain Aur Koch nechy ki trf move krti hain. Candles ki tamam information nechy ko btai gai hain.

Candle ko maloom krny ka tarika:
Market mein jb bhi ap kisi pattern ko find out krty hain.tu chart pr different shakal ki candles hoti hain. Koch candles red Aur koch green hoti gain. Jin according hm tread lety hain. Red bearish Aur green bullish ko show krti hain.

Working with Candlestick:
Dear forex Market key andr jb ap chart ko analysis krty hain. Tu candle ki opening point ko phly pta krty hain. Es key different part mojod hoty hain. Ju k time frame mein aek point sy candle start hoti hay. Jb BHI hm short Aur long trem Treading hm market main bht achy point or tread kr skty hain. Jb BHI market mein green candle musalsal up ja Rahi hon tu yeah bullish trend hota hy. Yeah hmein buy key signal deta hay. Aur jb red candle nechy ki trf jati Nazar aen tu yh down trend khlata hay. Green candle bullish candle hoti hay. Aur bearish candle red ya wait color ki hoti bullish trend EIN buy key signal deta hay Aur bearish trend sell krny Kay signal fraham krta hay. Agr achy confirmation key sath hm entry lety hain tu hm bht achy earning kr skty hain.

Dear members forex main market main jb hm work krty hain. Tu hmein chart open krty hi os pr Koch candles nazar ati hain. Ju uper nechy move krti nazar ati hay. Jin ko ko hm identify krty hain. Aur phr tread krty hain. Aj candle stick ke sari malomat AP Sath shear krun ga. Jis sy ap ko bhi asani ho gi.
What is Candlestick:
Market main work key duran firstly. Candle stick ko identify krty hain. Kun agr AP in candle ko achy learn kr lety hain tu ap bht acha profit hasil kr skty hain. Jb AP chart open krty hain. Tu os pr AP ko red Aur black color ki bht zada candle banti dekhai deti hay. Jis ko hm candle sticks khty hain. Koch candles uper ko trf move krti nazar ati hain Aur Koch nechy ki trf move krti hain. Candles ki tamam information nechy ko btai gai hain.
Candle ko maloom krny ka tarika:
Market mein jb bhi ap kisi pattern ko find out krty hain.tu chart pr different shakal ki candles hoti hain. Koch candles red Aur koch green hoti gain. Jin according hm tread lety hain. Red bearish Aur green bullish ko show krti hain.
Working with Candlestick:
Dear forex Market key andr jb ap chart ko analysis krty hain. Tu candle ki opening point ko phly pta krty hain. Es key different part mojod hoty hain. Ju k time frame mein aek point sy candle start hoti hay. Jb BHI hm short Aur long trem Treading hm market main bht achy point or tread kr skty hain. Jb BHI market mein green candle musalsal up ja Rahi hon tu yeah bullish trend hota hy. Yeah hmein buy key signal deta hay. Aur jb red candle nechy ki trf jati Nazar aen tu yh down trend khlata hay. Green candle bullish candle hoti hay. Aur bearish candle red ya wait color ki hoti bullish trend EIN buy key signal deta hay Aur bearish trend sell krny Kay signal fraham krta hay. Agr achy confirmation key sath hm entry lety hain tu hm bht achy earning kr skty hain.


تبصرہ
Расширенный режим Обычный режим