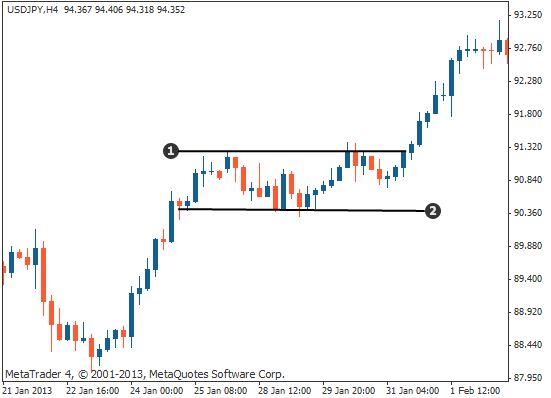
what is Bullish rectangular candle stick pattern:
bullish rectangular candle stick pattern aik aisa candle stick pattern hota hey jes mein price aik bullish breakout kay sath candle stick chart pattern mein aik taraf ya limit mein hote hey yeh chart pattern trend ke continuation or trend ko tabdel kar kay pattern dono kay tor par kam karta hey

identification of rectangular chart pattern
rectangular chart pattern forex market ke halat ko identify karta hey mesal kay tor par es chart pattern kay doran price aik side par he jate hey market time kay sath sath price kay limit kay andar chalte rehte hey forex chart par rectangular noma shape bante hey price pattern 2 highs or 2 lows ko wazah karta hey chart par rectangular noma shape bante hey
chart rectangular pattern par action laynay kay ley aap ko darj zail marahell par amal karna chihay price ka pattern 2 highs or 2 lows par moshtamell hota hey

Breakout with Bullish rectangular candle stick pattern:
forex mein sab say important step jes mein ap ko carefully chack karna chihay kunkeh market fake breakout say full hey bullish candle stick pattern mein body to wick ka ratio zyada hona chihay aik sahi breakout es bat ko wazah karta hey keh dosree taraf ager Doji candle stick or chote breakout candle stick to aap ko bare candle stick ke confirmation kay sath breakout ka wait karna chihay kunkeh chote candle stick ke raftar kam ho sakte hey or basic key level hamesha high momentum kay sath he hota hey

Day trading strategy with rectangular chart pattern
es level par trade karnay kay ley ap forex order open take profit or stop loss ka bhe janen gay
chonkeh aik strategy teen zyada parameter kay sungom say mel kar bante hey hum forex market mein trade ko win karnay kay imkan ko increase karnay kay technical parameter ko shamell kar trade karen gay
yeh woh sungom hotay hein jen ko hum entry stop loss take profit kay ley estamal kar saktay hein bullish rectangular pattern pehlay ka trend hona chihay yeh forex trend kay continuation chart pattern ko wazah karta hey rectangular pattern kay upper resistance zone breakout ke bare bullish candle stick ko wazah karta hey es ka matlab hey price bullish candle stick ko break kar day ge

Buy entry
resistance zone kay breakout kay bad jab price 38 Fibonacci level par wapes aay ge to buy order open ho ga
stop loss
stop loss bullish rectangular pattern kay lower part kay nechay hesay kay nechay rakha jata hey
Take profit level
take profit level pips mein rectangular pattern ke support or resistance kay darmean ka distance hey ab es distance ko bullish rectangular zne kay opar banay
bullish rectangular candle stick pattern aik aisa candle stick pattern hota hey jes mein price aik bullish breakout kay sath candle stick chart pattern mein aik taraf ya limit mein hote hey yeh chart pattern trend ke continuation or trend ko tabdel kar kay pattern dono kay tor par kam karta hey
identification of rectangular chart pattern
rectangular chart pattern forex market ke halat ko identify karta hey mesal kay tor par es chart pattern kay doran price aik side par he jate hey market time kay sath sath price kay limit kay andar chalte rehte hey forex chart par rectangular noma shape bante hey price pattern 2 highs or 2 lows ko wazah karta hey chart par rectangular noma shape bante hey
chart rectangular pattern par action laynay kay ley aap ko darj zail marahell par amal karna chihay price ka pattern 2 highs or 2 lows par moshtamell hota hey
Breakout with Bullish rectangular candle stick pattern:
forex mein sab say important step jes mein ap ko carefully chack karna chihay kunkeh market fake breakout say full hey bullish candle stick pattern mein body to wick ka ratio zyada hona chihay aik sahi breakout es bat ko wazah karta hey keh dosree taraf ager Doji candle stick or chote breakout candle stick to aap ko bare candle stick ke confirmation kay sath breakout ka wait karna chihay kunkeh chote candle stick ke raftar kam ho sakte hey or basic key level hamesha high momentum kay sath he hota hey
Day trading strategy with rectangular chart pattern
es level par trade karnay kay ley ap forex order open take profit or stop loss ka bhe janen gay
chonkeh aik strategy teen zyada parameter kay sungom say mel kar bante hey hum forex market mein trade ko win karnay kay imkan ko increase karnay kay technical parameter ko shamell kar trade karen gay
yeh woh sungom hotay hein jen ko hum entry stop loss take profit kay ley estamal kar saktay hein bullish rectangular pattern pehlay ka trend hona chihay yeh forex trend kay continuation chart pattern ko wazah karta hey rectangular pattern kay upper resistance zone breakout ke bare bullish candle stick ko wazah karta hey es ka matlab hey price bullish candle stick ko break kar day ge
Buy entry
resistance zone kay breakout kay bad jab price 38 Fibonacci level par wapes aay ge to buy order open ho ga
stop loss
stop loss bullish rectangular pattern kay lower part kay nechay hesay kay nechay rakha jata hey
Take profit level
take profit level pips mein rectangular pattern ke support or resistance kay darmean ka distance hey ab es distance ko bullish rectangular zne kay opar banay


تبصرہ
Расширенный режим Обычный режим