AOA
INTRODUCTION
Friends kya haal hai aapke ummid karta hun aap khairiyat se honge Jahan bhi Rahe Khush rahen aur mehfooz rahen aaj main aapke liye ek bahut important topic laya hun aur is per Apne knowledge ko aapke sath share bhi karna chahta hun ummid hai aapko Pasand aaega aur aap isko apni trade mein use Karke achcha profit bhi hasil karenge iske liye aapko jaruri hai ki aap apne knowledge aur experience ko hamesha improve karte rahen aaj ka jo topic hai usko Ham bearish breakwaye kahate Hain isko Ham apni trade mein kaise use karte hain aur kis Tarah isase Apne trade ko profit able banaa sakte hain to chalte Hain Apne topic per discuss karte hain Apne knowledge ko share karta hun ummid hai ki aap bhi apni knowledge ko improve karenge
BEARISH BREAKAWAY CANDLE STICK PATTERN
Bears breakway candlest pattern basically ek aisa candlestick pattern hota hai jo aapko market mein bears confirmation deta hai aur ISI confirmation per aap market mein entry lekar maximum profit hasil kar sakte hain jab aap is candle pattern ko Study karte Hain to ismein aapko iski complete identification aur interpretation ka idea hona chahie jab aap is candlestick pattern ko focus karte hain to ismein aapko following important point ko focus karna chahie

CANDLES FORMATION
Bearish break away candle stick pattern basically 5 different candlestick per mushtamil hota Hai jab aap is candle stick pattern ko study karte hain to ismein aapko sabse pahle market mein bullish trend mil raha hota hai aur market mein aapko regularly basis per completely bullish candles mil rahi hoti hain jab aap market mein regular bullish candlestick ko find out karte Hain aur iske bad aapko suddenly ek aisi candle milati hai jo market mein lost 3 candle ko completely cover kar leti Hai aap market mein Bearish breakaway candlestick ke naam se jante Hain

DETAIL OF BREAK AWAY CANDLESTICK PATTERN
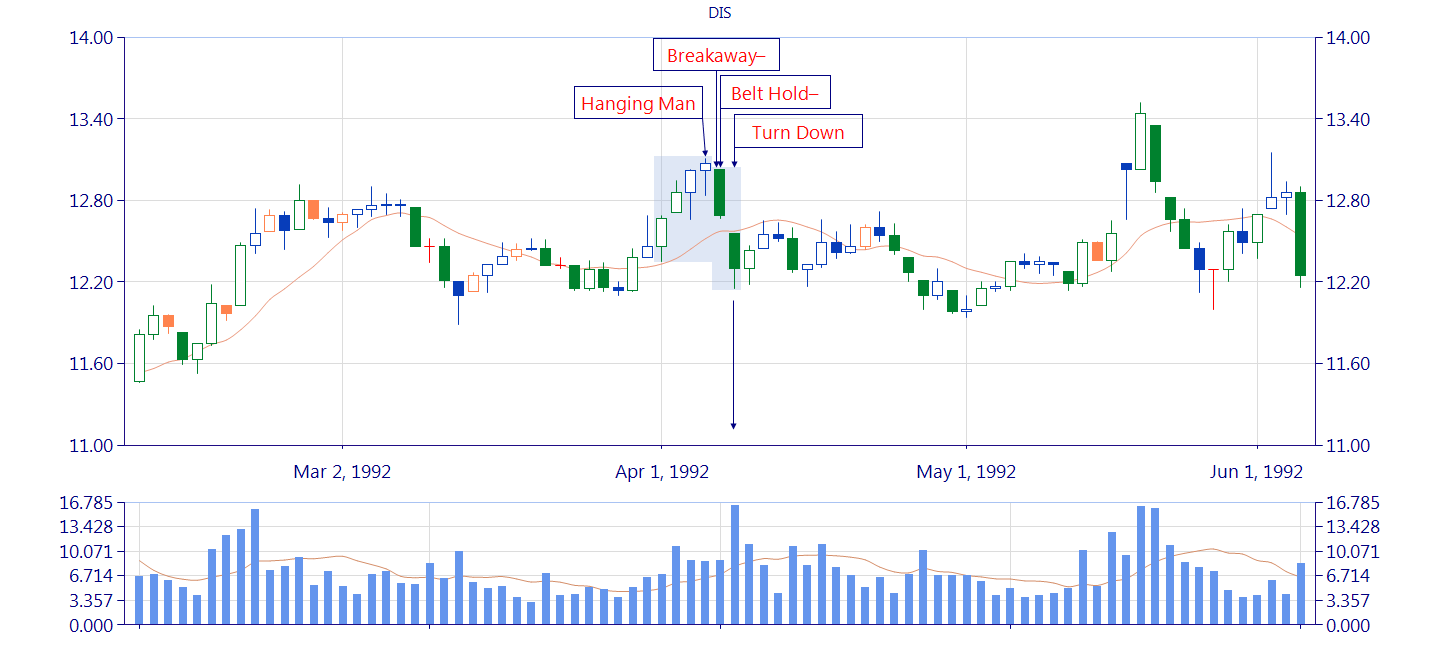
Bearish break away candlestick pattern price ke top mein banta hai jo ke ladder top aur concealing baby swallow pattern se milta julta Hai lekin candle ki formation mein Thora sa difference hota hai is pattern mein five (5) candles hoti hain jismein pahli candle ek long real body wali bullish candle hoti hai pattern ke bad mein banne wali three(3) candles small real body mein hoti hai jo ki Bullish or bearish donon Tarah se Hoti Hai yah candle phelly candle se above gap mein banti hai lekin small real body ki vajah se prices ke bullish jaane mein rukavat Dal di Hai pattern ki aakhri candle ek long resl body wali candle hoti hai jo ki small candle ke bad open hokar pahli aur dusri candle ke darmiyan banne wale gap mein close hoti hai

TRADING
Bearish break away candlest pattern ki aagaaz mein buyers market mein bahut jyada strong hote Hain kyunki pahli candle ek long real body wali bullish candle hoti hai pattern ki last 3 candles small hone ki vajah se prices ko mazeed bullish jaane mein rukavat ka samna karna hota hai jabki last candle trend reversal ka sabab banti hai pattern ki akhre candle ky bad aik trend confirmation wale bearish candle ki jarurat hoti hai jo ky real body main hone chehy trend confirmation CCI indicator aur stochastic oscillator se ki ki ja sakti hai jiska value overbought zone main indication hona chahie jab confirmation candle ka trend ky mutabik na bane per yah pattern zaya ho jae ga pattern ka stop loss sabse upper point per se bhi 3 pips above set Karen

INTRODUCTION
Friends kya haal hai aapke ummid karta hun aap khairiyat se honge Jahan bhi Rahe Khush rahen aur mehfooz rahen aaj main aapke liye ek bahut important topic laya hun aur is per Apne knowledge ko aapke sath share bhi karna chahta hun ummid hai aapko Pasand aaega aur aap isko apni trade mein use Karke achcha profit bhi hasil karenge iske liye aapko jaruri hai ki aap apne knowledge aur experience ko hamesha improve karte rahen aaj ka jo topic hai usko Ham bearish breakwaye kahate Hain isko Ham apni trade mein kaise use karte hain aur kis Tarah isase Apne trade ko profit able banaa sakte hain to chalte Hain Apne topic per discuss karte hain Apne knowledge ko share karta hun ummid hai ki aap bhi apni knowledge ko improve karenge
BEARISH BREAKAWAY CANDLE STICK PATTERN
Bears breakway candlest pattern basically ek aisa candlestick pattern hota hai jo aapko market mein bears confirmation deta hai aur ISI confirmation per aap market mein entry lekar maximum profit hasil kar sakte hain jab aap is candle pattern ko Study karte Hain to ismein aapko iski complete identification aur interpretation ka idea hona chahie jab aap is candlestick pattern ko focus karte hain to ismein aapko following important point ko focus karna chahie
CANDLES FORMATION
Bearish break away candle stick pattern basically 5 different candlestick per mushtamil hota Hai jab aap is candle stick pattern ko study karte hain to ismein aapko sabse pahle market mein bullish trend mil raha hota hai aur market mein aapko regularly basis per completely bullish candles mil rahi hoti hain jab aap market mein regular bullish candlestick ko find out karte Hain aur iske bad aapko suddenly ek aisi candle milati hai jo market mein lost 3 candle ko completely cover kar leti Hai aap market mein Bearish breakaway candlestick ke naam se jante Hain
DETAIL OF BREAK AWAY CANDLESTICK PATTERN
Bearish break away candlestick pattern price ke top mein banta hai jo ke ladder top aur concealing baby swallow pattern se milta julta Hai lekin candle ki formation mein Thora sa difference hota hai is pattern mein five (5) candles hoti hain jismein pahli candle ek long real body wali bullish candle hoti hai pattern ke bad mein banne wali three(3) candles small real body mein hoti hai jo ki Bullish or bearish donon Tarah se Hoti Hai yah candle phelly candle se above gap mein banti hai lekin small real body ki vajah se prices ke bullish jaane mein rukavat Dal di Hai pattern ki aakhri candle ek long resl body wali candle hoti hai jo ki small candle ke bad open hokar pahli aur dusri candle ke darmiyan banne wale gap mein close hoti hai
TRADING
Bearish break away candlest pattern ki aagaaz mein buyers market mein bahut jyada strong hote Hain kyunki pahli candle ek long real body wali bullish candle hoti hai pattern ki last 3 candles small hone ki vajah se prices ko mazeed bullish jaane mein rukavat ka samna karna hota hai jabki last candle trend reversal ka sabab banti hai pattern ki akhre candle ky bad aik trend confirmation wale bearish candle ki jarurat hoti hai jo ky real body main hone chehy trend confirmation CCI indicator aur stochastic oscillator se ki ki ja sakti hai jiska value overbought zone main indication hona chahie jab confirmation candle ka trend ky mutabik na bane per yah pattern zaya ho jae ga pattern ka stop loss sabse upper point per se bhi 3 pips above set Karen

تبصرہ
Расширенный режим Обычный режим