Assalamualaikum Kise ho ap sab log me bilkul thek or khariyat se ho or umeed karta ho ke ap sab log bhi bilkul thek or khariyat se ho ge aj is thread me apkoMe hammer candlestick patterns ki importance ke bare me btao ga or me umeed karta ho ke jo information me apse share karo ga wo apke knowledge or
Experience me zaror izafa kare ge or agar ap mere is thread pe amal karte he to ap ak acha khasa knowledge bhi gain kar sakte he ak or bat jo me apko btana
Chahta ho ke agar ham Pakistan forex forum pe apni pori mhenat or himmat se Kam karte he or apna ziyada se ziyada time bhi Pakistan forex forum pe
Guzarte he to ham ak ache or kamyab trader ban sakte he or bhot sare paise bhi kama sakte he isliye hme Pakistan forex forum pe apni pori mhenat or apni
Pori himmat se Kam Karna chahye or apna ziyada time bhi yhi guzarna chahye.
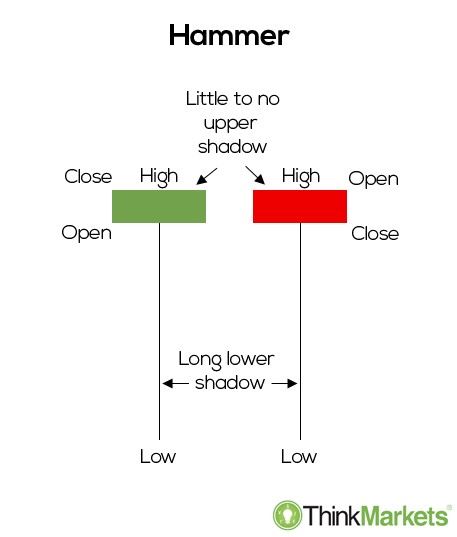
What is Hammer candlestick patterns?
candlestuck charting mein hathora qeemat ka aik namona hai jo is waqt hota hai jab koi security –apne khilnay se numaya tor par kam tijarat karti hai, lekin iftitahi qeemat ke qareeb band honay ki muddat mein reliyan hoti hai. yeh namona hathoray ki shakal ki shama daan banata hai, jis mein nichala saya haqeeqi jism ke size se kam az kam dugna hota hai. candle stick ka body khuli aur band qeematon ke darmiyan farq ko zahir karta hai, jabkay shadow is muddat ke liye ziyada aur kam qeematon ko zahir karta hai .

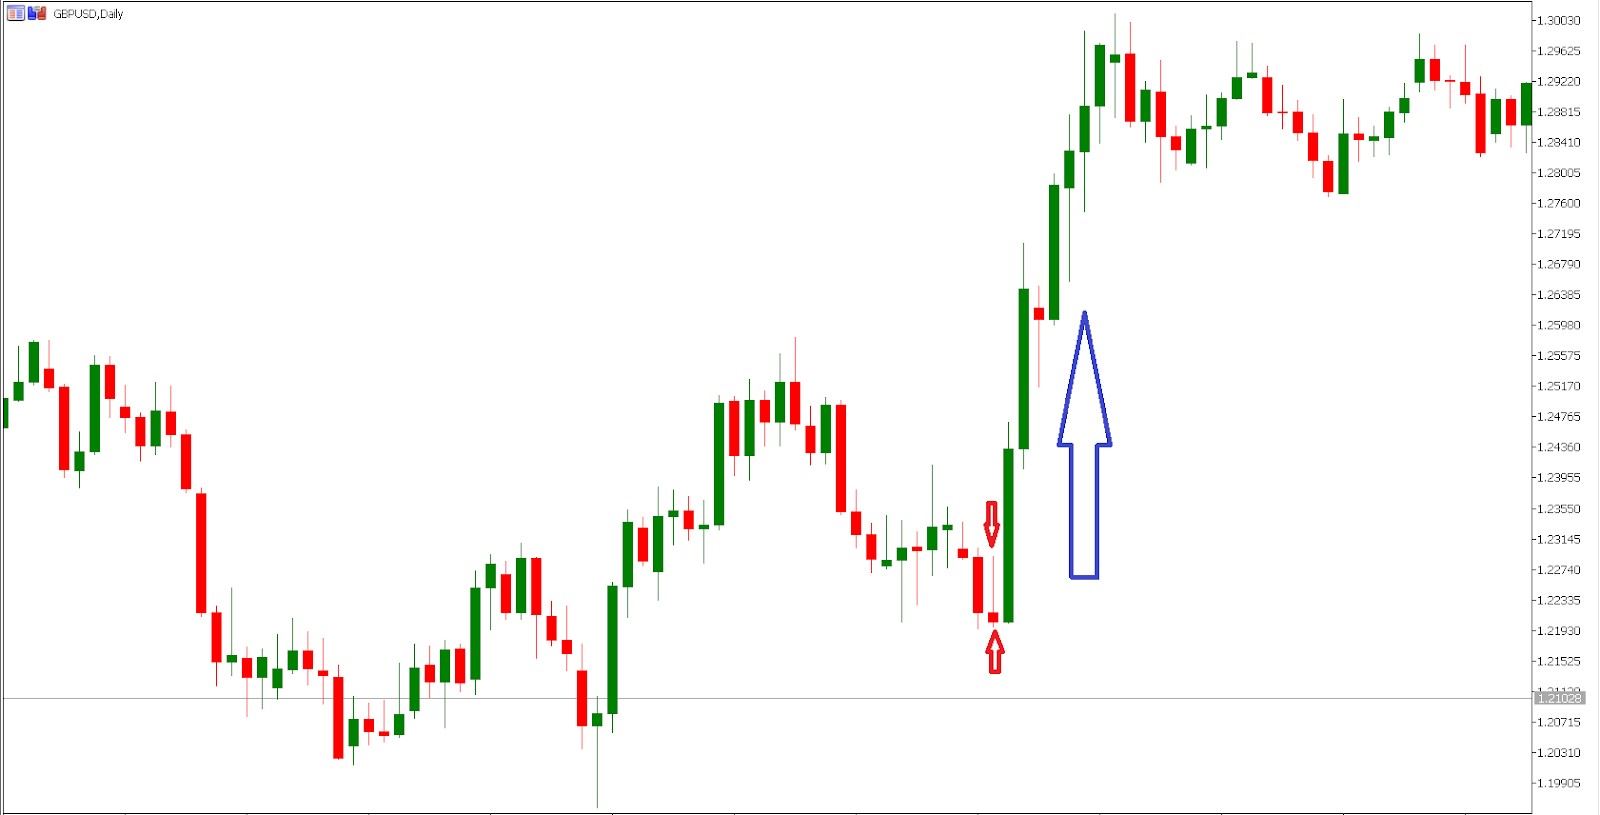
Key Takeaway;
hathoray ki shammen aam tor par qeemat mein kami ke baad hoti hain. un ka aik chhota sa asli jism aur aik lamba nichala saya hai. hathora candle stick is waqt hoti hai jab baichnay walay qeemat mein kami ke douran market mein daakhil hotay hain. market band honay tak, khredar farokht ke dabao ko jazb karte hain aur market ki qeemat ko ibtidayi qeemat ke qareeb dhakel dete hain. band khilnay ki qeemat se oopar ya neechay ho sakta hai, halaank band khulay ke qareeb hona chahiye taakay candle stick ka asli body chhota rahay. nichala saya haqeeqi jism ki oonchai se kam az kam do gina hona chahiye. hathora candlestick mumkina qeemat ke ulat jane ki nishandahi karti hai. hathoray ke baad qeemat barhna shuru ho jaye gi. usay tasdeeq kehte hain

Experience me zaror izafa kare ge or agar ap mere is thread pe amal karte he to ap ak acha khasa knowledge bhi gain kar sakte he ak or bat jo me apko btana
Chahta ho ke agar ham Pakistan forex forum pe apni pori mhenat or himmat se Kam karte he or apna ziyada se ziyada time bhi Pakistan forex forum pe
Guzarte he to ham ak ache or kamyab trader ban sakte he or bhot sare paise bhi kama sakte he isliye hme Pakistan forex forum pe apni pori mhenat or apni
Pori himmat se Kam Karna chahye or apna ziyada time bhi yhi guzarna chahye.
What is Hammer candlestick patterns?
candlestuck charting mein hathora qeemat ka aik namona hai jo is waqt hota hai jab koi security –apne khilnay se numaya tor par kam tijarat karti hai, lekin iftitahi qeemat ke qareeb band honay ki muddat mein reliyan hoti hai. yeh namona hathoray ki shakal ki shama daan banata hai, jis mein nichala saya haqeeqi jism ke size se kam az kam dugna hota hai. candle stick ka body khuli aur band qeematon ke darmiyan farq ko zahir karta hai, jabkay shadow is muddat ke liye ziyada aur kam qeematon ko zahir karta hai .
Key Takeaway;
hathoray ki shammen aam tor par qeemat mein kami ke baad hoti hain. un ka aik chhota sa asli jism aur aik lamba nichala saya hai. hathora candle stick is waqt hoti hai jab baichnay walay qeemat mein kami ke douran market mein daakhil hotay hain. market band honay tak, khredar farokht ke dabao ko jazb karte hain aur market ki qeemat ko ibtidayi qeemat ke qareeb dhakel dete hain. band khilnay ki qeemat se oopar ya neechay ho sakta hai, halaank band khulay ke qareeb hona chahiye taakay candle stick ka asli body chhota rahay. nichala saya haqeeqi jism ki oonchai se kam az kam do gina hona chahiye. hathora candlestick mumkina qeemat ke ulat jane ki nishandahi karti hai. hathoray ke baad qeemat barhna shuru ho jaye gi. usay tasdeeq kehte hain
تبصرہ
Расширенный режим Обычный режим