Importance of " Upside Tasuki Candlestcick pattern" in forex Trading.
X
  • وقت
  • دکھائیں
Clear All
new posts
  • #1 Collapse

    Importance of " Upside Tasuki Candlestcick pattern" in forex Trading.

    INTRODUCTION:


    Dear forex members ummid karta hun ki aap sab khairiyat se honge aur Forex se daily ke message per aur Forex se daily ke message per acchi earning kar rahe honge.. dear Forex members for access rescue business hai jismein hamen profit kiske sath sath loss dear Forex members for access rescue business hai jismein hamen profit kiske sath sath loss bhi slow se bachne ke liye important hai ki Ham Forex ke bare mein knowledge aur experience hasil Karen Taki hamara jyada loss na slow se bachne ke liye important hai ki Ham Forex ke bare mein knowledge aur experience hasil Karen Taki hamara jyada loss na ho. For extra bahut sare patient we use hote hain jinki help se have successful studying kar sakte hain.


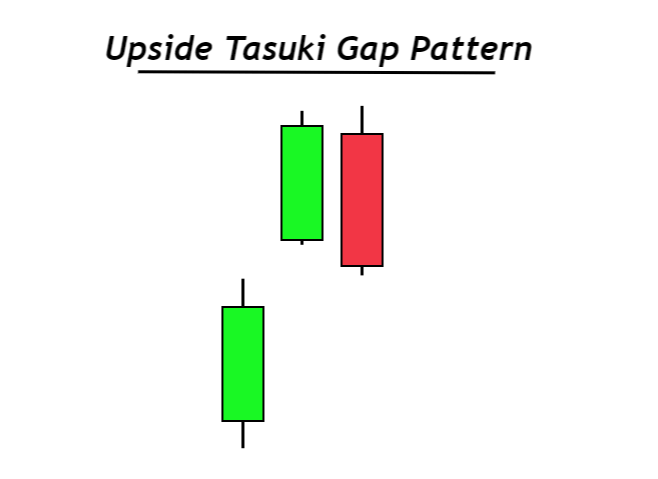
    UPSIDE TASUKI CANDLESTCICK PATTERN:


    Dear forex members upside Tasuki Candlestcick pattern teen candles for mustameez ek majbut trend continuation pattern hai. Jo crisis ki high level ya police train mein banta hai Jo crisis ki high level ya police train mein banta hai. Upside the sowki gap gastric pattern mein teen candle shamil hoti hain yah hamen market ke train ke bare mein indicate Karti Hain jismein Upside the sowki gap gastric pattern mein teen candle shamil hoti hain yah hamen market ke train ke bare mein indicate Karti Hain jismein pahle Peri channel white kendal hoti hai jo ki market mein current police strength ko ke bare mein batati hai aur hamen market ke positive signal ke bare mein batati hai aur hamen market ke positive signal deti.


    Click image for larger version

Name:	images - 2022-07-12T001008.776.png
Views:	25
Size:	9.3 کلوبائٹ
ID:	12544210


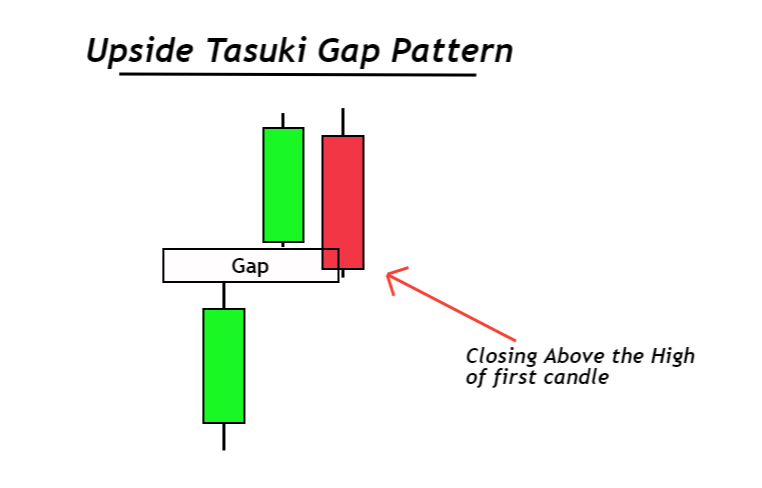
    IDENTIFICATION OF UPSIDE TASUKI GAP CANDLESTCICK PATTERN:


    Dear forex members upside Tasuki Candlestcick pattern teen ke Dal ka ek police continuation pattern hai jismein pahle 2 ke 10 word ya green color ki hoti hain aur yah donon police hoti hain jabki dosti ke andar black ya red color ki hoti hai aur yah candle Barish hoti hai pattern mein shamil pahle do kenal police banne ka matlab yah hota hai ki market off side jayegi aur abhi tak yah extra indication hota hai yah Nahin ismein Kisi bhi kism ki gunjaish Nahin Hoti ki market niche ki taraf fall karegi. Iski vajah se yah donon ke distrong real body mein banne ke साथ-साथ ek dusre se gap mein bhi banti Hain jiski TC ki nal dusri candle aur gap mein close hone ka matlab yah hota hai ki market apna current ko hi follow karegi yah Nahin Veri strain ko koshish nakam banaa chuki Hogi.


    Click image for larger version

Name:	images - 2022-07-12T001005.284.jpeg
Views:	23
Size:	11.7 کلوبائٹ
ID:	12544211


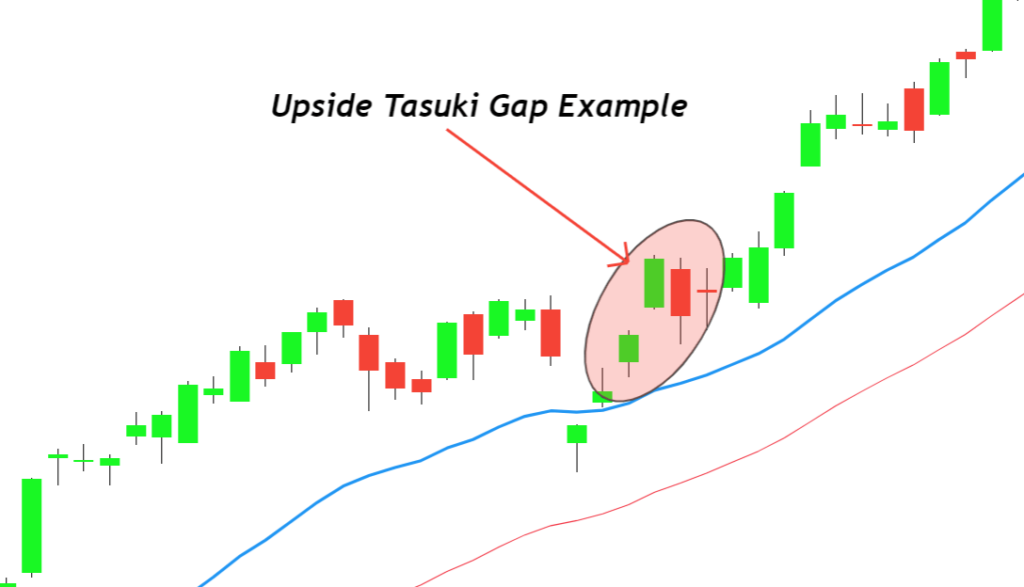
    USE OF UPSIDE TASUKI GAP CANDLESTCICK PATTERN:


    Dear forex members upside the soake get a stick pattern mare hit my bike hoti hai patron for trading karne se pehle hame marge information hai jo ke exhaust signal conservation candle plus candle charge topar close hone chahiye. Is Tarah se hamen market mein ek positive signal Mil Jata hai jiske bad trader is per Karke apni position ko majbut banaa dete Hain lekin petrol jyada strong hona jaruri Nahin Hota is vajah se hamen pattern per sabse kam position ya pahle kinnar ke lower per top loss ka ilaaj mein istemal karna chahie.


    Click image for larger version

Name:	images (100).png
Views:	6
Size:	2.9 کلوبائٹ
ID:	12544212


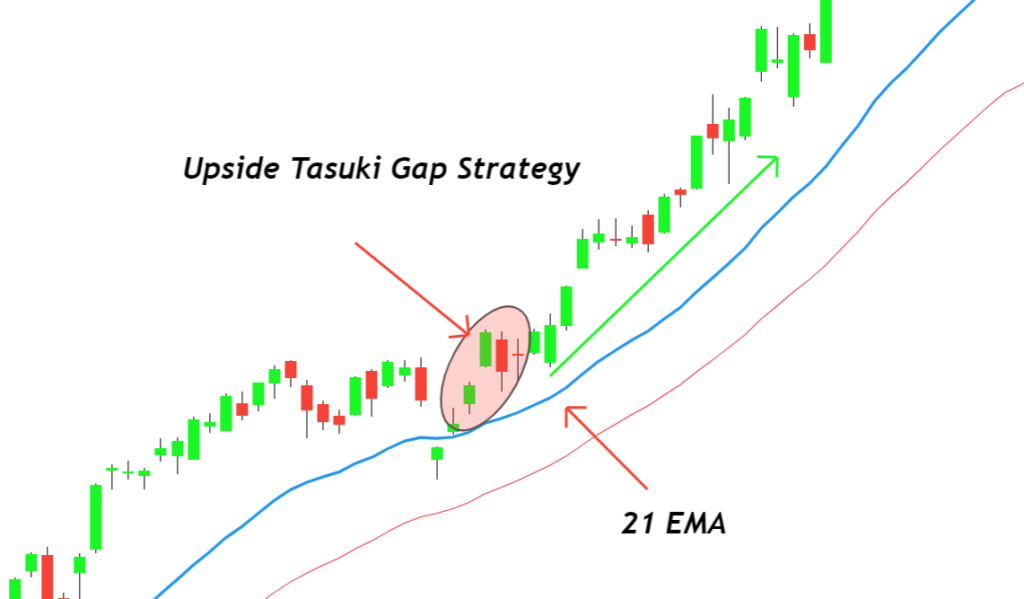
    STOP LOSS AND TAKE PROFIT:


    Dear forex members Kisi bhi setting karne se pahle hamen chahie ki Ham is per stop loss aur take profit ka last mein use Karen isase yah hota hai ki hamari trade bi safe rahti hai aur hamara account bhi wash hone se bacha rahata hai kyunki jis prices per Ham staff Los lagate Hain vahan per platform kar khud bahut close ho jaati hai aur hamen market ko बार-बार dekhna Nahin padta Is Tarah hamara time bhi West hone se bacha rahata hai isliye important hai ki Ham stop loss aur take profit ka last mein use Karen.


    Click image for larger version

Name:	images (99).png
Views:	30
Size:	14.6 کلوبائٹ
ID:	12544213


  • <a href="https://www.instaforex.org/ru/?x=ruforum">InstaForex</a>
  • #2 Collapse

    Re: Importance of &quot; Upside Tasuki Candlestcick pattern&quot; in forex Trading.

    WHAT IS UPSIDE TASUKI CANDLESTICK PATTERN :


    Upside Tasuki ak gap pattern ha ya upside tasuki gap ak bullish continuation pattern ha ya pattern three candlr sa mil kar banta ha or is pattern ma upside ke traf gap hota ha. Is upside tasuki gap pattern ma do candlestick bullish ke hote ha or ak gap hota ha or ak candlestick bearish ke hote ha. Ya three candle ak specific sequence ma market ka chart ma bante ha or is upside tasuki gap pattern ke formation karte ha. Is pattern ke first candle ak long bullish candle ha jo ka real body sa bante ha jo ka green colour ke hote ha is candle ka up or low ma small shadow ho sakta ha is candle ka end ka bad market ma up side ke traf gap ata ha is gap ka bad jo second candle bante ha is pattern ke wo bhi bullish ma hote ha or is candle ka size first candle ka equal hota ha ya bhi bullish candle hote ha jo ka green colour ke large candle hote ha jo ka up ma close hote ha or is pattern ke last candle ak bearish canfle ha jo ka second candle ka closing point sa open hote ha or ak long body banay kar market ka trend ko change karte ha. Ya candlestick pattern huma batata ha ka market na apna bullish trend ko continues rakhna ha, or market ma buyers ka control ha. Ya ak long term pattern ha is ma traders long term ka liya hold kara ga.


    HOW TO IDENTIFY UPSIDE TASUKI CANDLESTICK PATTERN :


    Agar ap upside tasuki gap candlestick pattern ko market ka chart ma identify karna chata ha to os pattern ko market ka chart ma in points ko follow karna zaroori ho ga :


    1:
    Is pattern ke first candle ak bullish candlestick ho ge jo huma bataty ge buyers ka movement ko or ya candle huma bullish price trend ka batay ge ya candle market ka chart ma low sa open ho ge or high ma close ho ge is candle ma bull ka pressure high ho ga.

    2:
    Second candlestick market ka chart ma gap sa open ho ge ya gap up ma ho ga or ya outside rangr par ho ga previous candle sa. Is second candle ka size small ho ga magar ya is pattern ka high ma close ho ge ya bhi market ka bullish pressure ka batay ge.

    3:
    Third candlestick is pattern ke bearish candle ho ge. Is candle ka previous candle ke rang sa open hona must ho ga ya candle previous candle ka closing point sa open ho ge or ya candle close ho ge first candle ka closing price sa higher ma.


    UNDERSTANDING UPSIDE TASUKI CANDLESTICK PATTERN :


    Jab ya upside tasuki pattern banna start ho gabor is pattern ke jab firstcandle banay ge to wo indicate kara ge market ka buying control ko or bullish trend ko ya huma batay ge ka market ka jo ya trend ha or future ka jo trend hona wala ha wo bullish ka ha. Is first candle ka bad ak gap ata ha jo ka market ka ak huge buyers ka momentum ka batata ha is gap ka bad market ka bullish jana ka chances or zada bar jata ha. Is pattern ma market impulsive or retracement wave ke trha kam karte ha. Is pattern ma jo bull candlestick hote ha wo show karte ha impulsive wave or jo bearish candlestick ha wo retracement wave ko show karte ha. Jab market ma retracement wave bante ha to ya batate ha ka market ka buyers ka trend strong ni ha magar jab market ma small retracement ate ha to wo strong trend ka signal date ha is waja sa is pattern ma bearish candle bante ha jo ka first candle sa abovr ma hote ha jo ka ak strog signal produce karte ha uptrend ka.


    TRADING WITH UPSIDE TASUKI CANDLESTICK PATTERN :


    Ya ak trend continuation candlestick pattern ha is ko trading karna ka liya use kiya jata ha is pattern ko other technical tools or trend line or moving average sa bhi use kiya jata ha. Jasa ka is ma trading karna ka liya EMA strategy ko use kiya jata ha. Is ma traders draw karta ha 21 EMA ko or 31 EMA ko market ka chart ma, or is market la trend ke direction ko confirm karta ha or is ka trend must bullish hona chaiya. Agar is pattern ka trend bullish ma ho ga to is pattern kr jo bullish candlestick ho ge on ka trend line sa above ma hona ho ga. Is pattern ma buy ke trade ko enter kiya jay ga jab uptrend ho ga or jab upside tasuki gap pattern ban jay ga or is trade ka stop loss ko place kara ga moving average ka below ma. Ya ak long term trade ho ge is ma traders wait kara ga jab tak ka market moving average ko cross ni kar late.
    • #3 Collapse

      Re: Importance of &quot; Upside Tasuki Candlestcick pattern&quot; in forex Trading.

      Assalamu Alaikum Dosto!


      Tasuki Gap Up Candlestick Pattern


      Tasuki gap up candlestick pattern aik strong bullish trend continuation pattern hai, jiss main teen candles shamil hote hen. Ye pattern aik bullish trend ya high prices main banne par same bullish trend ko jari rakhta hai, jiss se prices aik waqfay k baad upward move karna jari rakhte hen. Tasuki gap up candlestick pattern ka taluq gap pattern se hai, jiss main pehli do candles k darmeyan aik wazih gap banta hai, ye gap prices ko upward side par push karne ka sabab banti hai. Pattern ki third candle sellers ki market main presence dekhati hai, lekin ye candle ziada moasar karkardagi nahi dekhati hai, jiss se prices same bullish trend ko hi jari rakhte hen.

      Click image for larger version

Name:	images (3) (217).png
Views:	25
Size:	9.3 کلوبائٹ
ID:	12408437

      Candles Formation


      Tasuki gap up candlestick pattern teen candles par mushtamil aik bullish trend continuation pattern hai, jiss jo k top area main banne par assets k prices ko mazzeed bullish same trend main upward push karta hai. Tasuki gap up candlestick pattern do bullish aur aik bearish candles se mel kar banta hai, jiss ki tafseel darjazzel hai;

      Click image for larger version

Name:	images (2) (106).jpeg
Views:	23
Size:	11.7 کلوبائٹ
ID:	12408438

      1. First Candle: Tasuki gap up candlestick pattern k pattern main pehli candle aik bullish candle hoti hai, jo k long real body main banti hai. Ye candle prices k maojoda bullish trend ko zahir karti hai, jo k shadow samet ya shadow k bagher ho sakti hai. Pattern ki pehli candle ki closing price open se above hona chaheye.

      2. Second Candle: Tasuki gap up candlestick pattern ki dosri candle bhi same bullish candle hoti hai, jo k pehli candle se upper gap main banti hai. Ye candle bhi shadow ya shadow k bagher ho sakti hai, jab k candle ki close price open price se ziada hona chaheye. Dosri candle ka pehli candle se upper side par gap main hona zarori hai.

      3. Third Candle: Tasuki gap up candlestick pattern ki teesri candle aik bearish candle hoti hai. Ye candle dosri candle ki real body main open ho kar pehli aur dosri candle k darmeyan banne wale gap main close hoti hai. Teesri candle ka close price open price se kam hona chaheye. Ye candle trend reversal karne ki nakam koshash karti hai.

      Explanation

      Tasuki gap up candlestick pattern aik uptrend k dawran uss waqat banta hai, jab investors market main aik mamoli sey waqfey k baad same up-trend ko jari rakhna chahte hen. Pattern teen candles par mushtamil hota hai, jiss main pehli candle aik bullish candle hoti hai, jo k prices k sabeqa bullish trend ki akasi karti hai. Pattern ki dosri candle bhi same bullish candle hoti hai, lekin ziada buying pressure ki waja se ye candle pehli candle k top par gap main banti hai. Pattern k dono candles k darmeyan aik wazih gap hota hai, jo prices k uptrend ki mazboti ki alamat hoti hai. Pattern ki last ya third candle aik bullish candle hoti hai, jo k prices ko bearish trend reversal ki nakam koshash karti hai, q k ye candle dosri candle k baad ya ussi ki real body main open ho kar pehli aur dosri candle k darmeyan banne wale gap main close hoti hai.

      Click image for larger version

Name:	images (3) (218).png
Views:	13
Size:	3.6 کلوبائٹ
ID:	12408439

      Trading

      Tasuki gap up candlestick pattern prices chart par bullish trend ki mazboti ki alamat hoti hai, jab bhi pattern ki teesri bullish candle gap main ya uss se pehle close ho jati hai, jiss se prices ka bearish trend reversal hona nakam ho jata hai. Pattern par trading se pehle teesri candle k gap main close hona zarori hai, jab k aik fourth bullish trend confirmation candle ka hona zarori hai, jo third candle k top par close honi chaheye. Pattern k baad bearish candle banne se market main entry nahi karni chaheye, jab k indicators par value lazmi midpoint se above honi chaheye. Pattern par Stop Loss ka istemal zarori hai, jo k sab se bottom position ya pehli candle k open price se two pips below set ho sakta hai.

      Click image for larger version

Name:	images (3) (216).png
Views:	30
Size:	14.6 کلوبائٹ
ID:	12408436
      • #4 Collapse

        Re: Importance of &quot; Upside Tasuki Candlestcick pattern&quot; in forex Trading.

        Up-Side Tasuki Gap Candlestick Pattern


        Upside Tasuki gap candlestick pattern teen candles par mushtamil aik bullish trend continuation pattern hai. Ye pattern same "Bullish side by side white lines" pattern jaisa hi hai, lekin difference sirf 3rd candle ki color ka hai. Upside Tasuki gap me 3rd candle bearish hoti hai, jab k "Bullish side by side white lines" me 3rd candle same bullish trend ki hi hoti hai, baqi dono pattern bullish trend continuation ka kaam karti hai. Ye pattern ya to qeematon k darmeyan me aur ya bullish trend me banta hai. Yeh pattern aam tawar par supply and demand mein bullish trend ka tasalsul pattern hai. Upside tasuki gap patteren main do bullish candlestick is baat ki numaindagi karte hen k buyers walay market k ooper mukammal control mein hen, jiss se price ki qader mein musalsal izzafa waqea ho raha hai. Prices ka wese bhi bhi basic trend bullish ka hota hai, jo higher high levels ko tashkeel deta hai.

        Click image for larger version

Name:	images (3) (219).png
Views:	7
Size:	5.5 کلوبائٹ
ID:	12408440

        Pattern ki Pehchan

        1. Upside Tasuki gap candlestick pattern ziada tar bullish trend ya qeematon k darmeyan me banta hai q k ye aik trend continuation pattern hai.
        2. Pattern me shamil 1st candle bullish ya white hoti hai. Jo market k current situation ko zahir karti hai.
        3. Pattern ki 2nd candle bhi bullish candle hoti hai, jo k 1st candle se above gap me open aur close hoti hai.
        4. Pattern me shamil 3rd candle aik bearish candle hoti hai, jo k same 2nd candle k parallel me banti hai.
        5. Pattern ki 2nd aur 3rd candle 1st candle se above gap me open aur close hoti hai.
        6. Pattern kn1st aur 2nd candles k darmeyan gap ka wazih hona zarori hai, jis me 3rd candle ka close point bhi ho sakta hai.


        Click image for larger version

Name:	images (2) (107).jpeg
Views:	4
Size:	10.1 کلوبائٹ
ID:	12408441

        Pattern ki Tafseel


        Upside Tasuki gap candlestick pattern bullish trend k continuation k leye jana jata hai, aur ziada tar ye pattern qeematon k darmeyan me ya high price area me banta hai. Pattern ki 1st candle aik real body wali bullish candle hoti hai, jo k sabeqa trend ki nishan-dahi karti hai. Pattern me 1st k baad 2nd candle gap me upside pe open aur close hoti hai. 3rd candle same 2nd candle k parallel me banti hai, lekin ye candle aik bearish candle hoti hai. Pattern ki 2nd aur 3rd candle dono same gap me above open aur close hoti hai. Upside Tasuki gap candlestick pattern "Bullish side by side white lines" pattern se thora sa mukhtalif hai, q k is me shamil 3rd candle bearish hoti hai, baqi dono patterns trend continuation ka kaam karti hai. Pattern teen candles par mushtamil hota hai, jiss main pehli do candles bullish aur akhari aik bearish candle hoti hai. Bullish candles k darmeyan downside par aik wazih gap hota hai, jo k aik qisam ka bullish candles ka kicking pattern dekhaye deta hai. Pattern ki dono bullish candles real body main lazmi honi chaheye, jab k candles k darmeyan banne waley gap ko koi candle (bashamole shadow) cover na kare.

        Click image for larger version

Name:	images (3) (220).png
Views:	2
Size:	1.4 کلوبائٹ
ID:	12408442

        Trading on Pattern


        Upside Tasuki gap candlestick pattern trend continuation ka kaam karti hai, is waja se agar ye pattern qeematon k darmeyan me banta hai, to ye k muasar hone k asarat ziada hotw hen. Bullish trend me banne k baad pattern ki confirmation hona zarori hai, is waja se 3rd bearish trend k baad 4th candle ka intezar karna chaheye. Agar pattern k baad 4th candle aik bullish candle banti hai to ye market me buy ki entry ki position hogi. Stop loss k leye pattern k sab se lower area yani 1st candle k open position ko select karen. Pattern ki teesri bearish candle ziada strong nahi banti hai, jiss se market main trend reversal ki koshash nakam ho jati hai. Pattern par trade entry karne se pehle aik bullish confirmation candle ki zarorat hoti hai, jo k real body main bullish honi chaheye.

        Click image for larger version

Name:	images (2) (108).jpeg
Views:	6
Size:	19.4 کلوبائٹ
ID:	12408443
        • <a href="https://www.instaforex.org/ru/?x=ruforum">InstaForex</a>
        • #5 Collapse

          Re: Importance of &quot; Upside Tasuki Candlestcick pattern&quot; in forex Trading.

          TABLE OF CONTENTSHIDE

          1. Definition
          2. How to identify an upside Tasuki gap candlestick?
          3. Upside Tasuki Gap: Information Table
          4. Understanding the structure of upside Tasuki gap pattern
          5. How to trade an upside Tasuki candlestick pattern?
            1. Simple EMA trading strategy

          6. Conclusion


          Definition

          The upside Tasuki gap is a bullish trend continuation pattern that consists of three candlesticks and an upside gap. Two bullish candlesticks, a gap, and a bearish candlestick form in a specific sequence to confirm the pattern of an upside of the Tasuki gap candlestick.
          This candlestick pattern tells retail traders that the market’s bullish trend will continue, and buyers are in control. It also lets the retail traders hold long positions to maximize the profit potentials.

          How to identify an upside Tasuki gap candlestick?

          To understand the structure of the Tasuki gap candlestick, follow the following guidelines.
          1. The first candlestick will be a significant bullish candlestick representing the massive momentum of buyers and a bullish price trend.
          2. The second candlestick will open with a gap up and outside the range of the previous candlestick. It will have a higher closing price and a small candle size.
          3. The third candlestick will be bearish. It must open within the range of the previous candlestick and close above the closing price of the first candlestick.


          These are the above three requirements you need to check to confirm an upside Tasuki gap candlestick pattern on the price chart.
          Upside Tasuki Gap: Information Table

          Number of Candlesticks 3
          Prediction Bullish trend continuation
          Prior Trend Bullish trend
          Counter Pattern Downside Tasuki gap

          Understanding the structure of upside Tasuki gap pattern

          The structure of a market pattern tells us a story of the activity of institutional traders behind the candlestick chart. It is the best practice to understand that story. Because it will help you in live trading to make the best decisions.
          Let’s read the price chart.
          The first candlestick indicates that buyers control and drive the market in a bullish direction. It also represents the trend of the market that’s bullish.
          After forming a long bullish candle, the price will open with a gap up representing the huge momentum of buyers coming into the market.
          Pro tip: When many buy orders are filled at the end of a session, the candlestick will open with a gap up at a higher price.
          Price always move in the form of impulsive and retracement wave. After retracement, an impulsive wave shall form and vice versa.
          As the two bullish candlesticks show the bullish impulsive wave, a bearish candlestick will form, indicating the retracement wave.
          A deep retracement means the trend’s strength is poor, whereas a minor retracement indicates a strong trend. So that’s why it is in the requirement that the bearish candlestick should close above the closing price of the first candlestick.
          That’s why after a minor retracement in the form of the bearish candlestick, a bullish impulsive wave will form again. It represents the trend continuation.
          How to trade an upside Tasuki candlestick pattern?

          It is a trend continuation candlestick pattern used in trading with the confluence of other technical analysis tools like trendline or moving averages.

          Simple EMA trading strategy

          • Plot a 21 EMA and 38 EMA on the chart. Then confirm the direction of the trend, and it must be bullish. Price will be bullish if candlesticks form above the moving average line.
          • Open a buy order during an uptrend when an upside Tasuki pattern will form and place stop-loss below the moving average line. Hold the trade until moving average crossover does not happen in a bearish direction.


          This is a simple strategy, but you can add other technical analysis tools to make it more precise.
          Conclusion

          Tasuki candlestick pattern is primarily used in the chart of stocks and indices. In forex, engulfing candlestick or pin bar candlesticks are important candlesticks.
          It is always recommended to not rely solely on a single candlestick. You should add other technical tools to make a perfect trading strategy.
          Before trading on a live account, make sure to backtest the trading strategy properly.

          اب آن لائن

          Working...
          X