what is piercing line chart candelsticks???

No announcement yet.
`
X
  • وقت
  • دکھائیں
Clear All
new posts
  • #1 Collapse

    what is piercing line chart candelsticks???
    assalium o alekum

    dear forex member
    umed hai sb kharyt s hun gy or mehnat se apne work ko complete kar rahi hun ki Hamen Har Business mein kamyabi Hasil karne ke liye Apne knowledge ko increase karna chahie isliye Hamen Jyada Se Jyada Apne knowledge ko increase karna chahie Taki Ham apne business Mein Kamyab Ho Chalte Hain market office ki taraf jisse AAP Sab Ka knowledge Jarur gain hoga


    what is piercing line chart ?


    chaidnay wali line patteren ko taizi se reversal candle stuck patteren ke tor par dekha jata hai jo neechay ke rujhan ke neechay waqay hai. jab bail market mein daakhil hotay hain aur qeematon ko ouncha dhakel dete hain to yeh aksar rujhan mein tabdeeli ka ishara deta hai .

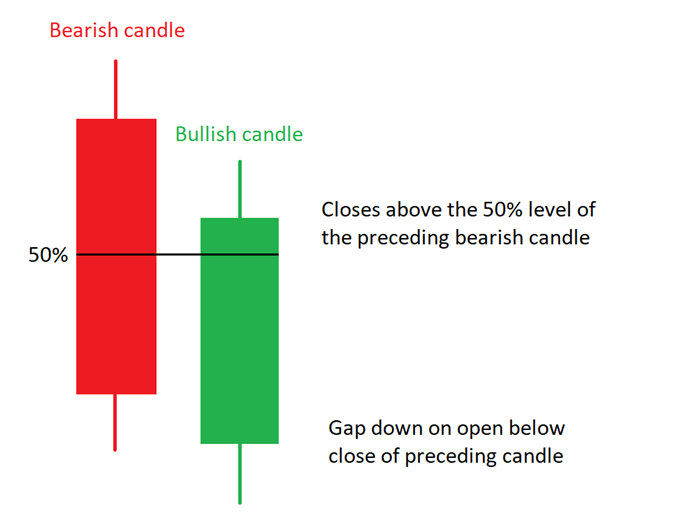
    chaidnay ke patteren mein do candle stuck shaamil hoti hain jis mein doosri blush candle stuck pichli bearish candle se neechay khulti hai. is ke baad khredar qeematein barha rahay hain jo bearish candle ke body ke 50 % se oopar band ho jatay hain .

    neechay di gayi tasweer chaidnay ke patteren ko bananay wali do mom btyon ki pechidgion ko numaya karti hai :

    sorakh karne wali line candle stuck patteren

    Click image for larger version

Name:	Piercing-Line-Pattern-2.png
Views:	22
Size:	20.1 کلوبائٹ
ID:	12541550

    how to identify piercing line chart in forex?


    piercing line ke patteren ki khususiyaat :

    neechay ke rujhan ke neechay hota hai .
    bearish aur blush candle par mushtamil hai .
    blush candle bearish candle ke band honay se kam khulti hai .
    blush candle phir bearish candle body ke 50 % level se oopar band ho jati hai .


    What does this tell traders?

    mumkina rujhan ka ulat jana oopar ki taraf ( bullish reversal )
    reechh ( baichnay walay ) qeemat ki is ahem satah par hosla kho rahay hain .
    bullish engulfing candle ke sath tijarat ke fawaid :

    *naye aur tajurbah car taajiron dono ke liye shanakht karna aasaan hai .

    * sazgaar rissk reward tanasub ka imkaan


    * chaidnay ke patteren ki tasdeeq ke baad matlooba indraaj ki sthin haasil ki ja sakti hain .


    Click image for larger version

Name:	PiercingPatternPic.gif
Views:	22
Size:	9.5 کلوبائٹ
ID:	12541551


    Trading with piercing line chart candelsticks


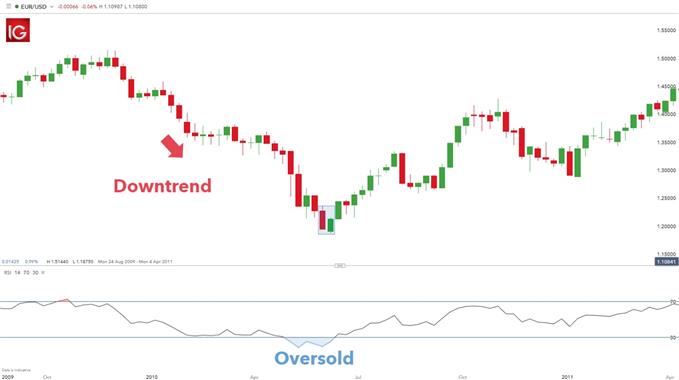
    hafta waar eur / usd oopar wala chart neelay rang mein numaya kardah chaidnay walay patteren ki mojoodgi ko zahir karta hai. is patteren se pehlay aik mazboot neechay ka rujhan hai jaisa ke nichli sthon aur nichli oonchaiyon se zahir hota hai. yeh misaal neechay ke rujhan ka taayun karne ke liye price action ke istemaal ko wazeh karti hai, taham, tajir aksar tasdeeq ke liye aik takneeki isharay ke istemaal ko tarjeeh dete hain jaisay ke moving average ( qeemat taweel mudti moving average se oopar honi chahiye ) .

    jaisa ke pehlay zikar kiya gaya hai, taweel tijarat mein daakhil honay se pehlay chaidnay ke patteren ko mazeed tasdeeq ki zaroorat hoti hai. is misaal mein, rsi oscillator ko ulat jane ki izafi tasdeeq ke tor par istemaal kya gaya hai. chart se, rsi aik over sealed signal ki nishandahi karta hai jo chaidnay ke patteren ki durustagi ko taqwiyat deta hai .

    stop levels ko haliya kam ( blush piercing patteren candle ki kam ) par rakha ja sakta hai, jabkay take praft ( had ) ko fibconci extensions ya price action ke zariye shanakht kya ja sakta hai .

    Click image for larger version

Name:	piercing-pattern-candlestick_body_mainimage.png
Views:	14
Size:	12.7 کلوبائٹ
ID:	12541547
  • <a href="https://www.instaforex.org/ru/?x=ruforum">InstaForex</a>
  • #2 Collapse

    Re: what is piercing line chart candelsticks???

    dear friends kasa ho ap sab umeed ha ap sab thek ho ga or ap ke trading achi ho rahe ho ge or ap log trading karka acha profit bhi hasil kar raha ho ga or mara kuch dost abhi abhi trading start kar raha ho ga jin ko trading ka bara ma abhi kuch bhi ni pata ho ga par aj ma apna inin dosto ka sath forex trading ka kuch point share karo ga jin ko samjna ap sab ka liyaliya zarori ha q ka ya market or trading ma ak kas ahmet rakhta ha. Jo aj ka hamara topic ha os ka name marubozu candlestick pattern ha. Agar ap na aj ka topic sai sa samaj liya toto mujha yaken ha ka ap ko trading ma kuch na kuch profit zaror ho ga to isis liya aj ka topic mara sab dosto ka liya kas hona wala ha jo dost new ha trading ma or jo mare dost kafi time se trading kar rahe hain.

    Marubozu Candlestick Pattern:

    dosto marubozu ak candlestick ke type ha jo ka huma market ke formation ka bara ma batatha ya huma batat ha ka market ke next move kiya ho ge. Ya pattern huma indecate karta ha security price ka bara ma or hum is pattern ke madad sa trade enter karne ke position ko find krta ha ya pattern kabhi bhi market ka opening point or closing point par ni bana ga ya pattern hamasha market ka mid ma bana ga. Is pattern par hum market ka opening or closing price par trade ni kar sakta is pattern ke jo candels ho ge wo koi shadow ni banay ge yani is pattern ke candels ke ak raal body ho ge jis ka koi shadow ni ho ga is pattern ko sirf technical traders he use karta hai.

    Description:

    Ya marubozu name japanese closed croped sa bana ha ya huma chart par nazar ata ha jis candel ka koi shadow ni hota os ma. Ya pattern opening price par depends ni karta na he ya opening price ka batat ha q ka is ka koi shadow ni hota. Up day is ke price hote ha equal low day ka. Or closing price hote ha is pattetn ke high day par. Jis din ya pattern banta ha os din market bull yani up trend ke traf jate ha or jis din ya close hota ha os din market low ke traf ate ha yani bear banate hain.

    Formation:

    Bearish Marubozu candlestick ager down trend main bany to yeh bearish trend ki continuation ka batati hay aur ager bullish trend kay top per bearish marubozu bany to yeh bearish trend reversal ka signal daiti hay. Iska lower and closing same point hota hay jab keh higher and opening same ya some times higher side per small wick hoti hay jo bearish trend reversal ki surat main ban sakti hay. Iski long body hamain bearish trend ki strengthening ka signal daiti hay. Bullish marubozu candlestick ka opening and lower same aur closing and higher same hota hay.
    Like tu banta hay ik🙏
    • #3 Collapse

      Re: what is piercing line chart candelsticks???

      Assalamu Alaikum Dosto!


      Piercing Line Candlestick Pattern


      Piercing line candlestick pattern price chart par aik leading indicator k tawar par kamm karne wala two days ka aik bullish trend reversal pattern hai, jo k bearish trend k dowran prices k semat k change hone se pehle hi trend reversal ka signal de deta hai. Pattern ki pehli candle aik bearish candle hoti hai, jo k sabeqa trend k mutabiq hoti hai, jab k dosre din ki candle aik bullish candle hoti hai, jo open pehli candle k lower gap main hoti hai, lekin close ussi k darmeyan ya midpoint se ziada par hoti hai. Ye candle prices k lower position yanni bearish trend k dowran aik strong prices ki pullback karti hai, jiss se market ka maojoda trend khatam ho jata hai. Pattern ki dosri candle ka lazmi pehli candle k real body main midpoint se above close honi chaheye, yanni dosri candle ko pehli candle k high price ya open price se above close nahi honi chaheye.

      Click image for larger version

Name:	09-Piercing_Line-01-300x300.png
Views:	12
Size:	2.0 کلوبائٹ
ID:	12408523

      Candles Formation


      Piercing line candlestick pattern ki dosri candle k bullish hone k baad market main investor trend badalne par majbor hote hen. Jiss se prices new semat bullish trend ko follow karna shoro karti hai. Pattern main shamil dono candles mukhtalif pattern ki hoti hai, jiss mein pehli candle bearish aur dosri bullish hoti hai, jiss ki tafseel darjazel tarah se hoti hai:

      Click image for larger version

Name:	breTKnrADo.png
Views:	2
Size:	33.1 کلوبائٹ
ID:	12408524

      1. First Candle: Piercing line candlestick pattern main pehli candle aik bearish candle hoti hai, ye candle price k downtrend ko show kar rahi hoti hai, jo k black ya red color ki candle hoti hai. Ye candle aik strong real body main banti hai, yanni candle ki real body shadow se ziada hoti hai.

      2. Second Candle: Piercing line candlestick pattern ki dosri candle aik bullish candle hoti hai, jo k open to pehli candle k bottom par gap main hoti hai, lekin close pehli candle k real body k darmeyan se ooper hoti hai. Ye candle color main white ya green hoti hai, jo k bearish trend ko khatam karti hai, aur prices k bullish trend reversal ka sabab banti hai.

      Explanation

      Piercing line candlestick pattern main two days candlestick ki pehli bearish candle ke baad, agli candle, jo k wazih tawar par aik bullish candle hoti hai, se gap main open hoti hai, yanni pehli candle se nechay open hoti hai, aur phir pichli candle ke 50% retracement ya darmeyan ke oopar wapas band ho jati hai. Yeh pattern price chart par talaash karna bohat aasaan hai, bunyadi tor par yeh chart patteren hamaray liye jis cheez ko jo ziada numaya kar raha hai, woh market k jazbaat mein aik bullish tabdeeli hai. lehaza, hum jantay hain ke ibtidayi tor par sellers walay control mein thay, jis ki wajah se bearish candle ke douran price lower jati hai, lekin agli candle bullish banne se prices mazeed nechay jane se ruk jati hai.

      Click image for larger version

Name:	images (3) (228).png
Views:	59
Size:	10.2 کلوبائٹ
ID:	12408525

      Trading

      Piercing line candlestick pattern wese to bazate-khud aik bullish signal deta hai, lekin dosre indicators jaise RSI, CCI, MACD indicator aur stochastic oscillator k sath yakja karke istemal karne par aik achah result deta hai. Pattern price action k tawar par bearish trend ya low price area main buy ka signal deta hai, jiss k leye indicators par oversold zone ya aik confirmation candle ka hona zarori hai. Confirmation candle bullish real body main honi chaheye aur dosri candle k top par close honi chaheye. Lekin agar pattern k baad bearish candle banti hai, to uss sorat main trade entry nahi karni chaheye. Stop Loss pattern k sab se lower ya dosri candle k bottom se two pips below set kia ja sakta hai.

      Click image for larger version

Name:	images (3) (231).png
Views:	17
Size:	18.2 کلوبائٹ
ID:	12408526
      • #4 Collapse

        Re: what is piercing line chart candelsticks???

        WHAT IS A PIERCING PATTERN?

        The piercing line pattern is seen as a bullish reversal candlestick pattern located at the bottom of a downtrend. It frequently prompts a reversal in trend as bulls enter the market and push prices higher.
        The piercing pattern involves two candlesticks with the second bullish candlestick opening lower than the preceding bearish candle. This is followed by buyers driving prices up to close above 50% of the body of the bearish candle.
        The image below highlights the intricacies of the two candlesticks making up the piercing pattern:
        HOW TO IDENTIFY A PIERCING PATTERN ON FOREX CHARTS?

        Characteristics of a piercing pattern:
        • Occurs at the bottom of a downtrend
        • Includes a bearish and bullish candle
        • The bullish candle opens lower than the close of the bearish candle
        • Bullish candle then closes above the 50% level of the bearish candle body

        What does this tell traders?
        • Potential trend reversal to the upside (bullish reversal)
        • Bears (sellers) are losing impetus at this key price level

        Advantages of trading with the bullish engulfing candle:
        • Easy to identify for both novice and experienced traders
        • Possibility of favourable risk-reward ratios
        • Desirable entry levels can be obtained after confirmation of the piercing pattern

        TRADING WITH THE PIERCING LINE PATTERN: TOP TIPS & STRATEGIES

        The weekly EUR/USD chart above shows the presence of a piercing pattern highlighted in blue. Preceding this pattern is a strong downtrend as indicated by lower lows and lower highs. This example illustrates the use of price action to determine the downtrend, however, traders often prefer the use of a technical indicator such as the moving average for confirmation (price needs to be above the long-term moving average).
        As mentioned previously, the piercing pattern does require further confirmation before entering into a long trade. In this example, the RSI oscillator has been used as additional confirmation of a reversal. From the chart, the RSI indicates an oversold signal which reinforces the validity of the piercing pattern.
        Stop levels can be placed at the recent low (low of the bullish piercing pattern candle), while the take profit (limit) can be identified using Fibonacci extensions or price action.
        HOW RELIABLE IS THE PIERCING LINE?

        Piercing line patterns signal bullish reversals however, the reliance of this pattern alone is not recommended. Further support signals should be used in concurrence with the piercing pattern. Trading against a dominant trend can be risky so finding multiple confirmation signals is encouraged to verify the pattern.
        Occurs frequently within financial markets Signifies bullish reversal patterns only
        Opportunity for favourable risk-reward ratios Trading the piercing pattern requires the use of other technical indicators and oscillators
        Piercing patterns are easy to identify for novice traders Entails looking at the overall market trend and not just the candlestick pattern in isolation
        LEARN MORE ABOUT TRADING WITH CANDLESTICK PATTERNS


        1. Rising wedge and falling wedge patterns
        2. Head and shoulders
        3. Double top
        4. Double bottom


        [COLOR=#6F747D !important]DailyFX provides forex news and technical analysis on the trends that influence the global currency markets.[/COLOR]
        • #5 Collapse

          Re: what is piercing line chart candelsticks???

          oming pigeon ka high point set karna chahiyy
          What is Homing Pigeon Candlestick?
          dosto
          Homing Pigeon Candlestick Pattern to wohi manzar nama tayyar hota hai. aik lambi mandi wali fire ki tashkeel aindah mandi ke rujhan ke imkaan ki tasdeeq karti hai. kuch pursukoon kharidari ki muddat ke baad, kuch kharidari ka dabao khud ko qaim karna shuru kar deta hai. tajir market mein rujhan ke ulat jane ko samajte hain. yeh mafrooza do cndles ke darmiyan faasla peda karta hai. taham, kharidari ka dabao stomach muscle bhi market ko oopar le jane mein nakaam rehta hai, is liye doosri light ko mandi ka saamna karna parta hai....
          Homing Pigeon Candlestick Pattern. mein, aik tajir ko lambi position mein daakhil hona chahiye. stop disaster ko plan ke nichale darjay se neechay rakhna aik danishmandana iqdaam hai. woh stop accident ko doosri line ke nichale hissay se bhi neechay rakh satke hain .kami ke rujhan ke douran, taajiron ko homing pigeon plan ki tashkeel ke baad qeematon mein kami ka kaafi intzaar karna chahiye. stomach muscle, inhen aik mukhtasir position mein daakhil hona chahiye, aur oopar Stop catastrophe rakha hy

          Homing Pigeon and Trading
          sir,
          Homing Pigeon Candlestick Pattern. aik danish mandana faisla hoga .taham, yeh yaad rakhna chahiye ke homing pigeon plan qeemat ka hadaf nahi deta hai. yeh mumkin hai ke oil ke baad koi naya rujhan shuru ho jaye ya qeemat bilkul bhi nah barhay. lehaza, taajiron ko qeemat ke hadaf ko achi terhan se tay shuda rissk reward, achi terhan se pemaiesh shuda iqdaam, ya tijarti hikmat e amli aur risk the board ke mutabiq rakhna chahiye
          Homing Pigeon Candlestick Pattern. ik aesa plan hoty hain jo Kisi bhi support region
          • #6 Collapse

            Re: what is piercing line chart candelsticks???

            Click image for larger version

Name:	7A8159F9-8E88-437E-8D98-94D80AD5A62E.jpeg
Views:	1
Size:	31.1 کلوبائٹ
ID:	12408607Click image for larger version

Name:	0B9212C1-7265-4EBE-B538-D0EF04535356.png
Views:	3
Size:	10.7 کلوبائٹ
ID:	12408608Click image for larger version

Name:	4E667113-839B-4BE3-B2F3-2835614C9AB4.png
Views:	59
Size:	10.2 کلوبائٹ
ID:	12408609


            What is piercing / puncturing line candle design?


            Puncturing line ka patteren aik do commotion ka, light stuck cost ka patteren hai jo disadvantage se le kar upper side ki taraf move karta hai.


            Importance of The Pattern


            Puncturing line ka design aik do commotion ka flame design hai jo down se upperside pe move krnay ki expectation give karta hai. yeh candle design aik aisa design roughage jo for the most part a few days design ki continuety ka signal deta ha. es patteren ki 3 qualities mein se pehlay neechay ki taraf pattern then aik hole aur patteren mein second flame ki against development incorporate ha .


            The most effective method to Identify A Piercing Line Pattern:


            puncturing line design ki distinguished karnay k kuch rules hain jinko agar ham observe kartay hain to ham is design k sath market principle great exchanging kar skatay hain...

            I) Piercing line design ko perceive karnay k liye market fundamental pattern down ka hona chaye

            ii) first large candle ki body cost ko drawback run karty huw nazar ani chaye

            iii) first aur second candles ki bodies cost principle hole aur inversion ka show kar rahi hon

            iv) Bullish aur negative candles ki bodies ka large hona bhi zaruri hai


            agar brokers diagram follow through on aisay revers cost design ka base say down start daikhain to ham outline pay isay penetrating line design ka name daitay huway exchanges kr skty hain... Apni exchanging ko Kamyab banane ke liye Hamesha Aise different sort ke designs ko follow Karte Rehna chahie Jitna Jyada Hamen Aise designs ko samajhne aur in per kam karne ka mauka Milega To Ham apni exchanging ko solid bana sakte hain Agar Apne exchanging capacity aur abilities ko improve karna chahte hain to hamesha candle ke different sort ke Pattrens ko follow Karte Raha Karen aur unko samajhne ke liye markers ka use Kiya Karen Jitna zyada pointer ko use karte tint Ek arranging ke sath apni exchanging ko perform Karenge to aapko in candle design Se Achcha result Milega aur ap apni exchanging ko bahut greetings aasani ke sath Kamyab bana sakte hain
            • <a href="https://www.instaforex.org/ru/?x=ruforum">InstaForex</a>
            • #7 Collapse

              Re: what is piercing line chart candelsticks???

              WHAT IS PIERCING LINE CHART PATTERN :


              Piercing pattern ak candlestick pattern ho ja ka market ka reverse hona ka kam karta ha is ma market reverse ho kar downward sa upward ke traf jate ha ya pattern do candle sa mil kar banta ha jen ke madad sa wo market ko reverse karta ha or is pattern ma market apna current trend ka opposite ma jate ha. Jab ya pattern banta ha to market ak trend banate hoi downward ma jate ha or ya pattern downtrend ka end ma banta ha. Is pattern ke first candle downward trend ko follow karte hoi high ma bante ha or market ko down la ja kar low ma he close ho jate ha or is candle ka large size trading range hote ha. Is pattern ke first candle ka bad market ma gap ata ha ya gap market ma first candle sa low ma ata ha is gap ka bad second candle open hote ha jo ka market ko reverse karte ha or ya opposite hote ha first candle ka or ya low sa open hote ha or high ma close hote ha ya second candle cover kara ge takreban first candle ke half length tak.


              UNDERSTANDING PIERCING PATTERN :


              Piercing pattern two day candlestick sa banta ha is pattern ke first candle ma market decline hote ha or ya first candle is pattern ke huma market ka sellers ka batate ha or jo second candle ha wo is ka opposite ma bante ha ya sellers ka control ko lose or buyers ka control ka batate ha jes ka bad market reverse ho kar rise hote ha. Ya pattern huma batata ha ka jo supply ha shares ke wo os ko sell kiya jay ga jes ke waja sa market decline ho ge or jab price drive ho kar down ma jay ge to or is low level sa market ka demand share ka increase ho jay ga jes ka bad market ak strong reversal trend banate hoi upward ke traf jay ge.


              FORMATION OF PIERCING PATTERN :


              Following characteristics jo ka is piercing pattern ko banata ha :


              1: Ya piercing pattern market ma tab banay ga jab market downward trend ma move ho rahe ho ge yani ya pattern downtrend ma banay ga ya downtrend short term ka ho ga magar is ke jo candle banay ge wo market ma is short term downtrend ka end ma ho ge is ma market ka reversal ho ga magar ya koi important reversal indecator ni ha.

              2: Is pattern ke jo first candle banay ge wo downtrend ma he banay ge or downtrend ke traf he move kara ge ya candle market ka chart ma red ya black colour ke ho ge is candle ma market ak long candle bante hoi market ko low ke traf la kar jay ge ya canlde huma market ka bear ka pressure ka batay ge q ka jab ya candle banay ge to os time market ma bear ka pressure ho ga jes ke waja sa market downward jay ge.

              3: Is pattern ke first candle ka low ma close hona ka bad market ma low ke traf he ak gap ay ga ya gap ak short gap ho ga or is low gap ka bad market ma second candle open ho ge jo ka low sa open ho ge ya candle white ya green colour ke ho ge ya candle previous candle ka opposite ke traf banay ge or is candle sa market ma reverse hona start ho jay ga ya reversal market ka down sa up ke traf ho ga ys second candle low sa open ho ge or high ma close ho ge jo buy ka pressure ka batay ge.

              4: Jo is pattern second candle ho ge is ka must ho ga ka wo high ma jay or ya candle takreban first candle ka middle tak high ma ay. Ya second candle jab previous candle ka middle tak up ma ay ge to ya huma batay ge ka jo sellers ha onho na market ma apna control ko loses kar diya ha or ab buyers ka pressure increase ho raha ha.


              TRADING WITH PIERCING PATTERN :


              Piercing pattern ak reversal pattern ha ya pattern market ma bearish ka trend ma banta ha is ma reversal bullish ke traf hote ha yani is pattern ma market bearish to bullish move hote ha. Is pattern ma traders is pattern ke dono candleas ka close hona ka wait kara ga or traders is ma dakha ga ka first candle ka bad market ma gap aya ha ya ni agar gap aya ha to ya is pattern ka reversal ke significant ko increase kara ga or is pattern ma traders ga dakha ga ka jo second candle ha kiya wo first candle ka middle tak reverse hoi ha ya ni. Is pattern ko market ka chart ma spot karna bahot he asan hota ha ya pattern downward ma do candle sa banay ga jo ka opposite hote ha ak dosra sa. Is pattern ke conformation ka liya traders is pattern ka sath different indecator ko use kara ga jasa ka support level or oversold srea agar ya pattern support level ka kareb banta ha to market ka reversal hona ka bahot he zada chances hota ha. Is pattern ma traders buy ke trade ko enter kara ga is trade ko is pattern ke second candle ka high sa enter kara ga or stop loss ko is pattern ka gap ka low ma rakha ga.

              اب آن لائن

              Working...
              X