With reference to some history
Dosto aaj ka hamara topic hay bolinger band indicator
Bollinger band indicator aik technical tool hai jis ko widely investtors aor traders use krty hain. Isko John Bollinger ny 1980 ma create kia tha. Yeh indicator baahot sari markets ma use kia ja sakta hai jis a future stocks aor currency market forex tma use kia ja sakta haai. Yeh band hamen aik unique insight rovide krta hai between volatility and price breakouts ky bart ma.Bollinger bands hamen market ka trend ky bary ma information provide krta hai.
Under Disscation Points
1 Bollinger Band Trading Strategie
2 Uses of Bollinger Band
3 Bollinger Band Indicator And Other Technec
4 As A Precautionary Measure
Bollinger Band Trading Strategie
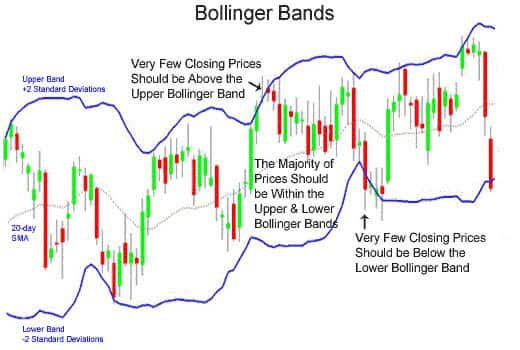
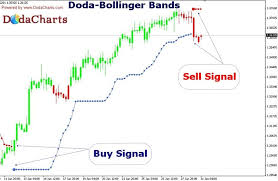
Bollinger band ma market jub center band ky upoer hoti hai to neutral trend count hota haai. jub market upper band ky oas hoti hai to us waqat overbiught situation hoti hai. Lkn is ki aik main nishani hai. Jub bhi Candle baand ko break krr ky outside py close ho aor next candle bearish bn jay aor wo and ky ander cose ho to apko wahaan sy aaik best seling opportunity milti hai. Keun ky yeh aik nest overbought condition ka signal hota hai. Apko is ky sath jub market lower baand ko break kr ky iuter side close ho aor phr next candle bullish bn jaay to yeh aik oversold condition ka signal hota haai apko wahan sy buying opportunity leni chue aor apka target middlee band hona chahye

Uses of Bollinger Band
Bollinger band hamen market ko determine krny ma help provide krta hai kesa ky oversold, overbiught, trend following and trend breakouts my bary ma btata hai.yeh indicator simply 20 DMA moving average band jo ky moddle ma hita hai us ky ky reference sy signal provide krta hai. Bollinger band ma basic three bands hoty hain air yeh aik River ki shape ma movement of market ko show krta hai. Market in three bands ky ander move krti hai.In ma sy aik upoer band lower band aor middle band hoty hain.

Bollinger Band Indicator And Other Technec
Bollinger band ky sath apko trend line ya phr other tools ko bhi use krna chye koi bhi indicator best standalone information perfect nhi deta hai. Apko bollinger band ko use krna aor understand krna sekhna chye ta ky apko best results milen aor ap confidence sy trading kr saken. Strategy ko use krny ky sath sath apko best management bhi krni chye. Trending market ma yeh best indicator hai. Bollinger baand aor RSI ko combined use krna zeyada benefits deta hai

As A Precautionary Measure
Dosto jaisa ke har woh trader jo trading ko as a profational karte hain un ko yakinin mare is bat se itafaq hoga ke mahfooz trading ke liye STOP LOSS kitna zarore hay lihaza aap ko is bare main sangedge se soachna hoga
Dosto aaj ka hamara topic hay bolinger band indicator
Bollinger band indicator aik technical tool hai jis ko widely investtors aor traders use krty hain. Isko John Bollinger ny 1980 ma create kia tha. Yeh indicator baahot sari markets ma use kia ja sakta hai jis a future stocks aor currency market forex tma use kia ja sakta haai. Yeh band hamen aik unique insight rovide krta hai between volatility and price breakouts ky bart ma.Bollinger bands hamen market ka trend ky bary ma information provide krta hai.
Under Disscation Points
1 Bollinger Band Trading Strategie
2 Uses of Bollinger Band
3 Bollinger Band Indicator And Other Technec
4 As A Precautionary Measure
Bollinger Band Trading Strategie
Bollinger band ma market jub center band ky upoer hoti hai to neutral trend count hota haai. jub market upper band ky oas hoti hai to us waqat overbiught situation hoti hai. Lkn is ki aik main nishani hai. Jub bhi Candle baand ko break krr ky outside py close ho aor next candle bearish bn jay aor wo and ky ander cose ho to apko wahaan sy aaik best seling opportunity milti hai. Keun ky yeh aik nest overbought condition ka signal hota hai. Apko is ky sath jub market lower baand ko break kr ky iuter side close ho aor phr next candle bullish bn jaay to yeh aik oversold condition ka signal hota haai apko wahan sy buying opportunity leni chue aor apka target middlee band hona chahye
Uses of Bollinger Band
Bollinger band hamen market ko determine krny ma help provide krta hai kesa ky oversold, overbiught, trend following and trend breakouts my bary ma btata hai.yeh indicator simply 20 DMA moving average band jo ky moddle ma hita hai us ky ky reference sy signal provide krta hai. Bollinger band ma basic three bands hoty hain air yeh aik River ki shape ma movement of market ko show krta hai. Market in three bands ky ander move krti hai.In ma sy aik upoer band lower band aor middle band hoty hain.
Bollinger Band Indicator And Other Technec
Bollinger band ky sath apko trend line ya phr other tools ko bhi use krna chye koi bhi indicator best standalone information perfect nhi deta hai. Apko bollinger band ko use krna aor understand krna sekhna chye ta ky apko best results milen aor ap confidence sy trading kr saken. Strategy ko use krny ky sath sath apko best management bhi krni chye. Trending market ma yeh best indicator hai. Bollinger baand aor RSI ko combined use krna zeyada benefits deta hai
As A Precautionary Measure
Dosto jaisa ke har woh trader jo trading ko as a profational karte hain un ko yakinin mare is bat se itafaq hoga ke mahfooz trading ke liye STOP LOSS kitna zarore hay lihaza aap ko is bare main sangedge se soachna hoga

تبصرہ
Расширенный режим Обычный режим